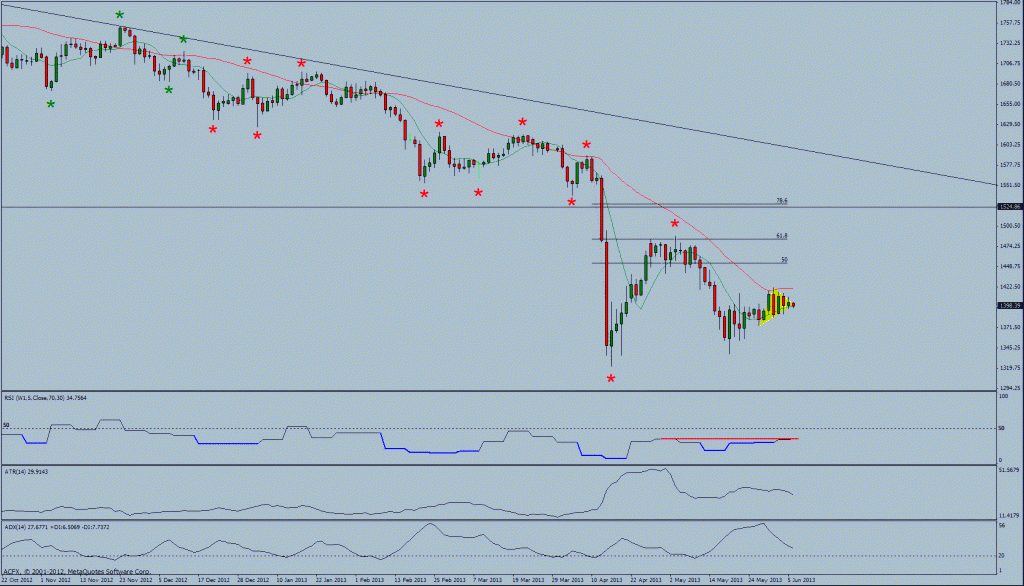
Daily Technical Analysis 12.4.2013 By ACFX.com

Daily Technical Analysis 04.06.2013 By ACFX.com

Postby Atlas CapitalFx » Tue Jun 04, 2013 4:03 am

Daily Technical Analysis for EURUSD as at 4th June 2013
DAILY OVERVIEW
Trend : Short
Ambush Zone : 1.3015 – 1.3145
Target 1 : 1.2795
Target 2 : 1.2745
Stop : 1.3245
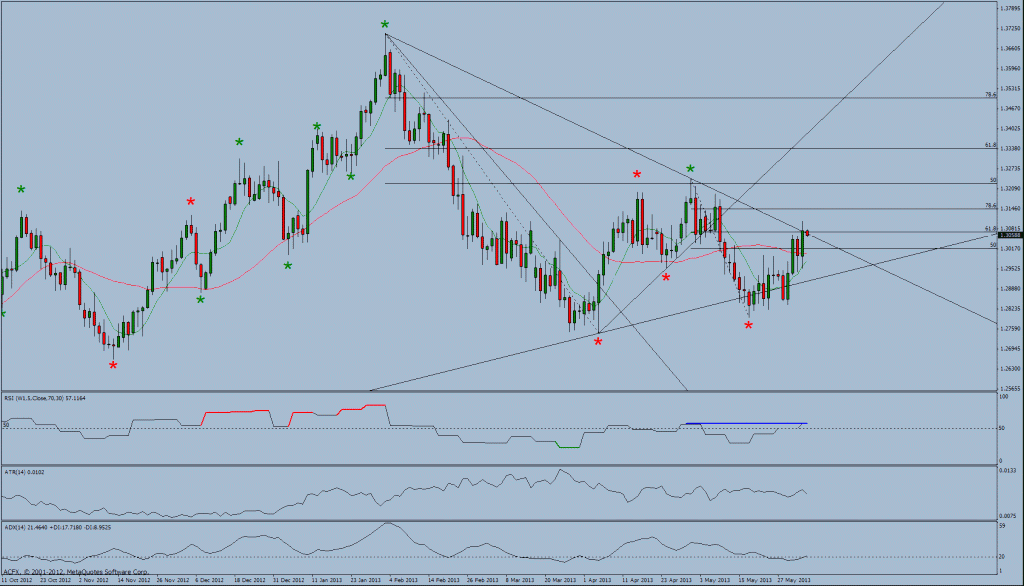
Image


Comments
EURUSD is this morning trading lower from the open after yesterdays up day with that candle printing a piercing line. Today’s opening range is 24 pips which equates to 24% of the daily average true range.
In terms of the bigger picture the swing bias remains negative and the averages are confirming the market direction. Furthermore we have the RSI is diverging positively negatively.
However the price action is trading and closed above both averages which could be viewed as the market being overbought when the market is in a down trend or the market bias attempting to change its position from negative to positive.
If one was to move to the higher time frame Weekly chart it is easier to see that the price action is in the process of forming a higher low but confirmation is required for a change of trend to be established. Back to a daily time frame a prior swing high breach would confirm a possible change of trend.
That the price action is trading at overhead resistance in terms of the downward sloping trend line and Fibonacci resistance may put a brake on further upward momentum. However one hurdle in terms closing above the long average has been overcome.
Scenario 1
As the dominant daily trend is down the retracement into Fibonacci resistance combined with overhead trend line resistance might offer shorting opportunities. However we have yet to notice any loss of momentum that could be identified by an oscillator divergence or candle stick pattern. The initial target for any down break would be the 17th May prior swing low.

Scenario 2
Alternatively EURUSD could continue its retracement so as to eventually breach the downward sloping trend line.


Daily Technical Analysis for GBPUSD as at 4th June 2013
DAILY OVERVIEW
Trend : Short
Ambush Zone : 1.5260 – 1.5470
Target 1 : 1.5000
Target 2 : 1.4865
Stop : 1.5600


Image


Comments
GBPUSD is this morning unchanged from the open after yesterdays strong up day with that candle printing a piercing line. Today’s opening range is 32 pips which equates to a 27% of the daily average true range.

In terms of the bigger picture he swing bias remains negative and the averages are confirming the market direction. However he price action has retraced and is currently trading above both short and long averages.

If one was to move to the higher time frame Weekly chart it is easier to see that the price action is in the process of forming a higher low but confirmation is required for a change of trend to be established.
Back to a daily time frame a prior swing high breach would confirm a possible change of trend. Overhead resistance however in terms the downward sloping trend line and Fibonacci resistance might limit further upward momentum.
Scenario 1
As the dominant daily trend is down the retracement into overhead resistance being the averages might, Fibonacci resistance and the downward sloping trend line might offer shorting opportunities. However we have yet to notice any loss of momentum that could be identified by an oscillator divergence or candle stick pattern. The initial target for any down break would be the upward sloping trend line that may offer some support followed by the 12th March prior swing low.

Scenario 2
Alternatively GBPUSD could continue its upward momentum towards the downward sloping trend line.


Daily Technical Analysis for USDJPY as at 4th June 2013
DAILY OVERVIEW
Trend : Long
Ambush Zone : 100.50 – 98.40
Target 1 : 104.00
Target 2 : 110.00
Stop : 97.00


Image

Comments
USDJPY is this morning trading higher from the open after yesterdays down day. Today’s opening range is 99 pips which equates to 72% of the daily average true range.

In terms of the bigger picture the swing bias remains positive and the averages are confirming the market direction. However he price action has retraced and is currently trading under both the long averages and within Fibonacci support. Furthermore a large RSI is positive divergence is forming and trend line support is now very close.

Scenario 1
As the dominant daily trend is up this deep retracement into the averages and Fibonacci support may offer buying opportunities. This would also be in line with the RSI positive divergence.

We have identified the following levels as possible long targets.
1. A retouch of 104.00 being the 161.80 Fibonacci Expansion target.
2. The 105.00 level being the 200 percent Fibonacci Expansion target.
3. Around 108.00 being long term trend line resistance.
4. 110.00 being a prior Swing High Pivot.
Scenario 2
Alternatively USDJPY could continue its retracement potentially to trend line support and then the prior pivot swing low.


Daily Technical Analysis for USDCHF as at 4th June 2013
DAILY OVERVIEW
Trend : Long
Ambush Zone : 0.9550 – 0.9370
Target 1 : 0.9840
Target 2 : 0.9970
Stop : 0.9245


Image


Comments
USDCHF is this morning trading higher from the open lower after yesterdays up day. Today’s opening range is 30 pips which equates to 24% of the daily average true range.

In terms of the bigger picture the swing bias remains positive and the averages are confirming the market direction. Furthermore there have been some significant trend line breaks to the upside which although have since retraced still puts a positive feel to USDCHF. This has been reinforced by the RSI is diverging positively.

From the negative aspect the price action has retraced and is currently trading under both short and long averages and to the bottom end of the Fibonacci support range.

Scenario 1
As the dominant daily trend is up the deep retracement into the averages and possible further move into Fibonacci support could be interpreted as oversold and might offer buying opportunities. Now that a loss of momentum has been identified in that the weekly RSI is diverging positively does give the long side some extra weight. The initial target for any down break would be the 22nd May prior swing high.

Scenario 2
Alternatively the price action could possibly continue its correction down into Fibonacci support and then the upward sloping trend line.


Daily Technical Analysis for Gold as at 4th June 2013
DAILY OVERVIEW
Trend : Short
Ambush Zone : 1452.60 – 1525.85
Target 1 : 1321.75
Target 2 : 1308.08
Stop : 1590.20

Image


Comments
Gold is this morning trading lower from the open after yesterdays up day with that candle printing a piercing line. Today’s opening range is 870 pips which equates to 27% of the daily average true range

In terms of the bigger picture the swing bias remains negative and the averages are confirming the market direction. The RSI is diverging negatively and as the price action has retraced and is currently trading between both short and long averages. This could imply that resumption in downward momentum may possibly be imminent.

From a bullish perspective it would appear that Gold is in the process of forming a higher low but confirmation is required for a change of trend to be established. A prior swing high breach would confirm a possible change of trend. Overhead resistance however in terms of the long average and Fibonacci resistance may put a brake on further upward momentum.

Scenario 1
As the dominant daily trend is down the retracement into the averages might possibly offer shorting opportunities at resistance. The initial target for any down break would be the 20th May prior low.

Scenario 2
Alternatively as Gold has closed above the 8 period moving averages the potential for a move to Fibonacci resistance comes into play.


Daily Technical Analysis for Oil (WTI) as at 4th June 2013
DAILY OVERVIEW
Trend : Short
Ambush Zone : -
Target 1 : -
Target 2 : -
Stop : -


Image


Comments
Oil is this morning trading lower from the open after yesterdays strong up day with that candle printing a piercing line. Today’s opening range is 46 pips which equates to 25% of the daily average true range.

In terms of the bigger price action continues to trade near the top of a large monthly converging triangle. However following the breach of the prior pivot low the swing bias has changed from positive to negative. This has coincided with breach of a prior broken upward sloping trend line. The averages have just crossed and our now confirming the market direction.

From a bullish perspective the price action has retraced and is trading just above Fibonacci support.

Scenario 1
As the dominant daily trend has changed to negative we are monitoring the possibility of continued move down with corrective pullbacks offering possible selling opportunities.

Scenario 2
Alternatively as the price action is trading around Fibonacci support we are monitoring the possibility of a bounce and even a resumption of the prior up trend with potential targets the 100 % and 138.2% Fibonacci Expansion level in the areas of 99.00 and 103.00 respectively. However the psychological 100.00 level will need to be broken for any further upside to continue.
Atlas CapitalFx
 
Posts: 678
Joined: Mon Dec 17, 2012 7:53 am

Daily Technical Analysis 05.06.2013 By ACFX.com

Postby Atlas CapitalFx » Wed Jun 05, 2013 4:13 am

Daily Technical Analysis for EURUSD as at 5th June 2013
DAILY OVERVIEW
Trend : Short
Ambush Zone : 1.3015 – 1.3145
Target 1 : 1.2795
Target 2 : 1.2745
Stop : 1.3245


Image


Comments
EURUSD is this morning trading higher from the open after yesterdays up day which closed above the downward sloping trend line. Today’s opening range is 31 pips which equates to 31% of the daily average true range.

In terms of the bigger picture the swing bias remains negative.

The following factors are confirming or reinforcing this market bias:
1. The averages are confirming the market direction.
2. The price action is trading above both negatively layered averages which can be viewed as over bought.
3. RSI continues to diverge negatively.
4. The price action has retraced deep into Fibonacci resistance.
5. The price action has managed to break above the downward sloping trend line which could be viewed as over bought.
Alternative counter trend bullish factors:
1. The price action has broken and closed above both averages.
2. The moving averages are attempting to cross positively.
3. The price action has broken above the downward sloping trend line which could be viewed as a warning of pending trend reversal to the upside.
4. If one was to move to the higher time frame Weekly chart it is easier to see that the price action is in the process of forming a higher low but confirmation is required for a change of trend to be established.
Scenario 1
As the dominant daily trend is down the retracement into Fibonacci resistance combined with trend line resistance might offer shorting opportunities. The initial target for any down break would be the 17th May prior swing low.

Scenario 2
Alternatively as EURUSD has now breached and closed above trend line resistance the long side may come into focus. However from a technical stand point a prior swing high breach would be required to confirm a change of trend.


Daily Technical Analysis for GBPUSD as at 5th June 2013
DAILY OVERVIEW
Trend : Short
Ambush Zone : 1.5260 – 1.5470
Target 1 : 1.5000
Target 2 : 1.4865
Stop : 1.5600

Image


Comments
GBPUSD is this morning trading higher from the open after yesterdays down day. Today’s opening range is 43 pips which equates to a 38% of the daily average true range.

In terms of the bigger picture he swing bias remains negative.

The following factors are confirming or reinforcing this market bias:
1. The averages are confirming the market direction.
2. The price action is trading above both negatively layered averages which can be viewed as over bought.
3. The price action has retraced into Fibonacci resistance.
4. Overhead resistance however in terms the downward sloping trend line might limit further upward momentum.
Alternative counter trend bullish factors:
1. The price action has broken above and closed above both averages.
2. If one was to move to the higher time frame Weekly chart it is easier to see that the price action is in the process of forming a higher low but confirmation is required for a change of trend to be established.
3. No sign yet of a negative divergence in the weekly RSI.
Scenario 1
As the dominant daily trend is down the retracement into overhead resistance being the averages might, Fibonacci resistance and the downward sloping trend line might offer shorting opportunities. However we have yet to notice any loss of momentum that could be identified by an oscillator divergence or candle stick pattern. The initial target for any down break would be the upward sloping trend line that may offer some support followed by the 12th March prior swing low.

Scenario 2
Alternatively GBPUSD could continue its upward momentum towards the downward sloping trend line. However from a technical stand point a prior swing high breach would be required to confirm a change of trend.


Daily Technical Analysis for USDJPY as at 5th June 2013
DAILY OVERVIEW
Trend : Long
Ambush Zone : 100.50 – 98.40
Target 1 : 104.00
Target 2 : 110.00
Stop : 97.00


Image

Comments
USDJPY is this morning trading lower from the open after yesterdays up day. Today’s opening range is 108 pips which equates to 77% of the daily average true range.

In terms of the bigger picture the swing bias remains positive.

The following factors are confirming or reinforcing this market bias:
1. The averages are confirming the market direction.
2. The price action is trading below both positively layered averages which can be viewed as over sold.
3. RSI continues to diverge positively.
4. The price action has retraced deep into Fibonacci support.
5. The price action is trading just upward sloping trend line support.
Alternative counter trend bearish factors:
1. The price action has broken beneath and closed above both averages.
2. The moving averages are attempting to cross negatively.
Scenario 1
As the dominant daily trend is up this deep retracement into the averages and Fibonacci support may offer buying opportunities. This would also be in line with the RSI positive divergence.

We have identified the following levels as possible long targets.
1. A retouch of 104.00 being the 161.80 Fibonacci Expansion target.
2. The 105.00 level being the 200 percent Fibonacci Expansion target.
3. Around 108.00 being long term trend line resistance.
4. 110.00 being a prior Swing High Pivot.
Scenario 2
Alternatively USDJPY could continue its retracement potentially to trend line support and then the prior pivot swing low. . However from a technical stand point a prior swing low breach would be required to confirm a change of trend.


Daily Technical Analysis for USDCHF as at 5th June 2013
DAILY OVERVIEW
Trend : Long
Ambush Zone : 0.9550 – 0.9370
Target 1 : 0.9840
Target 2 : 0.9970
Stop : 0.9245


Image


Comments
USDCHF is this morning trading higher from the open lower after yesterdays marginal down day. Today’s opening range is 38 pips which equates to 31% of the daily average true range.

In terms of the bigger picture the swing bias remains positive.

The following factors are confirming or reinforcing this market bias:
1. The averages are confirming the market direction.
2. The price action is trading beneath both positively layered averages which can be viewed as over sold.
3. RSI continues to diverge positively.
4. The price action has retraced deep into Fibonacci support.
5. The price action has managed to break below the downward sloping trend line which could be viewed as over sold.
Alternative counter trend bullish factors:
1. The price action has broken and closed below both averages.
2. The moving averages are attempting to cross negatively.
3. The price action has broken beneath the downward sloping trend line which could be viewed as a warning of pending trend reversal to the downside.
Scenario 1
As the dominant daily trend is up the deep retracement into the averages and possible further move into Fibonacci support could be interpreted as oversold and might offer buying opportunities. Now that a loss of momentum has been identified in that the weekly RSI is diverging positively does give the long side some extra weight. The initial target for any down break would be the 22nd May prior swing high.

Scenario 2
Alternatively the price action could possibly continue its correction down into Fibonacci support and then the downward sloping trend line. . However from a technical stand point a prior swing low breach would be required to confirm a change of trend.


Daily Technical Analysis for Gold as at 5th June 2013
DAILY OVERVIEW
Trend : Short
Ambush Zone : 1452.60 – 1525.85
Target 1 : 1321.75
Target 2 : 1308.08
Stop : 1590.20

Image


Comments
Gold is this morning trading higher from the open after yesterdays down day. Today’s opening range is 108 pips which equates to 34% of the daily average true range

In terms of the bigger picture the swing bias remains negative.

The following factors are confirming or reinforcing this market bias:
1. The averages are confirming the market direction.
2. The price action is trading between both negatively layered averages which can be viewed as a possible shorting area.
3. RSI continues to diverge negatively.
4. The price action is approaching Fibonacci resistance.
Alternative counter trend bullish factors:
1. The moving averages are both rising and converging and converging which could be a sign of a potential positive cross over.
2. If one was to move to the higher time frame Weekly chart it is easier to see that the price action is in the process of forming a higher low.
3. There is still some distance between the current price and Fibonacci resistance which gives the price action some space to pull back further.
Scenario 1
As the dominant daily trend is down the retracement into the averages might possibly offer shorting opportunities at resistance. The initial target for any down break would be the 20th May prior low.

Scenario 2
Alternatively as Gold has closed above the 8 period moving averages the potential for a move to Fibonacci resistance comes into play. However from a technical stand point a prior swing high breach would be required to confirm a change of trend.


Daily Technical Analysis for Oil (WTI) as at 5th June 2013
DAILY OVERVIEW
Trend : Short
Ambush Zone : -
Target 1 : -
Target 2 : -
Stop : -


Image


Comments
Oil is this morning trading lower from the open after yesterdays strong up day that closed above a prior broken upward sloping trend line. Today’s opening range is 47 pips which equates to 25% of the daily average true range.

The price action continues to trade near the top of a large monthly converging triangle. However following the breach of the prior pivot low the swing bias has changed from positive to negative.

In terms of the bigger picture the swing bias remains negative.

The following factors are confirming or reinforcing this market bias:
1. The averages are confirming the market direction.
2. The price action is trading within negatively layered averages which can be viewed as possible shorting area.
Alternative counter trend bullish factors:
1. The price action has broken and closed above both averages which could be viewed as over bought.
2. The price action has broken above the upward sloping trend line which could be viewed as a warning of pending trend reversion to the upside.
3. From a bullish perspective the price action has retraced and is trading just above Fibonacci support.
4. No sign yet of a negative divergence in the weekly RSI.
Scenario 1
As the dominant daily trend has changed to negative we are monitoring the possibility of continued move down with corrective pullbacks offering possible selling opportunities.

Scenario 2
Alternatively as the price action is trading around Fibonacci support we are monitoring the possibility of a bounce and even a resumption of the prior up trend with potential targets the 100 % and 138.2% Fibonacci Expansion level in the areas of 99.00 and 103.00 respectively. However the psychological 100.00 level will need to be broken for any further upside to continue.
Atlas CapitalFx
 
Posts: 678
Joined: Mon Dec 17, 2012 7:53 am

Daily Technical Analysis 06.06.2013 By ACFX.com

Postby Atlas CapitalFx » Thu Jun 06, 2013 4:40 am

Daily Technical Analysis for EURUSD as at 6th June 2013
DAILY OVERVIEW
Trend : Short
Ambush Zone : 1.3015 – 1.3145
Target 1 : 1.2795
Target 2 : 1.2745
Stop : 1.3245

Image

Comments
EURUSD is this morning trading higher from the open after yesterdays up day which saw the averages cross positively. Today’s opening range is 35 pips which equates to 35% of the daily average true range.

In terms of the bigger picture the swing bias remains negative.

The following factors are confirming or reinforcing this market bias:
1. The price action is trading above both positively layered averages which could be viewed as over bought.
2. RSI continues to diverge negatively.
3. The price action has retraced deep into Fibonacci resistance.
4. The price action has managed to break above the downward sloping trend line which could be viewed as over bought.
Alternative counter trend bullish factors:
1. The price action has broken and closed above both averages.
2. The moving averages have crossed positively.
3. The price action has broken above the downward sloping trend line which could be viewed as a warning of pending trend reversal to the upside.
4. If one was to move to the higher time frame Weekly chart it is easier to see that the price action is in the process of forming a higher low but confirmation is required for a change of trend to be established.
Scenario 1
As the dominant daily trend is down the retracement into Fibonacci resistance combined with trend line resistance might offer shorting opportunities. The initial target for any down break would be the 17th May prior swing low.

Scenario 2
Alternatively as EURUSD has now breached and closed above trend line resistance and with the averages also crossing positively the long side may come into focus. However from a technical stand point a prior swing high breach would be required to confirm a change of trend.


Daily Technical Analysis for GBPUSD as at 6th June 2013
DAILY OVERVIEW
Trend : Short
Ambush Zone : 1.5260 – 1.5470
Target 1 : 1.5000
Target 2 : 1.4865
Stop : 1.5600

Image


Comments
GBPUSD is this morning trading marginally higher from the open after yesterdays strong up day. Today’s opening range is 34 pips which equates to a 30% of the daily average true range.

In terms of the bigger picture he swing bias remains negative.

The following factors are confirming or reinforcing this market bias:
1. The averages are confirming the market direction.
2. The price action is trading above both negatively layered averages which can be viewed as over bought.
3. The price action has retraced into Fibonacci resistance.
4. Overhead resistance however in terms the downward sloping trend line has been reached and might limit further upward momentum.
Alternative counter trend bullish factors:
1. The price action has broken and closed above both averages.
2. If one was to move to the higher time frame Weekly chart it is easier to see that the price action is in the process of forming a higher low but confirmation is required for a change of trend to be established.
3. No sign yet of a negative divergence in the weekly RSI.
Scenario 1
As the dominant daily trend is down the retracement into overhead resistance being the averages might, Fibonacci resistance and the downward sloping trend line might offer shorting opportunities. However we have yet to notice any loss of momentum that could be identified by an oscillator divergence or candle stick pattern. The initial target for any down break would be the upward sloping trend line that may offer some support followed by the 12th March prior swing low.

Scenario 2
Alternatively GBPUSD could continue its upward momentum and breach the downward sloping trend line. However from a technical stand point a prior swing high breach would be required to confirm a change of trend.


Daily Technical Analysis for USDJPY as at 6th June 2013
DAILY OVERVIEW
Trend : Long
Ambush Zone : 100.50 – 98.40
Target 1 : 104.00
Target 2 : 110.00
Stop : 97.00

Image


Comments
USDJPY is this morning trading higher from the open after yesterdays down day. Today’s opening range is 61 pips which equates to 44% of the daily average true range.

In terms of the bigger picture the swing bias remains positive.

The following factors are confirming or reinforcing this market bias:
1. The price action is trading below both averages which can be viewed as over sold.
2. RSI continues to diverge positively.
3. The price action has retraced deep into Fibonacci support.
4. The price action is trading just upward sloping trend line support.
Alternative counter trend bearish factors:
1. The price action has broken beneath and closed above both averages.
2. The moving averages are attempting to cross negatively.
Scenario 1
As the dominant daily trend is up this deep retracement into the averages and Fibonacci support may offer buying opportunities. This would also be in line with the RSI positive divergence.
1. We have identified the following levels as possible long targets.
2. A retouch of 104.00 being the 161.80 Fibonacci Expansion target.
3. The 105.00 level being the 200 percent Fibonacci Expansion target.
4. Around 108.00 being long term trend line resistance.
5. 110.00 being a prior Swing High Pivot.
Scenario 2
Alternatively USDJPY could continue its retracement potentially to trend line support and then the prior pivot swing low. . However from a technical stand point a prior swing low breach would be required to confirm a change of trend.


Daily Technical Analysis for USDCHF as at 6th June 2013
DAILY OVERVIEW
Trend : Long
Ambush Zone : 0.9550 – 0.9370
Target 1 : 0.9840
Target 2 : 0.9970
Stop : 0.9245


Image


Comments
USDCHF is this morning trading unchanged from the open lower after yesterdays down day. Today’s opening range is 38 pips which equates to 31% of the daily average true range.

In terms of the bigger picture the swing bias remains positive.

The following factors are confirming or reinforcing this market bias:
1. The averages are confirming the market direction.
2. The price action is trading beneath both positively layered averages which can be viewed as oversold.
3. RSI continues to diverge positively.
4. The price action has retraced deep into Fibonacci support.
5. The price action has managed to break below the downward sloping trend line which could be viewed as over sold.
Alternative counter trend bullish factors:
1. The price action has broken and closed below both averages.
2. The moving averages are attempting to cross negatively.
3. The price action has broken beneath the downward sloping trend line which could be viewed as a warning of pending trend reversal to the downside.
Scenario 1
As the dominant daily trend is up the deep retracement into the averages and possible further move into Fibonacci support could be interpreted as oversold and might offer buying opportunities. Now that a loss of momentum has been identified in that the weekly RSI is diverging positively does give the long side some extra weight. The initial target for any down break would be the 22nd May prior swing high.

Scenario 2
Alternatively the price action could possibly continue its correction down further into Fibonacci support and then the downward sloping trend line.However from a technical stand point a prior swing low breach would be required to confirm a change of trend.


Daily Technical Analysis for Gold as at 6th June 2013
DAILY OVERVIEW
Trend : Short
Ambush Zone : 1452.60 – 1525.85
Target 1 : 1321.75
Target 2 : 1308.08
Stop : 1590.20

Image


Comments
Gold is this morning trading lower from the open after yesterdays marginal up day with the price action over the last few sessions forming a small converging triangle. Today’s opening range is 64 pips which equates to 21% of the daily average true range

In terms of the bigger picture the swing bias remains negative.

The following factors are confirming or reinforcing this market bias:
1. The averages are confirming the market direction.
2. The price action is trading between both negatively layered averages which can be viewed as a possible shorting area.
3. RSI continues to diverge negatively.
4. The price action is approaching Fibonacci resistance.
Alternative counter trend bullish factors:
1. The moving averages are both rising and converging and converging which could be a sign of a potential positive cross over.
2. If one was to move to the higher time frame Weekly chart it is easier to see that the price action is in the process of forming a higher low.
3. There is still some distance between the current price and Fibonacci resistance which gives the price
action some space to pull back further.
Scenario 1
As the dominant daily trend is down the retracement into the averages might possibly offer shorting opportunities at resistance. The initial target for any down break would be the 20th May prior low.

Scenario 2
Alternatively as Gold has closed above the 8 period moving averages the potential for a move to Fibonacci resistance comes into play. However from a technical stand point a prior swing high breach would be required to confirm a change of trend.


Daily Technical Analysis for Oil (WTI) as at 6th June 2013
DAILY OVERVIEW
Trend : Short
Ambush Zone : -
Target 1 : -
Target 2 : -
Stop : -

Image


Comments
Oil is this morning trading higher from the open after yesterdays down day. Today’s opening range is 66 pips which equates to 37% of the daily average true range.

The price action continues to trade near the top of a large monthly converging triangle. However following the breach of the prior pivot low the swing bias has changed from positive to negative.

In terms of the bigger picture the swing bias remains negative.

The following factors are confirming or reinforcing this market bias:
1. The averages are confirming the market direction.
2. The price action is trading within negatively layered averages which can be viewed as possible shorting area.
Alternative counter trend bullish factors:
1. The price action has broken above the upward sloping trend line which could be viewed as a warning of pending trend reversion to the upside.
2. From a bullish perspective the price action has retraced and bounced off Fibonacci support.
3. No sign yet of a negative divergence in the weekly RSI.
Scenario 1
As the dominant daily trend has changed to negative we are monitoring the possibility of continued move down with corrective pullbacks offering possible selling opportunities.

Scenario 2
Alternatively as the price action has bounced off Fibonacci support we are monitoring the possibility of a resumption of the prior up trend with potential targets the 100 % and 138.2% Fibonacci Expansion level in the areas of 99.00 and 103.00 respectively. However the psychological 100.00 level will need to be broken for any further upside to continue.
Atlas CapitalFx
 
Posts: 678
Joined: Mon Dec 17, 2012 7:53 am

Daily Technical Analysis 07.06.2013 By ACFX.com

Postby Atlas CapitalFx » Fri Jun 07, 2013 4:33 am

Daily Technical Analysis for EURUSD as at 7th June 2013
DAILY OVERVIEW
Trend : Long
Ambush Zone : -
Target 1 : -
Target 2 : -
Stop : -


Image


Comments
EURUSD is this morning trading unchanged from the open after yesterdays strong up day which saw a breach of a prior pivot high. Today’s opening range is 33 pips which equates to 30% of the daily average true range.

In terms of the bigger picture the swing bias has turned positive.

The following factors are confirming or reinforcing this market bias:
1. The price action is trading above both positively layered averages.
2. The price action has managed to break above the downward sloping trend line.
3. The RSI is in gear with the move up.
4. The price action has cleared resistance of 1.3250.
5. Both the daily and weekly time frames as positive and in gear.
6. A Head and Shoulders pattern failure on the Weekly time frame.
Alternative counter trend bearish factors:
1. The price action is extended from the averages and therefore has space to correct.
2. The price action if it continues on its upward path will intersect with a prior broken upward sloping trend line.
3. The price action is moving into broad Fibonacci resistance.
Scenario 1
As the dominant daily trend is up retracements into support could be viewed as buying opportunities

Scenario 2
Alternatively as EURUSD is now extended from the averages a corrective move down to the 8 period moving averages is a possibility.


Daily Technical Analysis for GBPUSD as at 7th June 2013
DAILY OVERVIEW
Trend : Long
Ambush Zone : -
Target 1 : -
Target 2 : -
Stop : -


Image


Comments
GBPUSD is this morning trading marginally higher from the open after yesterdays strong up day which saw a breach of a prior pivot high and a positive moving average cross over. Today’s opening range is 37 pips which equates to a 29% of the daily average true range.

In terms of the bigger picture he swing bias has turned positive.

The following factors are confirming or reinforcing this market bias:
1. The price action is trading above both positively layered averages.
2. The price action has managed to break above the downward sloping trend line.
3. The price action has breached and closed above a prior broken upward sloping trend line.
4. The RSI is in gear with the move up.
5. The price action has cleared resistance of 1.5600
6. Both the daily and weekly time frames as positive and in gear.
Alternative counter trend bearish factors:
1. The price action is extended from the averages and therefore has space to correct.
2. The price action is moving into broad Fibonacci resistance.
Scenario 1
As the dominant daily trend is up retracements into support could be viewed as buying opportunities

Scenario 2
Alternatively as GBPUSD is now extended from the averages a corrective move down to the 8 period moving averages is a possibility.


Daily Technical Analysis for USDJPY as at 7th June 2013
DAILY OVERVIEW
Trend : Short
Ambush Zone : -
Target 1 : -
Target 2 : -
Stop : -

Image


Comments
USDJPY is this morning trading lower from the open after yesterdays strong down day which saw a breach of a prior pivot low and the averages cross negatively. Today’s opening range is 196 pips which equates to 118% of the daily average true range.

In terms of the bigger picture the swing bias has turned negative.

The following factors are confirming or reinforcing this market bias:
1. The price action is trading below both negatively layered averages.
2. The price action has managed to break below the upward sloping trend line.
3. The RSI is in gear with the move up.
4. The price action has cleared support of 95.80.
Alternative counter trend bullish factors:
1. The price action is extended from the averages and therefore has space to correct.
Scenario 1
As the dominant daily trend is down retracements into resistance could be viewed as selling opportunities

Scenario 2
Alternatively USDJPY is extended form the averages a retracement to the 8 period moving averages is a possibility.


Daily Technical Analysis for USDCHF as at 7th June 2013
DAILY OVERVIEW
Trend : Short
Ambush Zone : -
Target 1 : -
Target 2 : -
Stop : -

Image


Comments
USDCHF is this morning trading unchanged from the open lower after yesterdays strong down day which saw a breach of a prior pivot low and the averages cross negatively. Today’s opening range is 52 pips which equates to 39% of the daily average true range.

In terms of the bigger picture the swing bias has turned negative.

The following factors are confirming or reinforcing this market bias:
1. The price action is trading below both negatively layered averages.
2. The price action has managed to breach but not closed beneath the prior broken downward sloping trend line.
3. The RSI is in gear with the move up.
4. The price action has breached but not closed beneath support of 0.9250
Alternative counter trend bullish factors:
1. The price action is extended from the averages and therefore has space to correct.
2. That price action was repelled by the prior broken downward sloping trend line could be a sign of resistance to the down side direction.
3. That price action was repelled by the 0.9250 support could be a sign of resistance to the down side direction.
Scenario 1
As the dominant daily trend is down retracements into resistance could be viewed as selling opportunities

Scenario 2
Alternatively USDCHF is extended form the averages a retracement to the 8 period moving averages is a possibility.


Daily Technical Analysis for Gold as at 7th June 2013
DAILY OVERVIEW
Trend : Short
Ambush Zone : 1452.60 – 1525.85
Target 1 : 1321.75
Target 2 : 1308.08
Stop : 1590.20


Image

Comments
Gold is this morning trading unchanged from the open after yesterdays marginal up day with the price action over the last few sessions form a larger converging triangle. Today’s opening range is 680 pips which equates to 24% of the daily average true range

In terms of the bigger picture the swing bias remains negative.

The following factors are confirming or reinforcing this market bias:
1. The averages are confirming the market direction.
2. The price action is trading between both negatively layered averages which can be viewed as a possible shorting area.
3. RSI continues to diverge negatively.
4. The price action is approaching Fibonacci resistance.
Alternative counter trend bullish factors:
1. The moving averages are both rising and converging and converging which could be a sign of a potential positive cross over.
2. If one was to move to the higher time frame Weekly chart it is easier to see that the price action is in the process of forming a higher low.
3. There is still some distance between the current price and Fibonacci resistance which gives the price
action some space to pull back further.
Scenario 1
As the dominant daily trend is down the retracement into the averages might possibly offer shorting opportunities at resistance. The initial target for any down break would be the 20th May prior low.

Scenario 2
Alternatively as Gold has closed above the 8 period moving averages the potential for a move to Fibonacci resistance comes into play. However from a technical stand point a prior swing high breach would be required to confirm a change of trend.


Daily Technical Analysis for Oil (WTI) as at 7th June 2013
DAILY OVERVIEW
Trend : Short
Ambush Zone : -
Target 1 : -
Target 2 : -
Stop : -


Image

Comments
Oil is this morning trading unchanged from the open after yesterdays strong up day. Today’s opening range is 33 pips which equates to 19% of the daily average true range.

The price action continues to trade near the top of a large monthly converging triangle. However following the breach of the prior pivot low the swing bias has changed from positive to negative.

In terms of the bigger picture the swing bias remains negative.

The following factors are confirming or reinforcing this market bias:
1. The averages are confirming the market direction.
2. The price action is trading above negatively layered averages which could be viewed as over bought possible shorting area.
Alternative counter trend bullish factors:
1. The price action has broken above the upward sloping trend line which could be viewed as a warning of pending trend reversion to the upside.
2. From a bullish perspective the price action has retraced and bounced off Fibonacci support.
3. No sign yet of a negative divergence in the weekly RSI.
Scenario 1
As the dominant daily trend has changed to negative we are monitoring the possibility of continued move down with corrective pullbacks offering possible selling opportunities.

Scenario 2
Alternatively as the price action has bounced off Fibonacci support we are monitoring the possibility of a resumption of the prior up trend with potential targets the 100 % and 138.2% Fibonacci Expansion level in the areas of 99.00 and 103.00 respectively. However the psychological 100.00 level will need to be broken for any further upside to continue.
Atlas CapitalFx
 
Posts: 678
Joined: Mon Dec 17, 2012 7:53 am

Daily Technical Analysis 11.5.2013 By ACFX.com

Postby Atlas CapitalFx » Tue Jun 11, 2013 4:21 am

Daily Technical Analysis for EURUSD as at 11th June 2013
DAILY OVERVIEW
Trend : Long
Ambush Zone : -
Target 1 : -
Target 2 : -
Stop : -


Image


Comments
EURUSD is this morning trading higher from the open after yesterdays up day. Today’s opening range is 45 pips which equates to 43% of the daily average true range.

The pullback from Fibonacci resistance was temporary as the prices action yesterday printed a bullish piercing line candle. As the distance to the 1.3300 level is well within the average daily range a move to this area is a possibility. A move however beneath yesterdays low will open up the possibility of a further pullback to the 8 period moving averages.

In terms of the bigger picture the swing bias is positive.

The following factors are confirming or reinforcing this market bias:
1. The price action is trading above both positively layered averages.
2. The price action has managed to break above the downward sloping trend line.
3. The RSI is in gear with the move up.
4. The price action has cleared resistance of 1.3250.
5. Both the daily and weekly time frames as positive and in gear.
6. A Head and Shoulders pattern failure on the Weekly time frame.
Alternative counter trend bearish factors:
1. The price action is extended from the averages and therefore has space to correct.
2. The price action if it continues on its upward path will intersect with a prior broken upward sloping trend line.
3. The price action is trading within Fibonacci resistance.
Scenario 1
As the dominant daily trend is up retracements into support could be viewed as buying opportunities

Scenario 2
Alternatively as EURUSD is now extended from the averages a corrective move down to the 8 period moving averages is a possibility.


Daily Technical Analysis for GBPUSD as at 11th June 2013
DAILY OVERVIEW
Trend : Long
Ambush Zone : -
Target 1 : -
Target 2 : -
Stop : -

Image


Comments
GBPUSD is this morning trading higher from the open after yesterdays up day. Today’s opening range is 46 pips which equates to a 38% of the daily average true range.

The pullback from Fibonacci resistance has not followed through GBPUSD once again rising to the upward trend line and the Fibonacci resistance. A continuation of the up move to the high of 6th of June is a possibility however a potential correction to the 8 period moving averages cannot be discounted. That the RSI has shown signs of negative divergence does highlight downside risk.

In terms of the bigger the swing bias remains positive.

The following factors are confirming or reinforcing this market bias:
1. The price action is trading above both positively layered averages.
2. The price action has managed to break above the downward sloping trend line.
3. The price action has cleared resistance of 1.5600
4. Both the daily and weekly time frames as positive and in gear.
Alternative counter trend bearish factors:
1. The price action is extended from the averages and therefore has space to correct.
2. The up move has not cleared Fibonacci resistance.
3. The up move has not cleared trend line resistance.
4. The RSI is diverging negatively.
Scenario 1
As the dominant daily trend is up retracements into support could be viewed as buying opportunities

Scenario 2
Alternatively as GBPUSD is now extended from the averages a corrective move down to the 8 period moving averages is a possibility.


Daily Technical Analysis for USDJPY as at 11th June 201310
DAILY OVERVIEW
Trend : Short
Ambush Zone : -
Target 1 : -
Target 2 : -
Stop : -


Image


Comments
USDJPY is this morning trading lower from the open after yesterdays up day. Today’s opening range is 126 pips which equates to 71% of the daily average true range.

Yesterdays up move off the back off Fridays Hammer candle found resistance at the upward sloping trend line and the 8 period moving averages.

In terms of the bigger picture the swing bias is negative.

The following factors are confirming or reinforcing this market bias:
1. The price action is trading below both negatively layered averages.
2. The price action has managed to break below the upward sloping trend line.
3. The RSI is in gear with the move up.
4. The price action has tested support of 95.80.
Alternative counter trend bullish factors:
1. Fridays hammer candle could potentially drive USDJPY higher.
Scenario 1
As the dominant daily trend is down retracements into resistance could be viewed as selling opportunities

Scenario 2
Alternatively USDJPY is extended form the averages a retracement to the 8 period moving averages is a possibility.


Daily Technical Analysis for USDCHF as at 11th June 2013
DAILY OVERVIEW
Trend : Short
Ambush Zone : -
Target 1 : -
Target 2 : -
Stop : -


Image

Comments
USDCHF is this morning trading lower from the open after yesterdays strong down day. Today’s opening range is 44 pips which equates to 34% of the daily average true range.

Yesterday USDCHF traded up to the 8 period moving averages where it found strong resistance.

In terms of the bigger picture the swing bias is negative.

The following factors are confirming or reinforcing this market bias:
1. The price action is trading below both negatively layered averages.
2. The price action has managed to breach but not closed beneath the prior broken downward sloping trend line.
3. The RSI is in gear with the move up.
4. The price action has breached but not closed beneath support of 0.9250
Alternative counter trend bullish factors:
1. The price action is extended from the averages and therefore has space to correct.
2. That price action was repelled by the prior broken downward sloping trend line could be a sign of resistance to the down side direction.
3. That price action was repelled by the 0.9250 support could be a sign of resistance to the down side direction.
Scenario 1
As the dominant daily trend is down retracements into resistance could be viewed as selling opportunities

Scenario 2
Alternatively USDCHF is extended form the averages a retracement to the 8 period moving averages is a possibility.


Daily Technical Analysis for Gold as at 11th June 2013
DAILY OVERVIEW
Trend : Short
Ambush Zone : 1452.60 – 1525.85
Target 1 : 1321.75
Target 2 : 1308.08
Stop : 1590.20


Image


Comments
Gold is this morning trading lower from the open after yesterdays up day. Today’s opening range is 59 pips which equates to 24% of the daily average true range

After Fridays strong down day the past two days price action has been muted. A breach of the 20th May low will reconfirm the down trend.

In terms of the bigger picture the swing bias remains negative.

The following factors are confirming or reinforcing this market bias:
1. The averages are confirming the market direction.
2. The price action has broken down from both negatively layered averages.
Alternative counter trend bullish factors:
1. If one was to move to the higher time frame Weekly chart it is easier to see that the price action is in the process of forming a higher low.
2. There is still some distance between the current price and Fibonacci resistance which gives the price
action some space to pull back further.
Scenario 1
As the dominant daily trend is down the retracement into the averages might possibly offer shorting opportunities at resistance. The initial target for any down break would be the 20th May prior low.

Scenario 2
Alternatively as long Gold can trade above the 20th May high there is a possibility of a higher low swing being printed. However from a technical stand point a prior swing high breach would be required to confirm a change of trend.


Daily Technical Analysis for Oil (WTI) as at 11th June 2013
DAILY OVERVIEW
Trend : Short
Ambush Zone : -
Target 1 : -
Target 2 : -
Stop : -

Image


Comments
Oil is this morning trading unchanged from the open after yesterdays down day. Today’s opening range is 27 pips which equates to 15% of the daily average true range.

The price action continues to trade above the top of a large monthly converging triangle. However the upward momentum seems to have decreased. The triangle break could possibly be a warning that the switch to a short bias maybe temporarily. This resumption to a long swing bias requires a breach of a prior swing high.

In terms of the bigger picture the swing bias remains negative.

The following factors are confirming or reinforcing this market bias:
1. The averages are confirming the market direction but are however moving in an upward direction.
2. The price action is trading above negatively layered averages which could be viewed as over bought possible shorting area.
Alternative counter trend bullish factors:
1. The price action has broken above of the top of the large monthly converging triangle.
2. From a bullish perspective the price action has retraced and bounced off Fibonacci support.
3. No sign yet of a negative divergence in the weekly RSI.
4. An inverse Head and Shoulders pattern is forming on the weekly and daily time frames.
Scenario 1
As the dominant daily trend has changed to negative we are monitoring the possibility of continued move down with corrective pullbacks offering possible selling opportunities.

Scenario 2
Alternatively as the price action has bounced off Fibonacci support we are monitoring the possibility of a resumption of the prior up trend with potential targets the 100 % and 138.2% Fibonacci Expansion level in the areas of 99.00 and 103.00 respectively. However the psychological 100.00 level will need to be broken for any further upside to continue.
Atlas CapitalFx
 
Posts: 678
Joined: Mon Dec 17, 2012 7:53 am

Daily Technical Analysis 12.5.2013 By ACFX.com

Postby Atlas CapitalFx » Wed Jun 12, 2013 4:24 am

Daily Technical Analysis for EURUSD as at 12th June 2013
DAILY OVERVIEW
Trend : Long
Ambush Zone : -
Target 1 : -
Target 2 : -
Stop : -

Image


Comments
EURUSD is this morning trading lower from the open after yesterdays up day. Today’s opening range is 20 pips which equates to 20% of the daily average true range.

Yesterday EURUSD traded higher and breached the 1.3300 level following Monday’s bullish piercing line candle. We are monitoring a move to the 1.3400 level being the next resistance level to the upside. However as the current pricing is extended from the averages there is a possibility of a corrective retracement to the 8 period moving averages.

In terms of the bigger picture the swing bias is positive.

The following factors are confirming or reinforcing this market bias:
1. The price action is trading above both positively layered averages.
2. The price action has managed to break above the downward sloping trend line.
3. The RSI is in gear with the move up.
4. The price action has breached (but not currently trading above) the 1.3300 level.
5. Both the daily and weekly time frames as positive and in gear.
6. A Head and Shoulders pattern failure on the Weekly time frame.
Alternative counter trend bearish factors:
1. The price action is extended from the averages and therefore has space to correct.
2. The price action if it continues on its upward path will intersect with a prior broken upward sloping trend line.
3. The price action is trading within Fibonacci resistance.
Scenario 1
As the dominant daily trend is up retracements into support could be viewed as buying opportunities

Scenario 2
Alternatively as EURUSD is now extended from the averages a corrective move down to the 8 period moving averages is a possibility.


Daily Technical Analysis for GBPUSD as at 12th June 2013
DAILY OVERVIEW
Trend : Long
Ambush Zone : -
Target 1 : -
Target 2 : -
Stop : -


Image


Comments
GBPUSD is this morning trading slightly lower from the open after yesterdays up day. Today’s opening range is 18 pips which equates to a 15% of the daily average true range.

Yesterday GBPUSD traded higher and breached and closed above the rising to the upward trend line. A continuation of the up move to the high of 6th of June is a possibility however a potential correction to the 8 period moving averages cannot be discounted. That the RSI has shown signs of negative divergence does highlight downside risk.

In terms of the bigger the swing bias remains positive.

The following factors are confirming or reinforcing this market bias:
1. The price action is trading above both positively layered averages.
2. The price action has managed to break and close above the downward sloping trend line.
3. The price action has cleared resistance of 1.5600
4. Both the daily and weekly time frames as positive and in gear.
Alternative counter trend bearish factors:
1. The price action is extended from the averages and therefore has space to correct.
2. The up move has not cleared Fibonacci resistance.
3. The up move has not cleared trend line resistance.
4. The RSI is diverging negatively.
Scenario 1
As the dominant daily trend is up retracements into support could be viewed as buying opportunities

Scenario 2
Alternatively as GBPUSD is now extended from the averages a corrective move down to the 8 period moving averages is a possibility.


Daily Technical Analysis for USDJPY as at 12th June 201310
DAILY OVERVIEW
Trend : Short
Ambush Zone : -
Target 1 : -
Target 2 : -
Stop : -

Image


Comments
USDJPY is this morning trading higher from the open after yesterdays strong down day. Today’s opening range is 98 pips which equates to 54% of the daily average true range.

Yesterday USDJPY continued to trade lower following a bounce off the 8 period moving averages and trend line resistance. A breach of the 7th June low which was part of a bullish hammer candle will reinforce the downward momentum. However we continue to monitor pullbacks to the 8 period moving averages as selling opportunities.

In terms of the bigger picture the swing bias is negative.

The following factors are confirming or reinforcing this market bias:
1. The price action is trading below both negatively layered averages.
2. The price action has managed to break below the upward sloping trend line.
3. The RSI is in gear with the move up.
4. The price action has tested (but not closed beneath) support of 95.80.
Alternative counter trend bullish factors:
1. Fridays hammer candle could potentially stall any further downside momentum.
Scenario 1
As the dominant daily trend is down retracements into resistance could be viewed as selling opportunities

Scenario 2
Alternatively USDJPY is extended form the averages a retracement to the 8 period moving averages is a possibility.


Daily Technical Analysis for USDCHF as at 12th June 2013
DAILY OVERVIEW
Trend : Short
Ambush Zone : -
Target 1 : -
Target 2 : -
Stop : -


Image


Comments
USDCHF is this morning trading higher from the open after yesterdays strong down day. Today’s opening range is 25 pips which equates to 20% of the daily average true range.

Yesterday USDCHF continued to trade lower following a bounce off the 8 period moving averages. We are monitoring a potential test of the 0.9200 level. However the price action is extended from the averages and there continues to be a possibility of pullbacks to the 8 period moving averages.

In terms of the bigger picture the swing bias is negative.

The following factors are confirming or reinforcing this market bias:
1. The price action is trading below both negatively layered averages.
2. The price action has managed to breach but not closed beneath the prior broken downward sloping trend line.
3. The RSI is in gear with the move up.
4. The price action has breached but not closed beneath support of 0.9250
Alternative counter trend bullish factors:
1. The price action is extended from the averages and therefore has space to correct.
2. That price action has not cleared the prior broken downward sloping trend line could be a sign of resistance to the down side direction.
3. That price action has not breached the 0.9200 level.
Scenario 1
As the dominant daily trend is down retracements into resistance could be viewed as selling opportunities

Scenario 2
Alternatively USDCHF is extended form the averages a retracement to the 8 period moving averages is a possibility.


Daily Technical Analysis for Gold as at 12th June 2013
DAILY OVERVIEW
Trend : Short
Ambush Zone : 1452.60 – 1525.85
Target 1 : 1321.75
Target 2 : 1308.08
Stop : 1590.20

Image


Comments
Gold is this morning trading lower from the open after yesterdays down day. Today’s opening range is 136 pips which equates to 59% of the daily average true range

Yesterday’s price action printed a bullish candle. Breaches beneath the low of this candle will reinforce the down trend.

In terms of the bigger picture the swing bias remains negative.

The following factors are confirming or reinforcing this market bias:
1. The averages are confirming the market direction.
2. The price action has broken down from both negatively layered averages.
Alternative counter trend bullish factors:
1. If one was to move to the higher time frame Weekly chart it is easier to see that the price action is in the process of forming a higher low.
2. There is still some distance between the current price and Fibonacci resistance which gives the price
action some space to pull back further.
Scenario 1
As the dominant daily trend is down the retracement into the averages might possibly offer shorting opportunities at resistance. The initial target for any down break would be the 20th May prior low.

Scenario 2
Alternatively as long Gold can trade above the 20th May high there is a possibility of a higher low swing being printed. However from a technical stand point a prior swing high breach would be required to confirm a change of trend.

Image

Daily Technical Analysis for Oil (WTI) as at 12th June 2013
DAILY OVERVIEW
Trend : Short
Ambush Zone : -
Target 1 : -
Target 2 : -
Stop : -


Comments
Oil is this morning trading lower from the open after yesterdays down day. Today’s opening range is 51 pips which equates to 29% of the daily average true range.

The price action continues trade at the top of a large monthly converging triangle. Oil for the past 3 sessions is contained by the bullish candle of the 7th June and the averages are attempting to cross positively. A break above or below this candle will possibly give a good indication of the medium term momentum.

In terms of the bigger picture the swing bias remains negative.

The following factors are confirming or reinforcing this market bias:
1. The large monthly converging triangle continues to offer Oil strong upside resistance.
Alternative counter trend bullish factors:
1. From a bullish perspective the price action has retraced and bounced off Fibonacci support.
2. No sign yet of a negative divergence in the weekly RSI.
3. An inverse Head and Shoulders pattern is forming on the weekly and daily time frames.
Scenario 1
As the dominant daily trend has changed to negative we are monitoring the possibility of continued move down with corrective pullbacks offering possible selling opportunities.

Scenario 2
Alternatively as the price action has bounced off Fibonacci support we are monitoring the possibility of a resumption of the prior up trend with potential targets the 100 % and 138.2% Fibonacci Expansion level in the areas of 99.00 and 103.00 respectively. However the psychological 100.00 level will need to be broken for any further upside to continue.
Atlas CapitalFx
 
Posts: 678
Joined: Mon Dec 17, 2012 7:53 am

Daily Technical Analysis 13.5.2013 By ACFX.com

Postby Atlas CapitalFx » Thu Jun 13, 2013 3:41 am

Daily Technical Analysis for EURUSD as at 13th June 2013
DAILY OVERVIEW
Trend : Long
Ambush Zone : -
Target 1 : -
Target 2 : -
Stop : -

Image


Comments
EURUSD is this morning trading higher from the open after yesterdays up day. Today’s opening range is 40 pips which equates to 39% of the daily average true range.

The move above the 1.3300 level has continued following Monday’s bullish piercing line candle. We continue to monitor a possible move to the 1.3400 level being the next resistance level to the upside. However as the current pricing is extended from the averages there is a possibility of a corrective retracement to the 8 period moving averages.

In terms of the bigger picture the swing bias is positive.

The following factors are confirming or reinforcing this market bias:
1. The price action is trading above both positively layered averages.
2. The price action has managed to break above the downward sloping trend line.
3. The RSI is in gear with the move up.
4. The price action has breached and closed above the 1.3300 level.
5. Both the daily and weekly time frames as positive and in gear.
6. A Head and Shoulders pattern failure on the Weekly time frame.
Alternative counter trend bearish factors:
1. The price action is extended from the averages and therefore has space to correct.
2. The price action if it continues on its upward path will intersect with a prior broken upward sloping trend line.
3. The price action is trading within Fibonacci resistance.
Scenario 1
As the dominant daily trend is up retracements into support could be viewed as buying opportunities

Scenario 2
Alternatively as EURUSD is now extended from the averages a corrective move down to the 8 period moving averages is a possibility.


Daily Technical Analysis for GBPUSD as at 13th June 2013
DAILY OVERVIEW
Trend : Long
Ambush Zone : -
Target 1 : -
Target 2 : -
Stop : -

Image


Comments
GBPUSD is this morning trading unchanged from the open after yesterdays up day. Today’s opening range is 32 pips which equates to a 27% of the daily average true range.

Yesterday GBPUSD continued to trade higher following the breach and close above the rising the upward trend line with the resulting move taking out the high of 6th of June. The next resistance level is at 1.5850.

As the price action is extended from the averages the possibility however for a potential correction to the 8 period moving averages cannot be discounted. However the negative divergence that was setting up in the RSI has now been discounted with this oscillator now in gear with the move.

In terms of the bigger the swing bias remains positive.

The following factors are confirming or reinforcing this market bias:
1. The price action is trading above both positively layered averages.
2. The price action has managed to break and close above the upward sloping trend line.
3. The price action has cleared resistance of 1.5600
4. Both the daily and weekly time frames are positive and in gear.
5. The RSI is in gear with the move.
Alternative counter trend bearish factors:
1. The price action is extended from the averages and therefore has space to correct.
2. The up move has not cleared Fibonacci resistance.
Scenario 1
As the dominant daily trend is up retracements into support could be viewed as buying opportunities

Scenario 2
Alternatively as GBPUSD is now extended from the averages a corrective move down to the 8 period moving averages is a possibility.


Daily Technical Analysis for USDJPY as at 13th June 201310
DAILY OVERVIEW
Trend : Short
Ambush Zone : -
Target 1 : -
Target 2 : -
Stop : -

Image


Comments
USDJPY is this morning trading lower from the open after yesterdays slight down day. Today’s opening range is 178 pips which equates to 96% of the daily average true range.

Yesterday USDJPY closed slightly lower on what was an indifferent trading session only for this morning to open aggressively negative and trade most of its expected daily range prior to the London open. This morning’s move has in the process breached the 7th June low which was part of a bullish hammer candle.

Although the market is very bearish that the price action is extended from the averages is extended from the averages leaves open the possibility for corrective up moves.

In terms of the bigger picture the swing bias is negative.

The following factors are confirming or reinforcing this market bias:
1. The price action is trading below both negatively layered averages.
2. The price action has managed to break below the upward sloping trend line.
3. The RSI is in gear with the move up.
4. The price action is trading beneath the 95.80 support level.
Alternative counter trend bullish factors:
1. USDJPY is at an extreme and may need to pull back to its average prior to resuming its downward course.
Scenario 1
As the dominant daily trend is down retracements into resistance could be viewed as selling opportunities

Scenario 2
Alternatively USDJPY is extended form the averages a retracement to the 8 period moving averages is a possibility.


Daily Technical Analysis for USDCHF as at 13th June 2013
DAILY OVERVIEW
Trend : Short
Ambush Zone : -
Target 1 : -
Target 2 : -
Stop : -

Image

Comments
USDCHF is this morning trading lower from the open after yesterdays down day. Today’s opening range is 45 pips which equates to 36% of the daily average true range.

Yesterday USDCHF continued to trade lower following a bounce off the 8 period moving averages and this move has continued this morning with a result that the 0.9200 has been tested and breached level.

However the price action is extended from the averages and there continues to be a possibility of pullbacks to the 8 period moving averages.

In terms of the bigger picture the swing bias is negative.

The following factors are confirming or reinforcing this market bias:
1. The price action is trading below both negatively layered averages.
2. The RSI is in gear with the move.
3. The price action has breached support of 0.9250
Alternative counter trend bullish factors:
1. The price action is extended from the averages and therefore has space to correct.
Scenario 1
As the dominant daily trend is down retracements into resistance could be viewed as selling opportunities

Scenario 2
Alternatively USDCHF is extended form the averages a retracement to the 8 period moving averages is a possibility.


Daily Technical Analysis for Gold as at 13th June 2013
DAILY OVERVIEW
Trend : Short
Ambush Zone : 1452.60 – 1525.85
Target 1 : 1321.75
Target 2 : 1308.08
Stop : 1590.20


Image


Comments
Gold is this morning trading unchanged from the open after yesterdays up day. Today’s opening range is 104 pips which equates to 44% of the daily average true range

The bullish hammer candle has had the effect of pushing Gold back into the averages and in the process these averages have turned positive. A breach of the 11th June low will reinforce the down trend where as a breach of the 6th June high will reverse the trend to positive.

In terms of the bigger picture the swing bias remains negative.

The following factors are confirming or reinforcing this market bias:
1. The moving averages continue offer resistance to Gold.
2. The RSI is in gear with the price action.
Alternative counter trend bullish factors:
1. If one was to move to the higher time frame Weekly chart it is easier to see that the price action is in the process of forming a higher low.
2. There is still some distance between the current price and Fibonacci resistance which gives the price action some space to pull back further.
3. The averages have turned positive.
Scenario 1
As the dominant daily trend is down the retracement into the averages might possibly offer shorting opportunities at resistance. The initial target for any down break would be the 20th May prior low.

Scenario 2
Alternatively as long Gold can trade above the 20th May high there is a possibility of a higher swing being printed.


Daily Technical Analysis for Oil (WTI) as at 13th June 2013
DAILY OVERVIEW
Trend : Short
Ambush Zone : -
Target 1 : -
Target 2 : -
Stop : -


Image

Comments
Oil is this morning trading lower from the open after yesterdays up day. Today’s opening range is 60 pips which equates to 33% of the daily average true range.

The price action continues trade at the top of a large monthly converging triangle. Oil for the past 4 sessions is contained by the bullish candle of the 7th June and the averages are cross positively. A break above or below this candle will possibly give a good indication of the medium term momentum.

In terms of the bigger picture the swing bias remains negative.

The following factors are confirming or reinforcing this market bias:
1. The large monthly converging triangle continues to offer Oil strong upside resistance.
Alternative counter trend bullish factors:
1. From a bullish perspective the price action has retraced and bounced off Fibonacci support.
2. No sign yet of a negative divergence in the weekly RSI.
3. An inverse Head and Shoulders pattern is forming on the weekly and daily time frames.
4. The price action is trading just above the large monthly converging triangle.
5. The averages are positively crossed.
Scenario 1
As the dominant daily trend has changed to negative we are monitoring the possibility of continued move down with corrective pullbacks offering possible selling opportunities.

Scenario 2
Alternatively as the price action has bounced off Fibonacci support we are monitoring the possibility of a resumption of the prior up trend with potential targets the 100 % and 138.2% Fibonacci Expansion level in the areas of 99.00 and 103.00 respectively. However the psychological 100.00 level will need to be broken for any further upside to continue.
Atlas CapitalFx
 
Posts: 678
Joined: Mon Dec 17, 2012 7:53 am

Daily Technical Analysis 17.06.2013 By ACFX.com

Postby Atlas CapitalFx » Mon Jun 17, 2013 4:31 am

Daily Technical Analysis for USDCHF as at 17th June 2013
DAILY OVERVIEW
Trend : Short
Ambush Zone : -
Target 1 : -
Target 2 : -
Stop : -

Image

Comments
USDCHF is this morning trading higher from the open after Fridays down day. Today’s opening range is 31 pips which equates to 25% of the daily average true range.

Friday’s price action initially traded higher following Thursday’s bullish candle. This upward momentum traded towards the 8 period moving averages where It found resistance which pushed USDCHF lower. This led to a negative close.

In terms of the bigger picture the swing bias is negative.

The following factors are confirming or reinforcing this market bias:
1. The price action is trading below both negatively layered averages.
2. The RSI is in gear with the move.
3. The price action has breached support of 0.9250
Alternative counter trend bullish factors:
1. The price action is extended from the averages and therefore has space to correct.
2. USDCHF is this morning trading above the 0.9250 support level.
Scenario 1
As the dominant daily trend is down retracements into resistance could be viewed as selling opportunities

Scenario 2
Alternatively USDCHF is extended form the averages a retracement to the 8 period moving averages is a possibility.


Daily Technical Analysis for Gold as at 17th June 2013
DAILY OVERVIEW
Trend : Short
Ambush Zone : 1452.60 – 1525.85
Target 1 : 1321.75
Target 2 : 1308.08
Stop : 1590.20

Image


Comments
Gold is this morning trading lower from the open after Fridays up day. Today’s opening range is 56 pips which equates to 24% of the daily average true range

The price action continues to edge towards the averages. A breach of the 11th June low will reinforce the down trend where as a breach of the 6th June high will reverse the trend to positive.

In terms of the bigger picture the swing bias remains negative.

The following factors are confirming or reinforcing this market bias:
1. The moving averages continue offer resistance to Gold.
2. The RSI is in gear with the price action.
Alternative counter trend bullish factors:
1. If one was to move to the higher time frame Weekly chart it is easier to see that the price action is in the process of forming a higher low.
2. There is still some distance between the current price and Fibonacci resistance which gives the price action some space to pull back further.
3. The averages have turned positive.
Scenario 1
As the dominant daily trend is down the retracement into the averages might possibly offer shorting opportunities at resistance. The initial target for any down break would be the 20th May prior low.

Scenario 2
Alternatively as long Gold can trade above the 20th May high there is a possibility of a higher swing being printed.


Daily Technical Analysis for Oil (WTI) as at 17th June 2013
DAILY OVERVIEW
Trend : Long
Ambush Zone : -
Target 1 : -
Target 2 : -
Stop : -


Image

Comments
Oil is this morning trading lower from the open after Fridays strong up day. Today’s opening range is 47 pips which equates to 25% of the daily average true range.

Oil has broken above the top of a large monthly converging triangle and in the process printed a Higher High candle that has reversed the short lived negative swing trend indication. Furthermore the inverse Head and Shoulders pattern identified in prior posts has broken to the upside.

In terms of the bigger picture the swing bias remains negative.

The following factors are confirming or reinforcing this market bias:
1. From a bullish perspective the price action has retraced and bounced off Fibonacci support.
2. No sign yet of a negative divergence in the weekly RSI.
3. An inverse Head and Shoulders pattern is breaking to the upside.
4. The price action is trading just above the large monthly converging triangle.
5. The averages are positively crossed.
Alternative counter trend bearish factors:
1. The price action is extended from the averages.
Scenario 1
As the dominant daily trend has changed to positive corrective pullbacks to the averages could offer buying opportunities with potential targets the 100 % and 138.2% Fibonacci Expansion level in the areas of 99.00 and 103.00 respectively. However the psychological 100.00 level will need to be broken for any further upside to continue.

Scenario 2
Alternatively as the price extended from the averages the price action may need to trade down to sideways before the up move continues.
Atlas CapitalFx
 
Posts: 678
Joined: Mon Dec 17, 2012 7:53 am

Daily Technical Analysis 18.6.2013 By ACFX.com

Postby Atlas CapitalFx » Tue Jun 18, 2013 3:39 am

Daily Technical Analysis for EURUSD as at 18th June 2013
DAILY OVERVIEW
Trend : Long
Ambush Zone : -
Target 1 : -
Target 2 : -
Stop : -


Image

Comments
EURUSD is this morning trading lower from the open after yesterdays up day. Today’s opening range is 20 pips which equates to 20% of the daily average true range.

EURUSD is consolidating at the highs as it approaches the 8 period moving averages.

In terms of the bigger picture the swing bias is positive.

The following factors are confirming or reinforcing this market bias:
1. The price action is trading above both positively layered averages.
2. The price action has managed to break above the downward sloping trend line.
3. The RSI is in gear with the move up.
4. The price action has breached and closed above the 1.3300 level.
5. Both the daily and weekly time frames as positive and in gear.
6. A Head and Shoulders pattern failure on the Weekly time frame.
Alternative counter trend bearish factors:
1. The price action if it continues on its upward path will intersect with a prior broken upward sloping trend line.
2. The price action is trading within Fibonacci resistance.
Scenario 1
As the dominant daily trend is up retracements into support could be viewed as buying opportunities

Scenario 2
Alternatively as EURUSD is now extended from the averages a corrective move down to the 8 period moving averages is a possibility.


Daily Technical Analysis for GBPUSD as at 18th June 2013
DAILY OVERVIEW
Trend : Long
Ambush Zone : -
Target 1 : -
Target 2 : -
Stop : -

Image


Comments
GBPUSD is this morning trading lower from the open after yesterday’s unchanged day. Today’s opening range is 29 pips which equates to a 25% of the daily average true range.

The price action continues to trade above the 8 period moving averages and the upward sloping trend line. The next resistance level is at 1.5850.

In terms of the bigger the swing bias remains positive.

The following factors are confirming or reinforcing this market bias:
1. The price action is trading above both positively layered averages.
2. The price action has managed to break and close above the upward sloping trend line.
3. The price action has cleared resistance of 1.5600
4. Both the daily and weekly time frames are positive and in gear.
5. The RSI is in gear with the move.
Alternative counter trend bearish factors:
1. The averages themselves have become extended which could be an indication that the price action may need to correct.
2. The up move has not cleared Fibonacci resistance.
Scenario 1
As the dominant daily trend is up retracements into support could be viewed as buying opportunities

Scenario 2
Alternatively as GBPUSD is now extended from the averages a corrective move down to the 8 period moving averages is a possibility.


Daily Technical Analysis for USDJPY as at 18th June 2013
DAILY OVERVIEW
Trend : Short
Ambush Zone : -
Target 1 : -
Target 2 : -
Stop : -


Image


Comments
USDJPY is this morning trading higher from the open after yesterdays up day. Today’s opening range is 52 pips which equates to 28% of the daily average true range.

USDJPY is this morning trading within a 3 day range. This could be a sign that the market is consolidating prior to a continuation of the down move or the price action basing before moving up to the averages.

The next support area is 92.50 being the 2nd April swing low.

In terms of the bigger picture the swing bias is negative.

The following factors are confirming or reinforcing this market bias:
1. The price action is trading below both negatively layered averages.
2. The price action has managed to break below the upward sloping trend line.
3. The RSI is in gear with the move up.
4. The price action is trading beneath the 95.80 resistance level.
Alternative counter trend bullish factors:
1. USDJPY is at an extreme and may need to pull back to its average prior to resuming its downward course.
Scenario 1
As the dominant daily trend is down retracements into resistance could be viewed as selling opportunities

Scenario 2
Alternatively USDJPY is extended form the averages a retracement to the 8 period moving averages is a possibility.


Daily Technical Analysis for USDCHF as at 18th June 2013
DAILY OVERVIEW
Trend : Short
Ambush Zone : -
Target 1 : -
Target 2 : -
Stop : -


Image

Comments
USDCHF is this morning trading higher from the open after yesterdays up day. Today’s opening range is 17 pips which equates to 15% of the daily average true range.

The price action has rejected the 8 period moving averages but the strength of the bounce was negligible with the price action stubbornly staying close to this average.

In terms of the bigger picture the swing bias is negative.

The following factors are confirming or reinforcing this market bias:
1. The price action is trading below both negatively layered averages.
2. The RSI is in gear with the move.
3. The price action had breached support of 0.9250
Alternative counter trend bullish factors:
1. USDCHF is this morning trading above the 0.9250 support level.
Scenario 1
As the dominant daily trend is down retracements into resistance could be viewed as selling opportunities

Scenario 2
Alternatively if USDCHF could break above the 8 period moving averages there is a possibility of a broader correction in the direction of the 34 period moving averages.


Daily Technical Analysis for Gold as at 18th June 2013
DAILY OVERVIEW
Trend : Short
Ambush Zone : 1452.60 – 1525.85
Target 1 : 1321.75
Target 2 : 1308.08
Stop : 1590.20

Image


Comments
Gold is this morning trading lower from the open after Yesterdays down day. Today’s opening range is 670 pips which equates to 29% of the daily average true range

Gold this morning is breaking down from the averages. A breach of the 11th June low will reinforce the down trend where as a breach of the 6th June high will reverse the trend to positive.

In terms of the bigger picture the swing bias remains negative.

The following factors are confirming or reinforcing this market bias:
1. The moving averages continue offer resistance to Gold.
2. The RSI is in gear with the price action.
3. The averages are layered negatively.
4. The price action has rejected the small average.
Alternative counter trend bullish factors:
1. If one was to move to the higher time frame Weekly chart it is easier to see that the price action is in the process of forming a higher low.
2. There is still some distance between the current price and Fibonacci resistance which gives the price action some space to pull back further.
Scenario 1
As the dominant daily trend is down the retracement into the averages might possibly offer shorting opportunities at resistance. The initial target for any down break would be the 20th May prior low.

Scenario 2
Alternatively as long Gold can trade above the 20th May high there is a possibility of a higher swing being printed.


Daily Technical Analysis for Oil (WTI) as at 18th June 2013
DAILY OVERVIEW
Trend : Long
Ambush Zone : -
Target 1 : -
Target 2 : -
Stop : -

Image


Comments
Oil is this morning trading lower from the open after yesterday’s unchanged day. Today’s opening range is 31 pips which equates to 18% of the daily average true range.

Yesterday’s price action ended unchanged after printing a wide range day that traded close to the 100% Fibonacci extension level. We are focused on the inverse Head and Shoulders pattern that has broken to the upside and a possible breach of the 100 level. However there is a fairly large weekly negative RSI divergence that has been noted as a potential drag against continued upside momentum.

In terms of the bigger picture the swing bias remains negative.

The following factors are confirming or reinforcing this market bias:
1. From a bullish perspective the price action has retraced and bounced off Fibonacci support.
2. An inverse Head and Shoulders pattern has broken to the upside.
3. The price action is trading just above the large monthly converging triangle.
4. The averages are positively crossed.
Alternative counter trend bearish factors:
1. The price action is extended from the averages.
2. A large negative RSI divergence is forming.
Scenario 1
As the dominant daily trend has changed to positive corrective pullbacks to the averages could offer buying opportunities with potential targets the 100 % and 138.2% Fibonacci Expansion level in the areas of 99.00 and 103.00 respectively. However the psychological 100.00 level will need to be broken for any further upside to continue.

Scenario 2
Alternatively as the price extended from the averages the price action may need to trade down to sideways before the up move continues.
Atlas CapitalFx
 
Posts: 678
Joined: Mon Dec 17, 2012 7:53 am

Re: Daily Technical Analysis 19.06.2013 By ACFX.com

Postby Atlas CapitalFx » Wed Jun 19, 2013 3:44 am

Daily Technical Analysis for EURUSD as at 19th June 2013
DAILY OVERVIEW
Trend : Long
Ambush Zone : -
Target 1 : -
Target 2 : -
Stop : -

Image

Comments
EURUSD is this morning trading unchanged from the open after yesterdays up day. Today’s opening range is 17 pips which equates to 18% of the daily average true range.

Yesterday EURUSD bounced off the 8 period moving averages.

In terms of the bigger picture the swing bias is positive.

The following factors are confirming or reinforcing this market bias:
1. The price action is trading above both positively layered averages.
2. The price action has managed to break above the downward sloping trend line.
3. The RSI is in gear with the move up.
4. The price action has breached and closed above the 1.3300 level.
5. Both the daily and weekly time frames as positive and in gear.
6. A Head and Shoulders pattern failure on the Weekly time frame.
Alternative counter trend bearish factors:
1. The price action if it continues on its upward path will intersect with a prior broken upward sloping trend line.
2. The price action is trading within Fibonacci resistance.
Scenario 1
As the dominant daily trend is up retracements into support could be viewed as buying opportunities

Scenario 2
Alternatively as EURUSD is now extended from the averages a corrective move down to the 8 period moving averages is a possibility.


Daily Technical Analysis for GBPUSD as at 19th June 2013
DAILY OVERVIEW
Trend : Long
Ambush Zone : -
Target 1 : -
Target 2 : -
Stop : -


Image


Comments
GBPUSD is this morning trading lower from the open after yesterdays down day. Today’s opening range is 26 pips which equates to a 22% of the daily average true range.

Yesterday GBPUSD broke under the 8 period moving averages only for buyers to come to the market which had the effect of pairing some of the losses and in the process yesterday’s candle printed a bullish hammer. The next resistance level is at 1.5850.

In terms of the bigger the swing bias remains positive.

The following factors are confirming or reinforcing this market bias:
1. The price action is trading around both positively layered averages.
2. The price action had managed to break and close above the upward sloping trend line. We are monitoring the possibility GBPUSD retests the resistance.
3. The price action has cleared resistance of 1.5600
4. Both the daily and weekly time frames are positive and in gear.
5. The RSI is in gear with the move.
Alternative counter trend bearish factors:
1. The averages themselves have become extended which could be an indication that the price action may need to correct.
2. The up move has not cleared Fibonacci resistance.
3. The price action is now trading under the 8 period moving averages.
Scenario 1
As the dominant daily trend is up retracements into support could be viewed as buying opportunities

Scenario 2
Alternatively as GBPUSD has now experienced a good rally a correction to the 34period moving averages is a possibility.


Daily Technical Analysis for USDJPY as at 19th June 2013
DAILY OVERVIEW
Trend : Short
Ambush Zone : -
Target 1 : -
Target 2 : -
Stop : -


Image

Comments
USDJPY is this morning trading unchanged from the open after yesterdays up day. Today’s opening range is 48 pips which equates to 26% of the daily average true range.

USDJPY yesterday broke the 3 day range to the upside and is now trading at the 8 period moving averages. Approaches to resistance areas such as the averages could be an area where shorting opportunities are offered.

The next support area is 92.50 being the 2nd April swing low.

In terms of the bigger picture the swing bias is negative.

The following factors are confirming or reinforcing this market bias:
1. The price action is trading below both negatively layered averages.
2. The price action has managed to break below the upward sloping trend line.
3. The RSI is in gear with the move up.
4. The price action is trading beneath the 95.80 resistance level.
Alternative counter trend bullish factors:
1. USDJPY is at an extreme and may need to pull back to its average prior to resuming its downward course.
Scenario 1
As the dominant daily trend is down retracements into resistance could be viewed as selling opportunities

Scenario 2
Alternatively USDJPY is extended form the averages a retracement to the 8 period moving averages is a possibility.


Daily Technical Analysis for USDCHF as at 19th June 2013
DAILY OVERVIEW
Trend : Short
Ambush Zone : -
Target 1 : -
Target 2 : -
Stop : -

Image

Comments
USDCHF is this morning trading unchanged from the open after yesterdays down day. Today’s opening range is 12 pips which equates to 11% of the daily average true range.

The price action has rejected the 8 period moving averages but is finding some support at the 0.9200 level.

In terms of the bigger picture the swing bias is negative.

The following factors are confirming or reinforcing this market bias:
1. The price action is trading below both negatively layered averages.
2. The RSI is in gear with the move.
Alternative counter trend bullish factors:
1. USDCHF is this morning holding at the 0.9200 level.
Scenario 1
As the dominant daily trend is down retracements into resistance could be viewed as selling opportunities

Scenario 2
Alternatively if USDCHF could break above the 8 period moving averages there is a possibility of a broader correction in the direction of the 34 period moving averages.


Daily Technical Analysis for Gold as at 19th June 2013
DAILY OVERVIEW
Trend : Short
Ambush Zone : 1452.60 – 1525.85
Target 1 : 1321.75
Target 2 : 1308.08
Stop : 1590.20

Image


Comments
Gold is this morning trading unchanged from the open after Yesterdays down day. Today’s opening range is 560 pips which equates to 25% of the daily average true range

Gold this morning is experiencing a quiet open following yesterdays break down from the averages. A breach of the 11th June low will reinforce the down trend where as a breach of the 6th June high will reverse the trend to positive.

In terms of the bigger picture the swing bias remains negative.

The following factors are confirming or reinforcing this market bias:
1. The moving averages continue offer resistance to Gold.
2. The RSI is in gear with the price action.
3. The averages are layered negatively.
4. The price action has rejected the small average.
Alternative counter trend bullish factors:
1. If one was to move to the higher time frame Weekly chart it is easier to see that the price action is in the process of forming a higher low.
2. There is still some distance between the current price and Fibonacci resistance which gives the price action some space to pull back further.
Scenario 1
As the dominant daily trend is down the retracement into the averages might possibly offer shorting opportunities at resistance. The initial target for any down break would be the 20th May prior low.

Scenario 2
Alternatively as long Gold can trade above the 20th May high there is a possibility of a higher swing being printed.


Daily Technical Analysis for Oil (WTI) as at 19th June 2013
DAILY OVERVIEW
Trend : Long
Ambush Zone : -
Target 1 : -
Target 2 : -
Stop : -


Image

Comments
Oil is this morning trading higher from the open after yesterday’s strong up day. Today’s opening range is 42 pips which equates to 25% of the daily average true range.

The inverse Head and Shoulders pattern continues to be validated following yesterdays strong up day and continued upward momentum this morning. We are monitoring a possible breach of the 100% Fibonacci expansion level. However there is a fairly large weekly negative RSI divergence that has been noted as a potential drag against continued upside.

In terms of the bigger picture the swing bias remains negative.

The following factors are confirming or reinforcing this market bias:
1. From a bullish perspective the price action has retraced and bounced off Fibonacci support.
2. An inverse Head and Shoulders pattern has broken to the upside.
3. The price action is trading well above the large monthly converging triangle.
4. The averages are positively crossed.
Alternative counter trend bearish factors:
1. The price action is extended from the averages.
2. A large negative RSI divergence is forming.
Scenario 1
As the dominant daily trend has changed to positive corrective pullbacks to the averages could offer buying opportunities with potential targets the 100 % and 138.2% Fibonacci Expansion level in the areas of 99.00 and 103.00 respectively. However the psychological 100.00 level will need to be broken for any further upside to continue.

Scenario 2
Alternatively as the price extended from the averages the price action may need to trade down to sideways before the up move continues.
Atlas CapitalFx
 
Posts: 678
Joined: Mon Dec 17, 2012 7:53 am

PreviousNext

Return to Daily market technical Analysis And outlook By ACFX.com