DAILY OVERVIEW
Trend : Short
Ambush Zone : 1.3015 – 1.3145
Target 1 : 1.2795
Target 2 : 1.2745
Stop : 1.3245

Comments
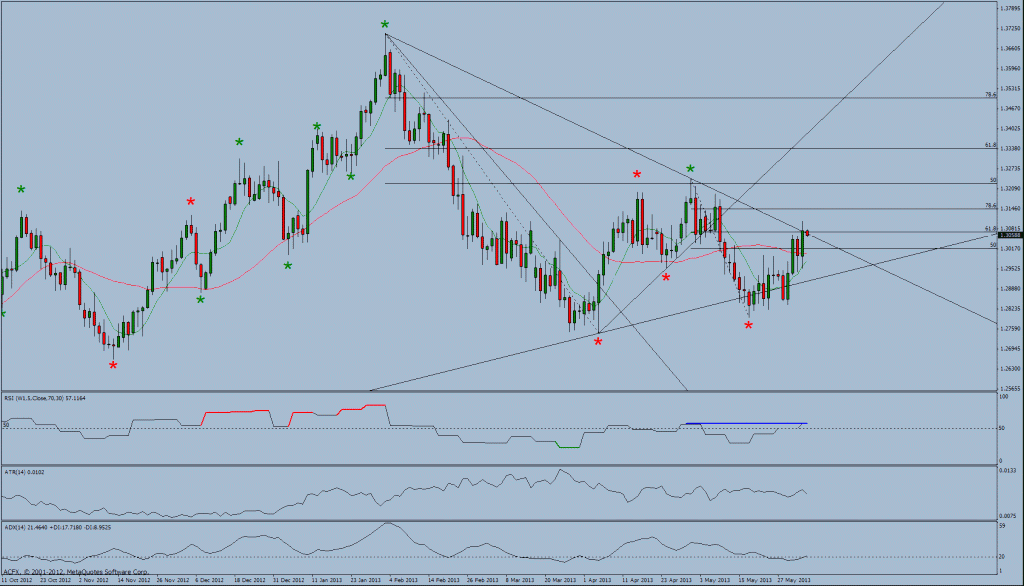
EURUSD is this morning trading lower from the open after yesterdays up day with that candle printing a piercing line. Today’s opening range is 24 pips which equates to 24% of the daily average true range.
In terms of the bigger picture the swing bias remains negative and the averages are confirming the market direction. Furthermore we have the RSI is diverging positively negatively.
However the price action is trading and closed above both averages which could be viewed as the market being overbought when the market is in a down trend or the market bias attempting to change its position from negative to positive.
If one was to move to the higher time frame Weekly chart it is easier to see that the price action is in the process of forming a higher low but confirmation is required for a change of trend to be established. Back to a daily time frame a prior swing high breach would confirm a possible change of trend.
That the price action is trading at overhead resistance in terms of the downward sloping trend line and Fibonacci resistance may put a brake on further upward momentum. However one hurdle in terms closing above the long average has been overcome.
Scenario 1
As the dominant daily trend is down the retracement into Fibonacci resistance combined with overhead trend line resistance might offer shorting opportunities. However we have yet to notice any loss of momentum that could be identified by an oscillator divergence or candle stick pattern. The initial target for any down break would be the 17th May prior swing low.
Scenario 2
Alternatively EURUSD could continue its retracement so as to eventually breach the downward sloping trend line.
Daily Technical Analysis for GBPUSD as at 4th June 2013
DAILY OVERVIEW
Trend : Short
Ambush Zone : 1.5260 – 1.5470
Target 1 : 1.5000
Target 2 : 1.4865
Stop : 1.5600

Comments
GBPUSD is this morning unchanged from the open after yesterdays strong up day with that candle printing a piercing line. Today’s opening range is 32 pips which equates to a 27% of the daily average true range.
In terms of the bigger picture he swing bias remains negative and the averages are confirming the market direction. However he price action has retraced and is currently trading above both short and long averages.
If one was to move to the higher time frame Weekly chart it is easier to see that the price action is in the process of forming a higher low but confirmation is required for a change of trend to be established.
Back to a daily time frame a prior swing high breach would confirm a possible change of trend. Overhead resistance however in terms the downward sloping trend line and Fibonacci resistance might limit further upward momentum.
Scenario 1
As the dominant daily trend is down the retracement into overhead resistance being the averages might, Fibonacci resistance and the downward sloping trend line might offer shorting opportunities. However we have yet to notice any loss of momentum that could be identified by an oscillator divergence or candle stick pattern. The initial target for any down break would be the upward sloping trend line that may offer some support followed by the 12th March prior swing low.
Scenario 2
Alternatively GBPUSD could continue its upward momentum towards the downward sloping trend line.
Daily Technical Analysis for USDJPY as at 4th June 2013
DAILY OVERVIEW
Trend : Long
Ambush Zone : 100.50 – 98.40
Target 1 : 104.00
Target 2 : 110.00
Stop : 97.00

Comments
USDJPY is this morning trading higher from the open after yesterdays down day. Today’s opening range is 99 pips which equates to 72% of the daily average true range.
In terms of the bigger picture the swing bias remains positive and the averages are confirming the market direction. However he price action has retraced and is currently trading under both the long averages and within Fibonacci support. Furthermore a large RSI is positive divergence is forming and trend line support is now very close.
Scenario 1
As the dominant daily trend is up this deep retracement into the averages and Fibonacci support may offer buying opportunities. This would also be in line with the RSI positive divergence.
We have identified the following levels as possible long targets.
1. A retouch of 104.00 being the 161.80 Fibonacci Expansion target.
2. The 105.00 level being the 200 percent Fibonacci Expansion target.
3. Around 108.00 being long term trend line resistance.
4. 110.00 being a prior Swing High Pivot.
Scenario 2
Alternatively USDJPY could continue its retracement potentially to trend line support and then the prior pivot swing low.
Daily Technical Analysis for USDCHF as at 4th June 2013
DAILY OVERVIEW
Trend : Long
Ambush Zone : 0.9550 – 0.9370
Target 1 : 0.9840
Target 2 : 0.9970
Stop : 0.9245

Comments
USDCHF is this morning trading higher from the open lower after yesterdays up day. Today’s opening range is 30 pips which equates to 24% of the daily average true range.
In terms of the bigger picture the swing bias remains positive and the averages are confirming the market direction. Furthermore there have been some significant trend line breaks to the upside which although have since retraced still puts a positive feel to USDCHF. This has been reinforced by the RSI is diverging positively.
From the negative aspect the price action has retraced and is currently trading under both short and long averages and to the bottom end of the Fibonacci support range.
Scenario 1
As the dominant daily trend is up the deep retracement into the averages and possible further move into Fibonacci support could be interpreted as oversold and might offer buying opportunities. Now that a loss of momentum has been identified in that the weekly RSI is diverging positively does give the long side some extra weight. The initial target for any down break would be the 22nd May prior swing high.
Scenario 2
Alternatively the price action could possibly continue its correction down into Fibonacci support and then the upward sloping trend line.
Daily Technical Analysis for Gold as at 4th June 2013
DAILY OVERVIEW
Trend : Short
Ambush Zone : 1452.60 – 1525.85
Target 1 : 1321.75
Target 2 : 1308.08
Stop : 1590.20

Comments
Gold is this morning trading lower from the open after yesterdays up day with that candle printing a piercing line. Today’s opening range is 870 pips which equates to 27% of the daily average true range
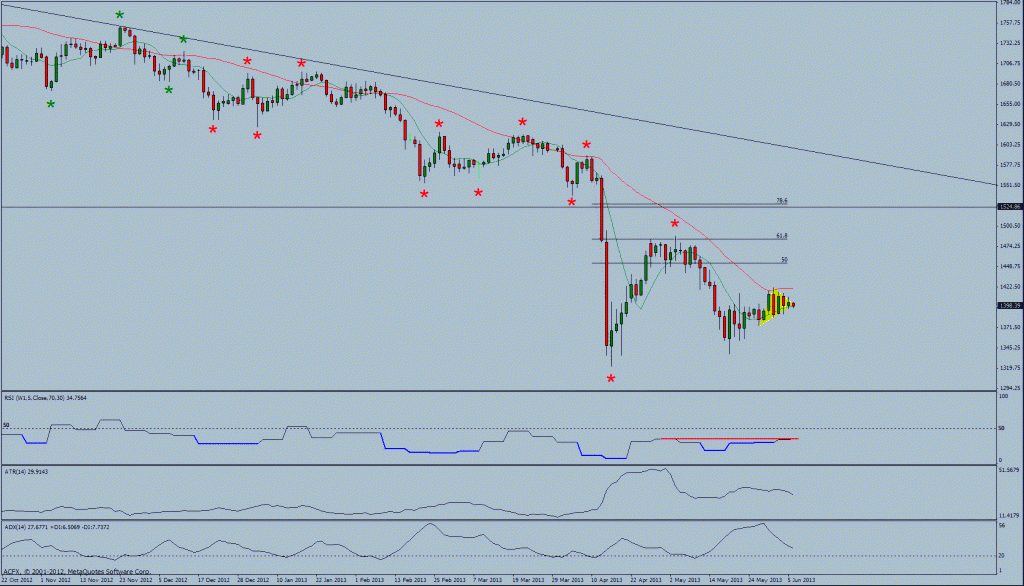
In terms of the bigger picture the swing bias remains negative and the averages are confirming the market direction. The RSI is diverging negatively and as the price action has retraced and is currently trading between both short and long averages. This could imply that resumption in downward momentum may possibly be imminent.
From a bullish perspective it would appear that Gold is in the process of forming a higher low but confirmation is required for a change of trend to be established. A prior swing high breach would confirm a possible change of trend. Overhead resistance however in terms of the long average and Fibonacci resistance may put a brake on further upward momentum.
Scenario 1
As the dominant daily trend is down the retracement into the averages might possibly offer shorting opportunities at resistance. The initial target for any down break would be the 20th May prior low.
Scenario 2
Alternatively as Gold has closed above the 8 period moving averages the potential for a move to Fibonacci resistance comes into play.
Daily Technical Analysis for Oil (WTI) as at 4th June 2013
DAILY OVERVIEW
Trend : Short
Ambush Zone : -
Target 1 : -
Target 2 : -
Stop : -

Comments
Oil is this morning trading lower from the open after yesterdays strong up day with that candle printing a piercing line. Today’s opening range is 46 pips which equates to 25% of the daily average true range.
In terms of the bigger price action continues to trade near the top of a large monthly converging triangle. However following the breach of the prior pivot low the swing bias has changed from positive to negative. This has coincided with breach of a prior broken upward sloping trend line. The averages have just crossed and our now confirming the market direction.
From a bullish perspective the price action has retraced and is trading just above Fibonacci support.
Scenario 1
As the dominant daily trend has changed to negative we are monitoring the possibility of continued move down with corrective pullbacks offering possible selling opportunities.
Scenario 2
Alternatively as the price action is trading around Fibonacci support we are monitoring the possibility of a bounce and even a resumption of the prior up trend with potential targets the 100 % and 138.2% Fibonacci Expansion level in the areas of 99.00 and 103.00 respectively. However the psychological 100.00 level will need to be broken for any further upside to continue.


