That's the beauty of this method of analysis…once the core structure (support & resistance zones & directional bias determined by common timeframe combinations) is put in place there's no obvious confusion or contrary opinion.
The only slight variable will be the risk attitude & trading objectives of the individual traders.
Whenever I look in on this thread & peruse the content I very rarely disagree with any of the generic technical or directional views & opinions. I might not always share exact entry or management specifics, but that's completely understandable for the reasons in the last line of the previous paragraph.
And the primary reason for the similar generic view is the fact everyone is singing from the same hymn sheet because the framework/structure is based on simple, logical analysis.
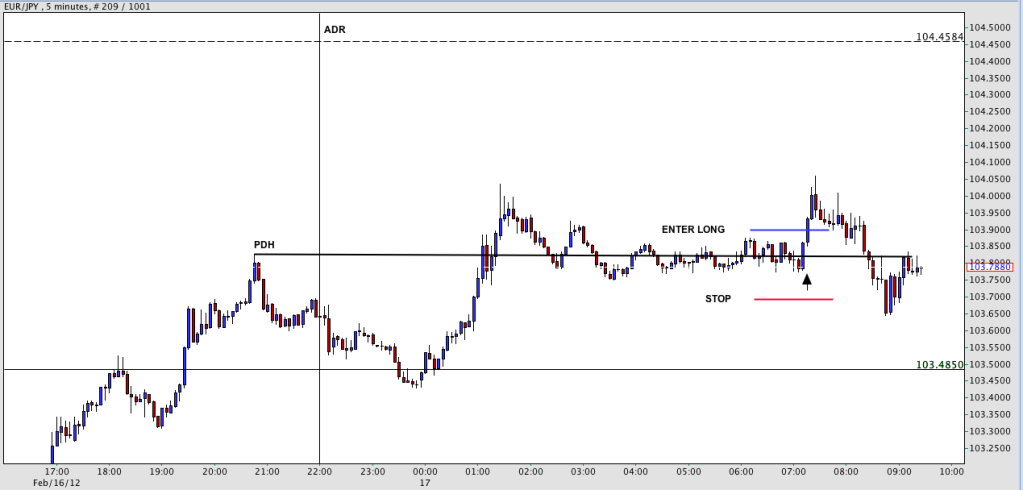
3 typical yet consistently common examples of using the combination of price action, s&r zones & indicators is highlighted in the 3 charts below.
Before adopting this framework & structure as my principle analysis base, I would have gotten lured into changing direction & being chopped around on numerous occasions. But using these tools in harmony with each other has encouraged me to tighten up my discipline & patience & continue to take the logical trade & directional view, ignoring the temptation to try catch every wiggle or wave & thus reducing & diluting my value & risk ratios.
The 3 charts share a common theme.
All use the dominant slope of the moving average as a primary directional aid. They incorporate the stochastic hook extreme as a confirmation exercise & all use the reaction to s&r zones as the primary motivator to key in off the signals being confirmed by the indicators.