
27th March 2014
EURUSD
Summary
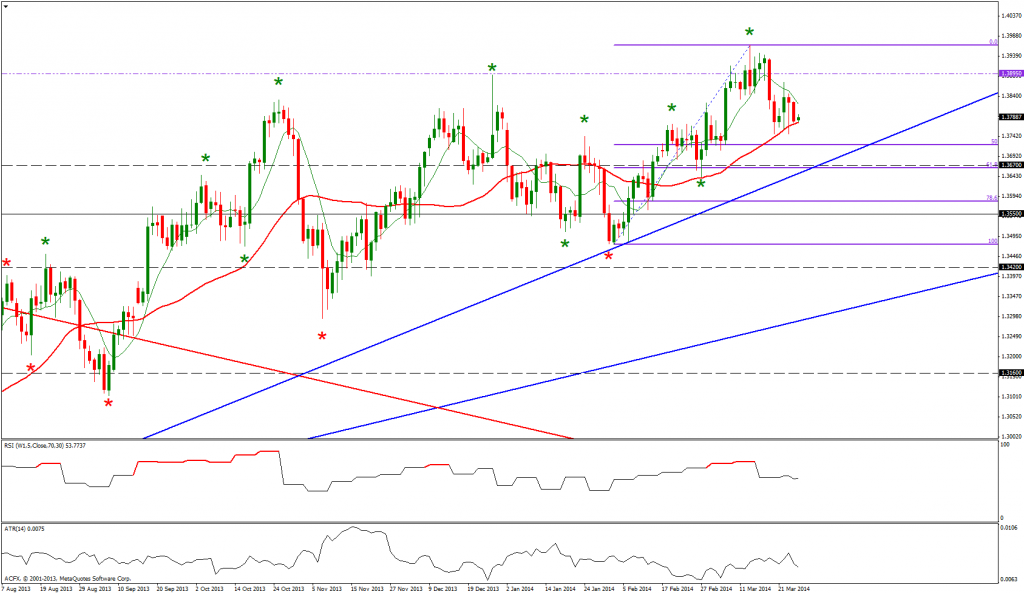
Wednesday EURUSD traded between and the 8 and 34 period daily moving averages as the price action consolidates within a tight range.
Market overview
EURUSD continues to trade in a daily uptrend following the breach of the 1.3741 level being the 24th January swing. This price action has put the daily time frame in gear with the positive weekly trend.
Focus on today
This morning EURUSD has opened quietly as it trades within the previous five days range.
I am this morning monitoring the price action for a potential move higher and a test of 8 period moving averages.
Alternatively if EURUSD fails to sustain higher prices there is a possibility that EURUSD breach the 34 period moving averages.
GBPUSD
Summary
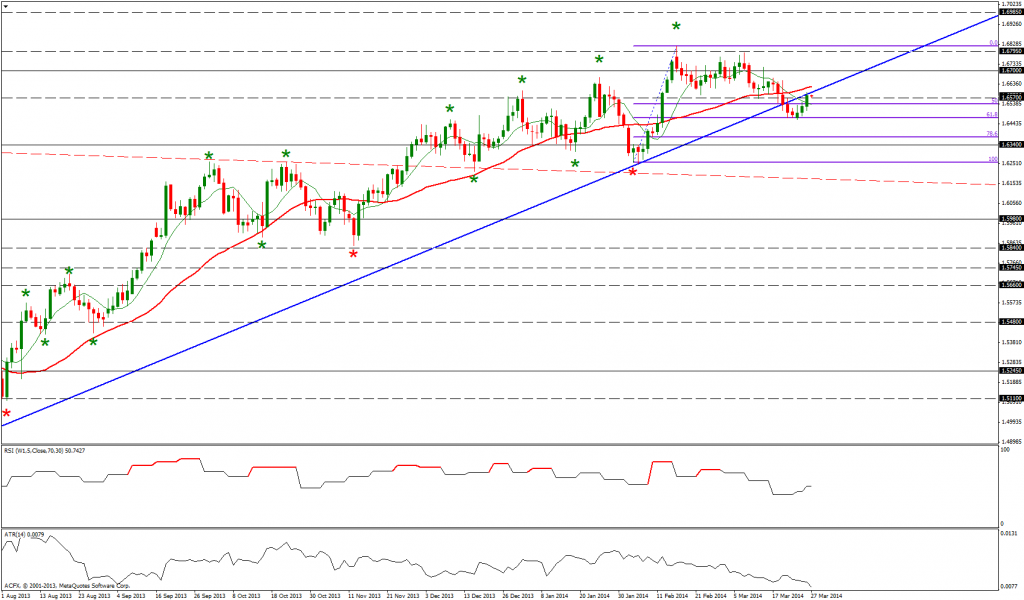
Wednesday GBPUSD tested and close above the 1.6570 level but was not able to sustain a move above the prior broken up trend line.
Market overview
GBPUSD has traded above the 1.6668 being the prior isolated pivot high. This price activity has effectively changed the daily trend to up and puts it in line with the bullish weekly outlook. However the breach the 1.6639 level being the recent daily pivot low has added a question mark to the overall health of the uptrend. Furthermore breaches of moving average, horizontal and trend line support is adding to the downside pressure. However GBPUSD is now bouncing higher off Fibonacci support which and this could possily signal an to the current downside correction.
Focus on today
This morning GBPUSD has opened quietly as the price action trades at the highs of yesterday’s candle.
I am today monitoring the price action for a test of the upward sloping trend line and the 34 period daily moving averages.
Alternatively if GBPUSD cannot sustain higher prices could see the price action test the 61.8 Fibonacci level.
USDJPY
Summary
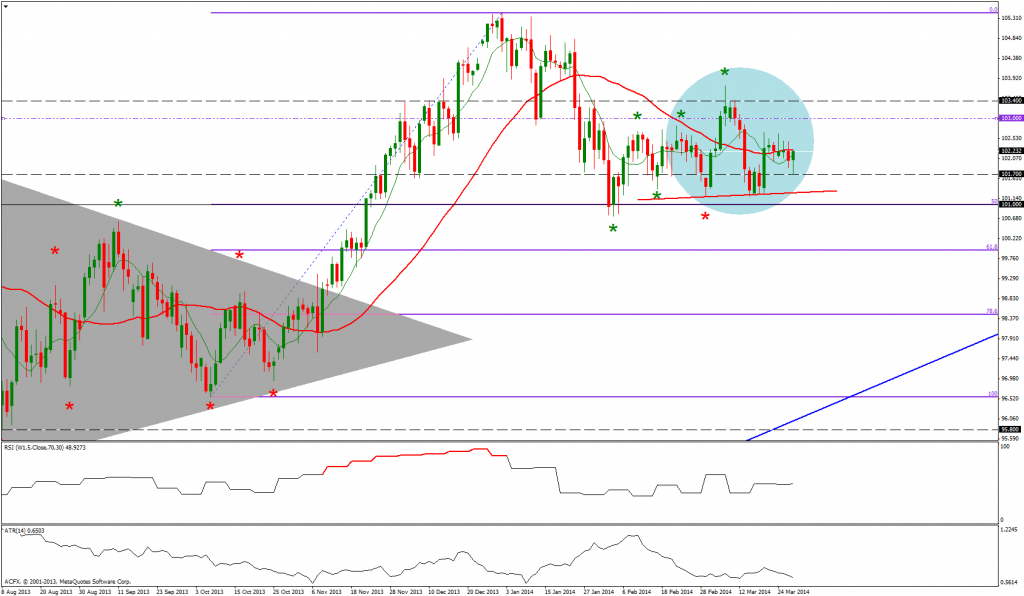
Wednesday USDJPY experienced a small range day as it continued to trade at the highs to the recent up spike in prices.
Market overview
The breach of the 102.83 level being the swing high of the 21st February has effectively changed the daily trend to up and therefore putting this time frame into gear with the bullish weekly time frame. The recent price action is now indicating that the 101.00 support level is likely to hold. However a breach of the 101.19 level being the 4th March swing low would technically change the daily trend to down and this would be in line with the formation of a bearish head and shoulders pattern.
Focus on today
This morning USDJPY initially opened negatively as the price action tested the 101.70 level but has since reversed the morning losses.
Today I am monitoring a potential test of the 103.00 level.
Alternatively a failure to sustain higher prices could see USDJPY re-test the 101.70 level.
USDCHF
Summary
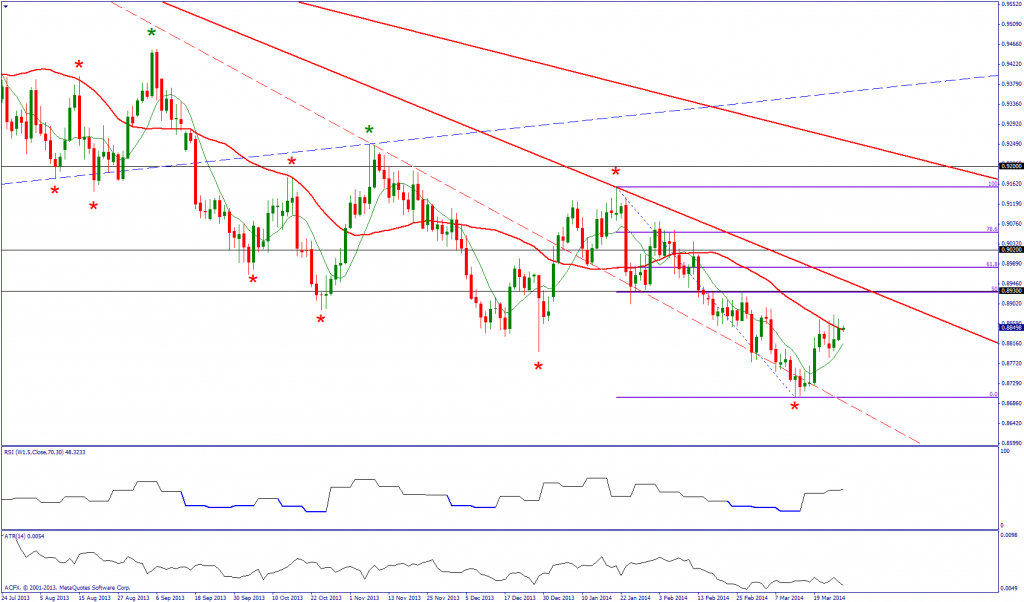
Wednesday USDCHF once again tested but could not sustain a close above the 34 period daily moving averages.
Market overview
USDCHF continues to trade in a negative daily and weekly swing bias but the recent price action is beginning to take on a bullish feel to it. I am therefore monitoring signs for a base to built that will allow for further upside at least to the downward sloping trend line. However the bias does continue to be fixed to the downside therefore shorting rallies is still probably the most logical strategy to adopt.
Focus on today
This morning USDCHF has opened quietly as the price action trades within the previous day’s range.
Today I am monitoring the price action for a retest of the 34 period moving averages.
Alternatively a failure to sustain higher prices could see USDCHF trade back to the 8 period moving averages.
Gold
Summary
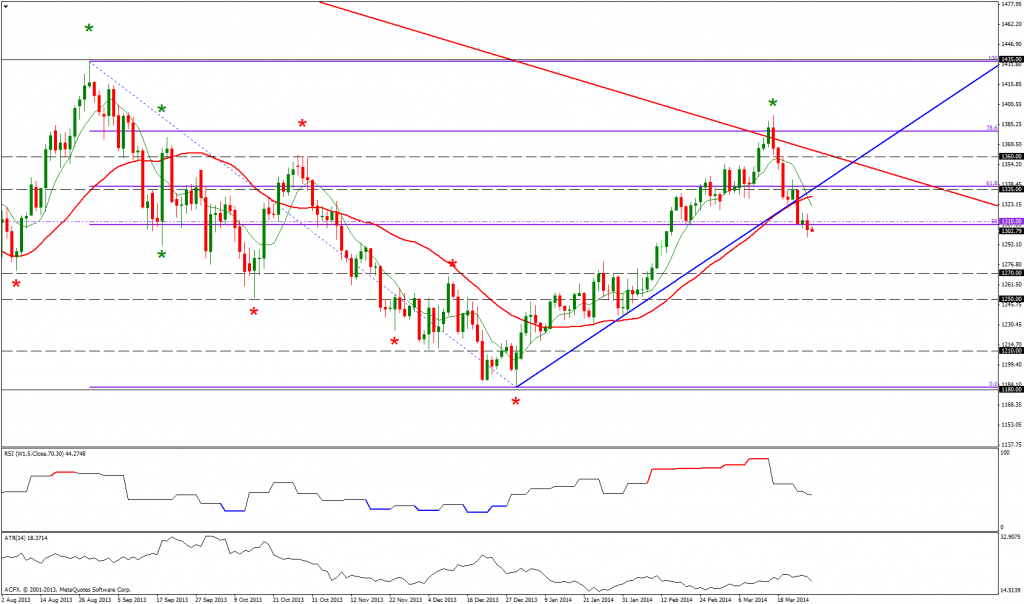
Wednesday Gold tested and closed under the 1310.00 support level.
Market overview
Gold continues to trade in a daily uptrend following the breach of the 1267.99 level being the swing high of the 10th December. The break above the large downward sloping trend line adds impetus to the current positive swing bias. Furthermore we have witnessed a large multi month double bottom forming which could indicate a large upside trend reversal is a possibility.
However the weekly time frame continues to point down. That the recent rejection of higher prices has come off a bounce from a downward sloping trend line and Fibonacci resistance level could indicate that the recent rally in Gold is part of a bigger cycle correction that ultimately sends Gold lower.
Focus on today
This morning Gold has opened quietly as the price within the previous days candle range and below the 1310.00 support level.
Today I am monitoring the price action for a continuation of yesterday’s downside momentum.
Alternatively a failure to sustain lower prices could see Gold test the 1310.00 level.
Oil
Summary
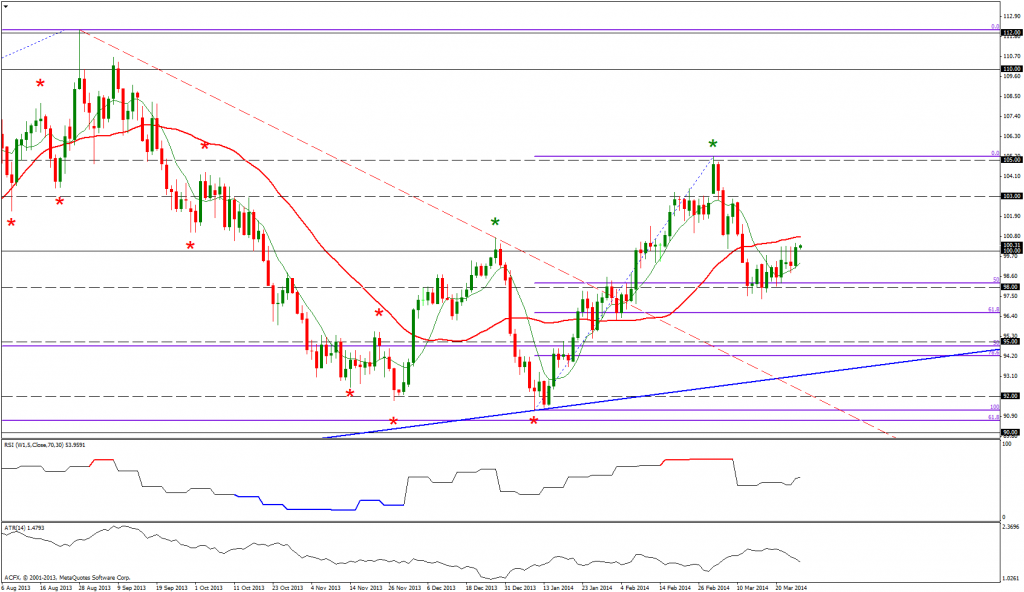
Wednesday Oil tested and closed above the 100 level.
Market overview
Oil continues to trade in a daily uptrend following the breach of the 100.72 level being the swing high of the 24th December. The daily and weekly times both have a positive bias. The recent price activity has seen Oil trade down to an area of Fibonacci support which could potentially offer a buying opportunities.
Focus on today
This morning Oil has opened positively with the price action trading at the highs of yesterday’s candle range.
Today I am monitoring the price action for a test of the 34 period moving averages,
Alternatively a failure to sustain higher prices could see Oil trade under the 100 level and test the 8 period daily moving averages.
AUDUSD
Summary
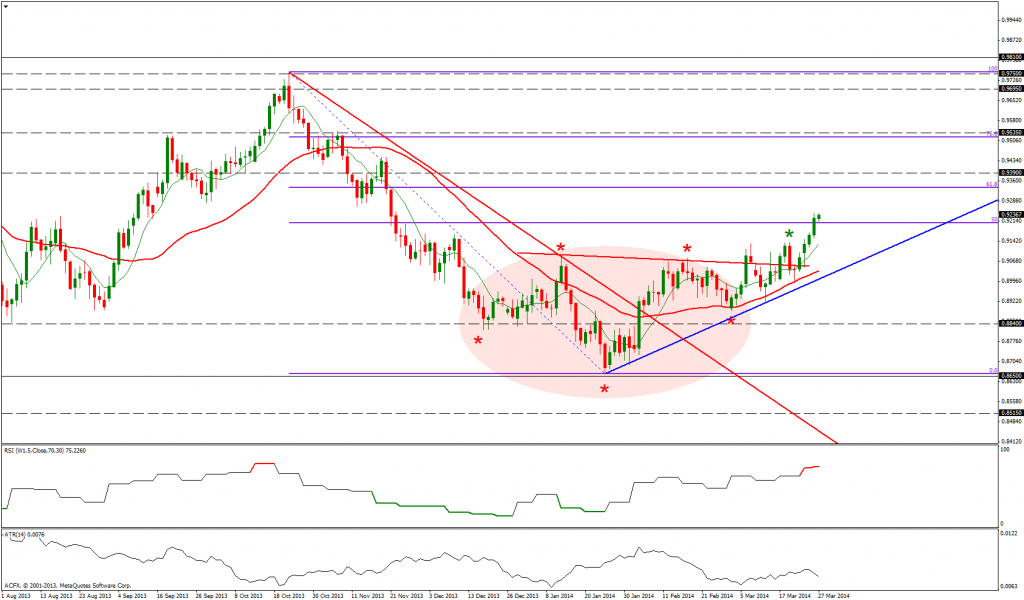
Wednesday AUDUSD continued to trade higher and closed withing the 50 to 61.8 Fibonacci resistance area.
Market overview
AUDUSD has been trading in a daily uptrend following the breach of the 0.9080 level being the swing high of the 18th February. However the weekly chart continues to trade in a weekly down trend with the price action now trading into the Fibonacci resistance area. That AUDUSD has formed a large inverse head and shoulders pattern it will be interesting to see if either this pattern trades to its upside target which comes in at the 0.9535 level of if Fibonacci resistance will offer a strong barrier to further upside momentum.
Focus on today
This morning AUDUSD has positivley as the price action trades above the highs of yesterday’s range.
I am this morning monitoring the price action for a potential continuation of the move higher.
Alternatively if AUDUSD fails to sustain higher prices there is a possibility that AUDUSD trades back to the 8 period daily moving averages.
Dow30
Summary
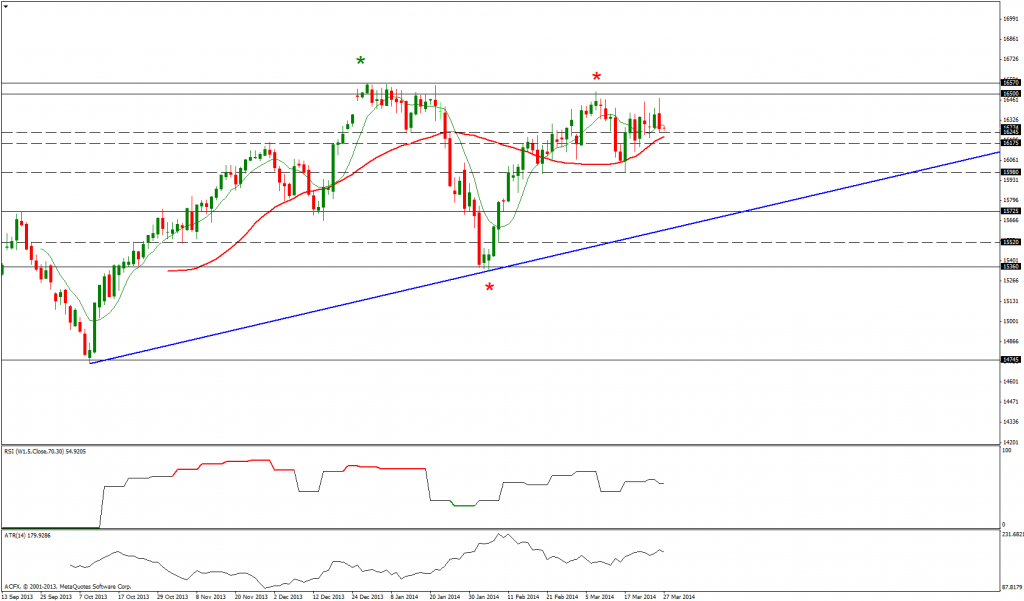
Wednesday Dow30 traded higher as it above last weeks high. Higher the price action was not able to sustain itself above this level and eventually closed just under the 8 period daily moving averages.
Market overview
Dow30 has been trading in a daily down trend following the breach of the 015664 level being the swing low pivot of the 26th December. However the weekly chart continues to trade in a weekly up trend.
Focus on today
This morning Dow30 hasopened positivley as the price action trades at the lows of yesterday’s range.
I am this morning monitoring the price action for a potential re-test of the 16447 level being last week’s high.
Alternatively if Dow30 fails to sustain higher prices there is a possibility that Dow30 tests the 34 period moving averages.