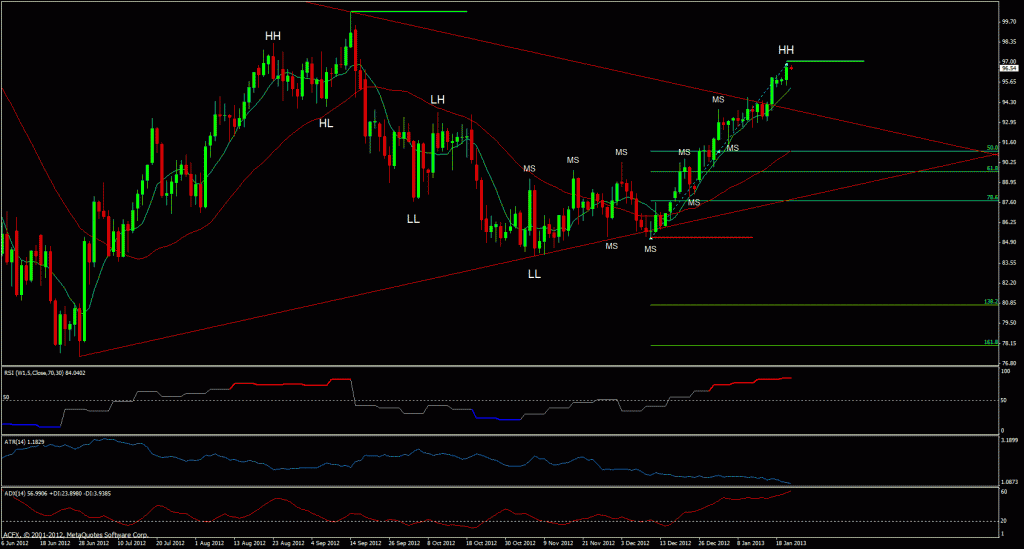
DAILY OVERVIEW
Trend : Long
Ambush Zone : 1.3195 – 1.3080
Target 1 : 1.3400
Target 2 : 1.3385
Stop : < 1.2995

Comments
EURUSD continues to trade in or around the 8 period moving averages. A move back to Fibonacci support may offer the possibility of participating once again on the long side however an upward break from these levels can also not be ruled out.
Definitions
Trend : Current trend as defined by technical Swing Analysis
HH : Higher High
HL : Higher Low
LL : Lower Low
LH : Lower High
CofT : Change of Trend
Daily Technical Analysis for GBPUSD as at 23rd January 2013
DAILY OVERVIEW
Trend : Short
Ambush Zone : -
Target 1 : -
Target 2 : -
Stop : -

Comments
GBPUSD continues to trade around the lows. At the moment, it is probably too early in the move to post a possible Fibonacci resistance sell zone area.
Definitions
Trend : Current trend as defined by technical Swing Analysis.
HH : Higher High
HL : Higher Low
LL : Lower Low
LH : Lower High
CofT : Change of Trend
Daily Technical Analysis for USDCHF as at 23rd January 2013
DAILY OVERVIEW
Trend : Long
Ambush Zone : 0.9230 – 0.9140
Target 1 : 0.9385
Target 2 : 0.9490
Stop : <0.9080

Comments
As posted yesterday, “USDCHF is now retracting back to the 8 period moving averages. We are monitoring the price action for a possible move back to Fibonacci support which may offer the possibility of a buying opportunity.”
Definitions
Trend : Current trend as defined by technical Swing Analysis
HH : Higher High
HL : Higher Low
LL : Lower Low
LH : Lower High
CofT : Change of Trend
Daily Technical Analysis for USDJPY as at 23rd January 2013
DAILY OVERVIEW
Trend : Long
Ambush Zone : -
Target 1 : -
Target 2 : -
Stop : -

Comments
Yesterday’s analysis and comment about the RSI divergence combined with declining ADX values has so proved correct in identifying a trend pause and reversal. We would like to see a substantial decline before posting a Fibonacci support area.
Definitions
Trend : Current trend as defined by technical Swing Analysis
HH : Higher High
HL : Higher Low
LL : Lower Low
LH : Lower High
CofT : Change of Trend
Daily Technical Analysis for Gold as at 23rd January 2013
DAILY OVERVIEW
Trend : Long
Ambush Zone : -
Target 1 : -
Target 2 : -
Stop : -

Comments
Gold continues to trade at its highs. At the moment we have not posted a new trade set up for longs as it is possible too early in the current move however an upside break is also likely.
Definitions
Trend : Current trend as defined by technical Swing Analysis
HH : Higher High
HL : Higher Low
LL : Lower Low
LH : Lower High
CofT : Change of Trend
Daily Technical Analysis for Oil (WTI) as at 23rd January 2013
DAILY OVERVIEW
Trend : Long
Ambush Zone : -
Target 1 : -
Target 2 : -
Stop : -

Comments
Oil continues to move higher are the brief two day pause. We continue to monitor the price action for an opportunity to participate in this up move.
Definitions
Trend : Current trend as defined by technical Swing Analysis
HH : Higher High
HL : Higher Low
LL : Lower Low
LH : Lower High
CofT : Change of Trend

