Instaforex Analysis

Forex broker related topics and discussions

Re: Instaforex Analysis

Postby IFX Bella » Tue Jan 13, 2026 3:14 am

Forex Analysis & Reviews: Overview of the EUR/USD pair. January 13. Finita la comedia

Image

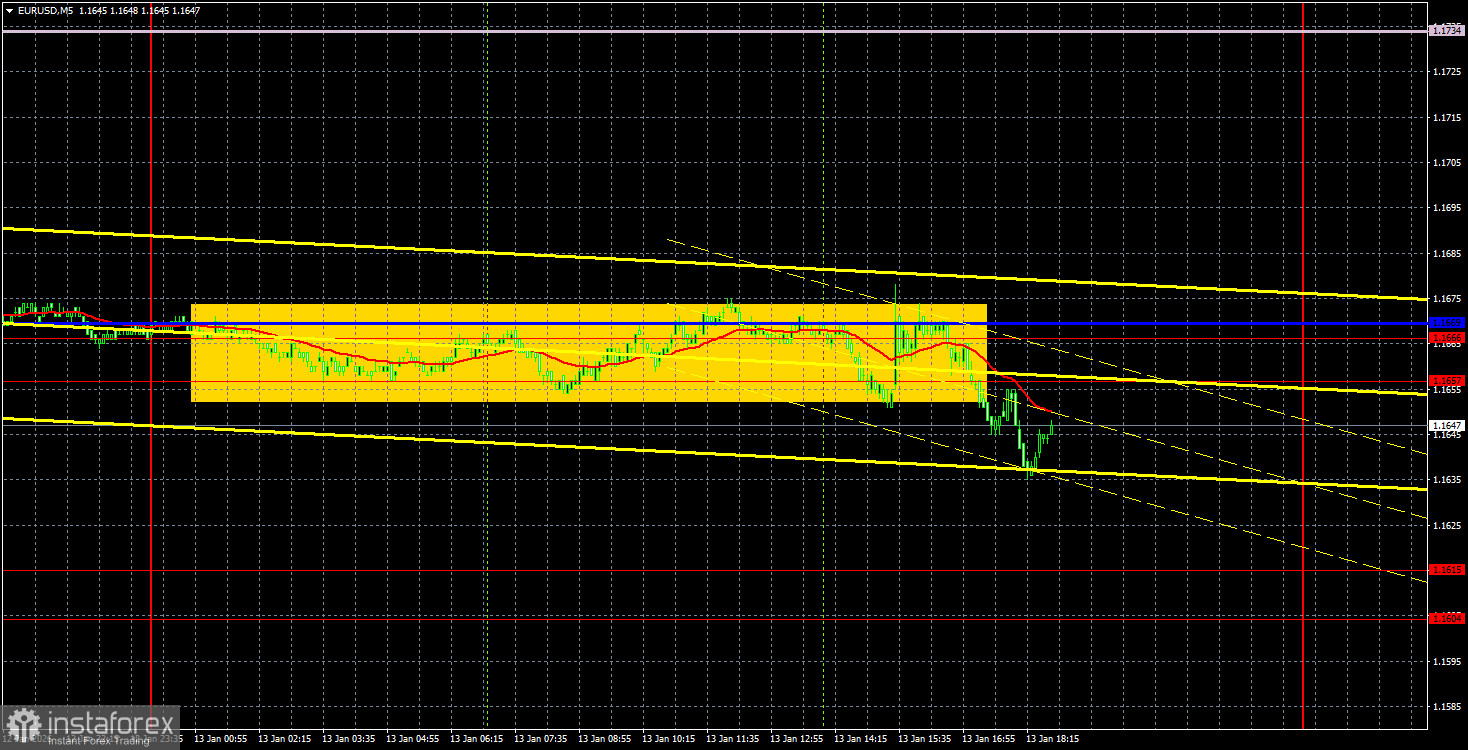
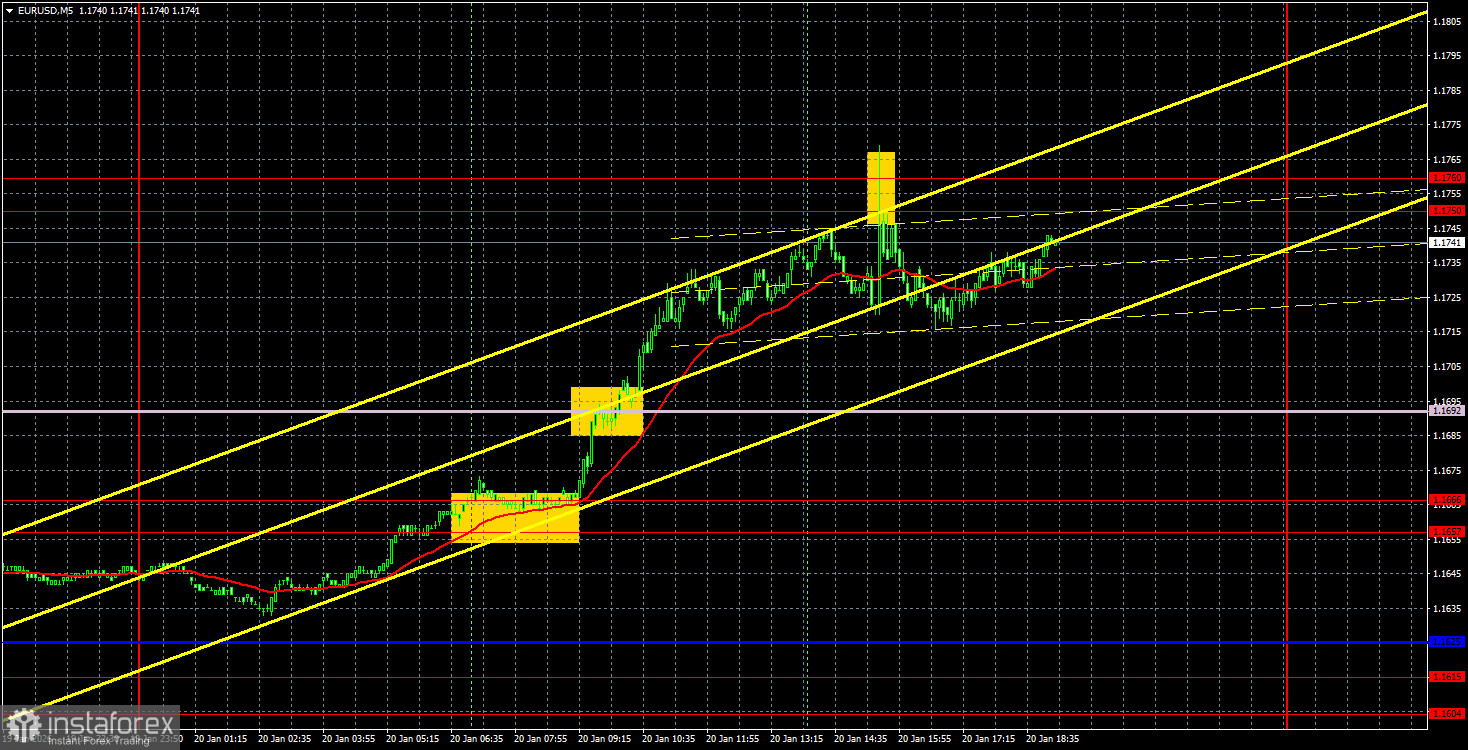
The EUR/USD currency pair showed significant volatility and good growth on Monday. Recall that we warned of a high probability of a "boring Monday," since no scheduled macroeconomic releases or fundamental events were on the calendar. However, an unscheduled speech by Jerome Powell took place overnight, against whom a criminal case had been opened a short time earlier... So, the story about overspending on the reconstruction of the Fed buildings, which took place 4 years ago, has nonetheless developed. Donald Trump, for a long time, threatened to sue Powell, whom he himself appointed 8 years ago as chairman of the US central bank, and has finally moved from words to action. Although if you look at the issue a bit more seriously, the picture is somewhat different. Last summer, Powell faced accusations of giving false testimony before the US Congress (perjury). According to Republicans, Powell did not mention expensive marble or a VIP dining room during the discussion of the Fed's reconstruction budget before Congress. The initial estimate rose from $600 million to $2.5 billion, but Congress approved it. Now, when Trump is doing everything he can to remove Powell (although there is little point in this anymore), senators and congressmen suddenly decided that Powell spent too much money. Let me remind you that this is not about Powell repairing his own residence at public expense. It concerns Fed buildings, and what personal interest could Powell have in spending as much money as possible on something that does not belong to him? What exactly is his guilt? There are surely official documents that itemize all expenditures with the materials used and the work performed. Congress surely saw that estimate. And if it did not see it, the question arises — why? It is unlikely that Powell hid it. In general, the theater of American absurdity continues. The most interesting thing is that, in fact, a criminal case has not yet been opened. Powell was only summoned to testify before a "grand jury." This is not an official court hearing; it has the character of voluntary witness testimony. Simply put, Powell must provide documents showing how the money was spent. Then the Department of Justice will decide whether there was overspending of state funds and whether Powell made false statements to Congress 4 years ago. In short, no sanctions will be applied to Powell in the near future, and he will leave his post as Fed chair before a court issues a verdict (if the case even goes to trial). Essentially, there is no point for Trump to keep fighting Powell, since Powell's term expires in May. But this is, so to speak, a show punishment. So that other members of the FOMC will be more compliant and obedient when the US president demands a rate cut. The dollar clearly did not like that development...

Image

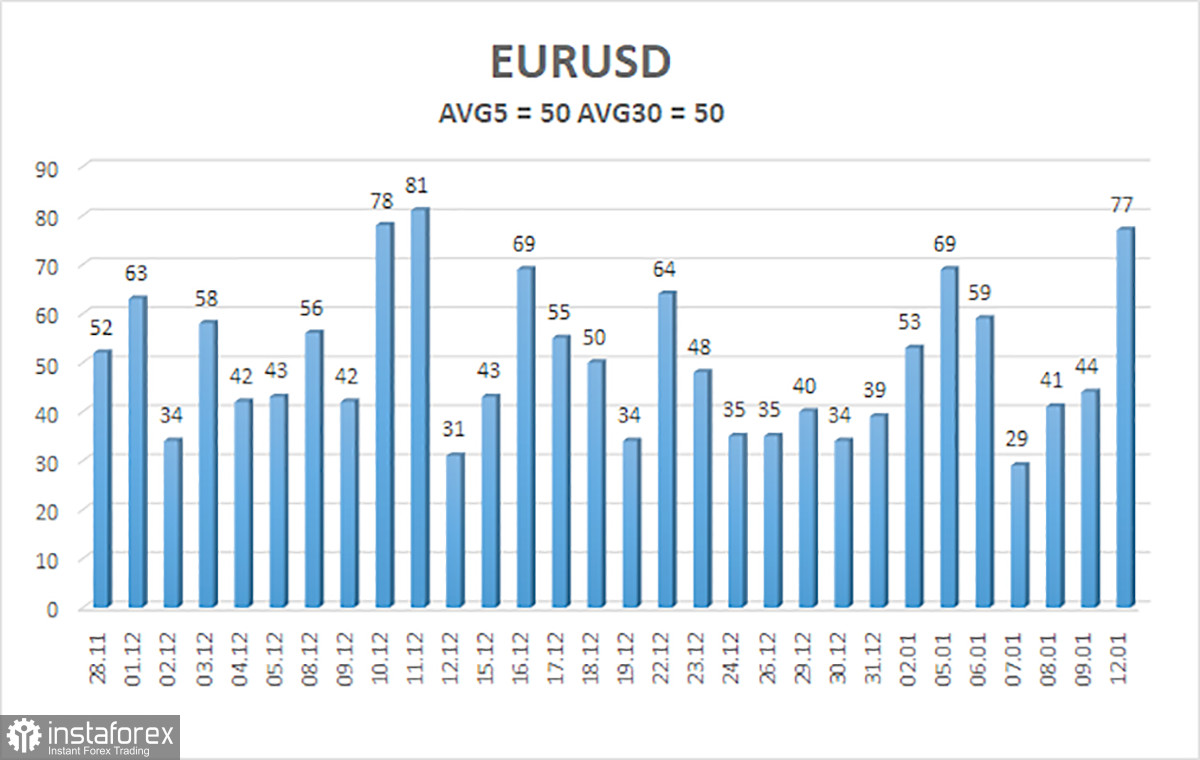
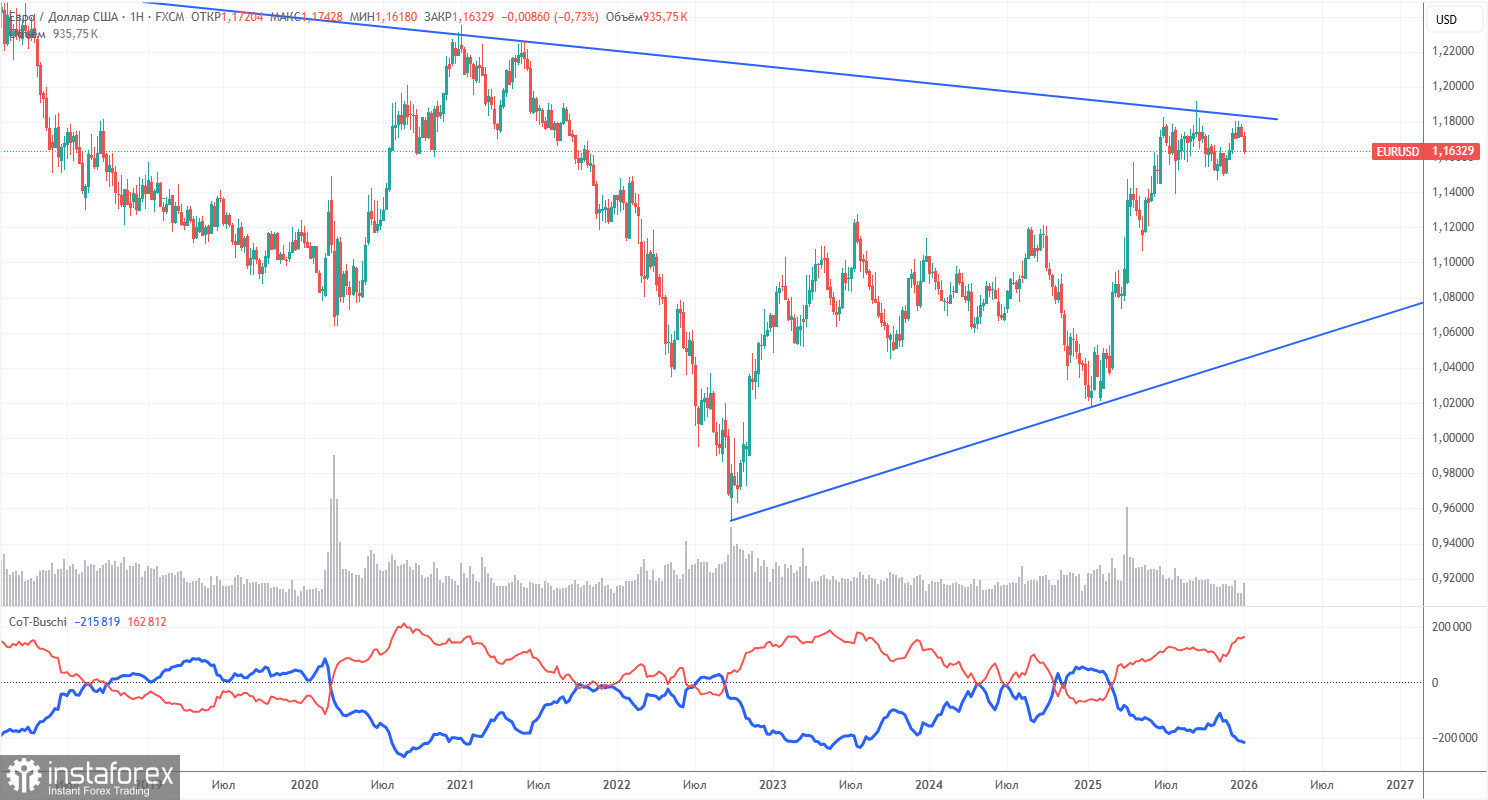
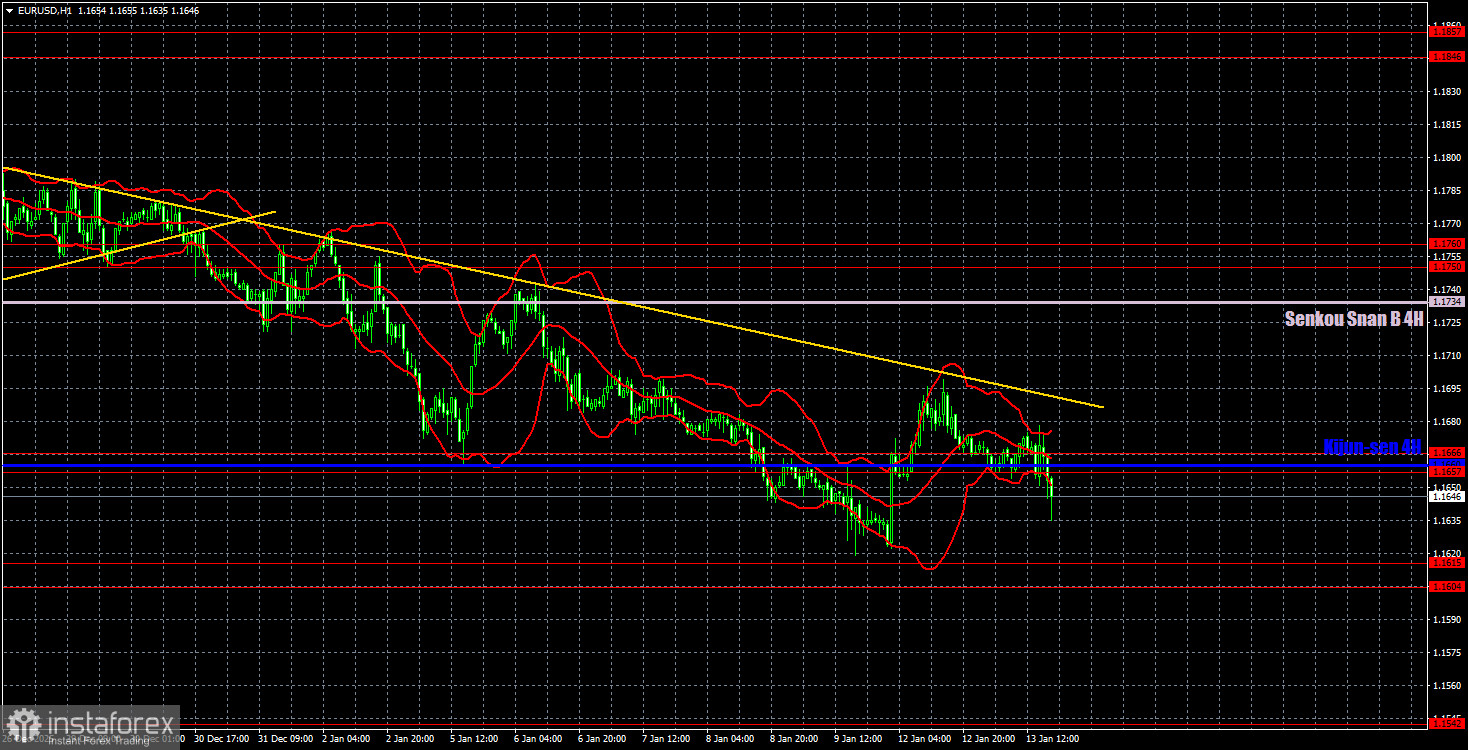
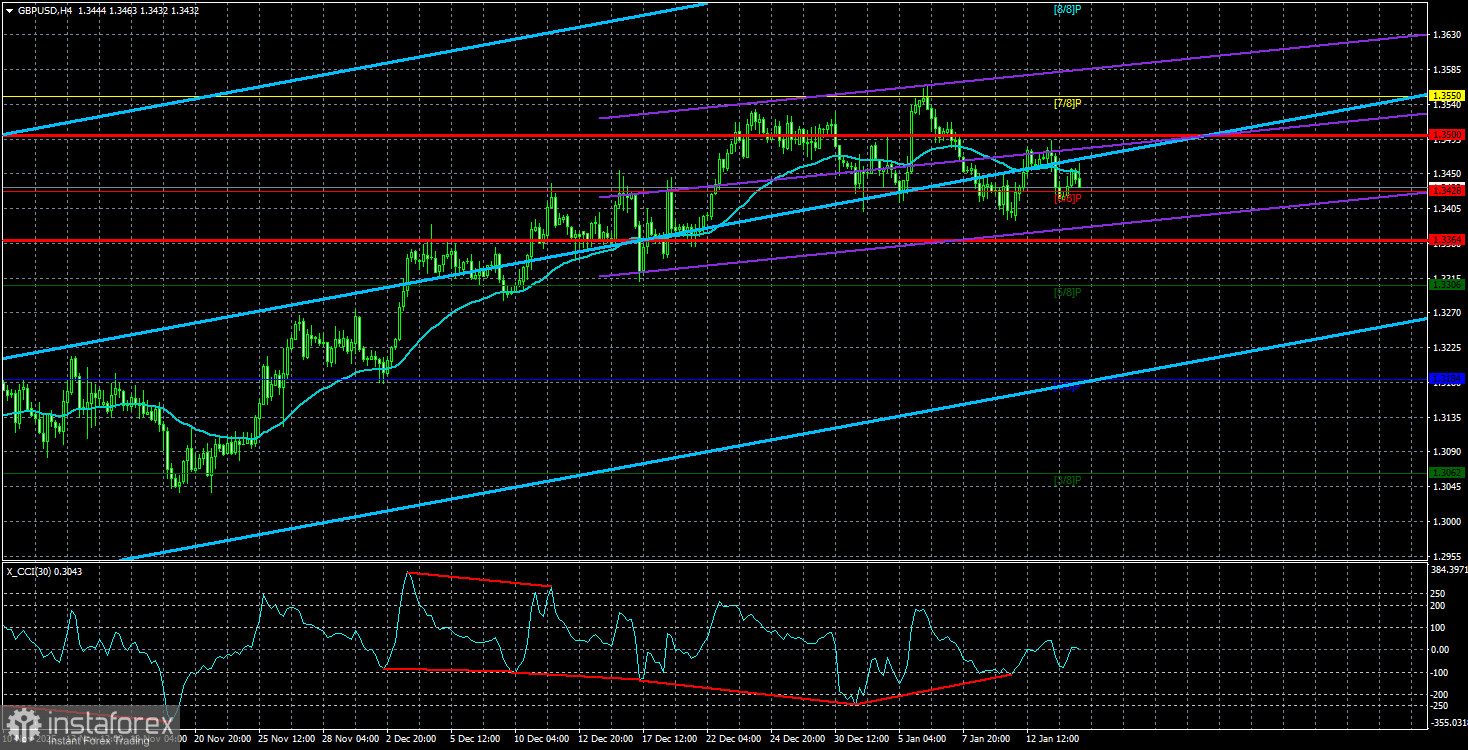
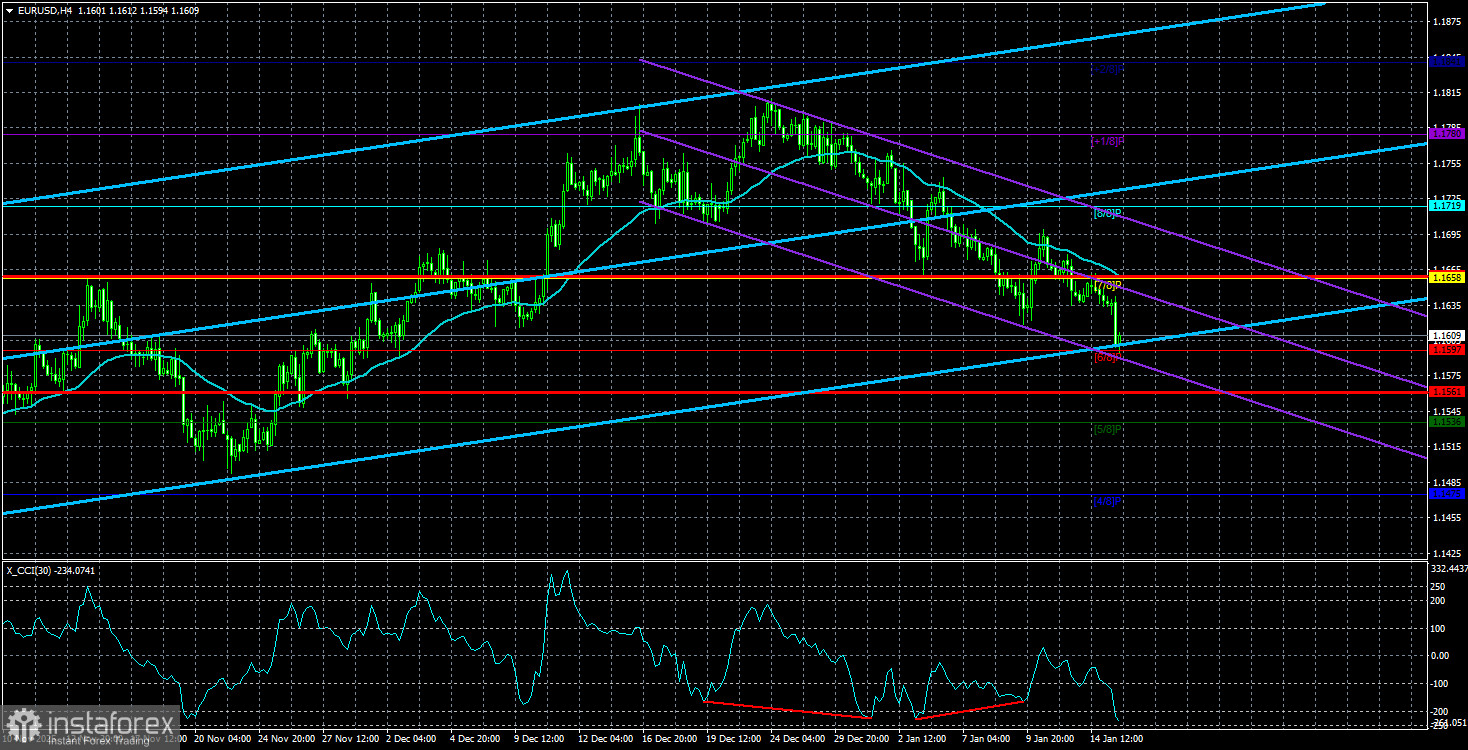
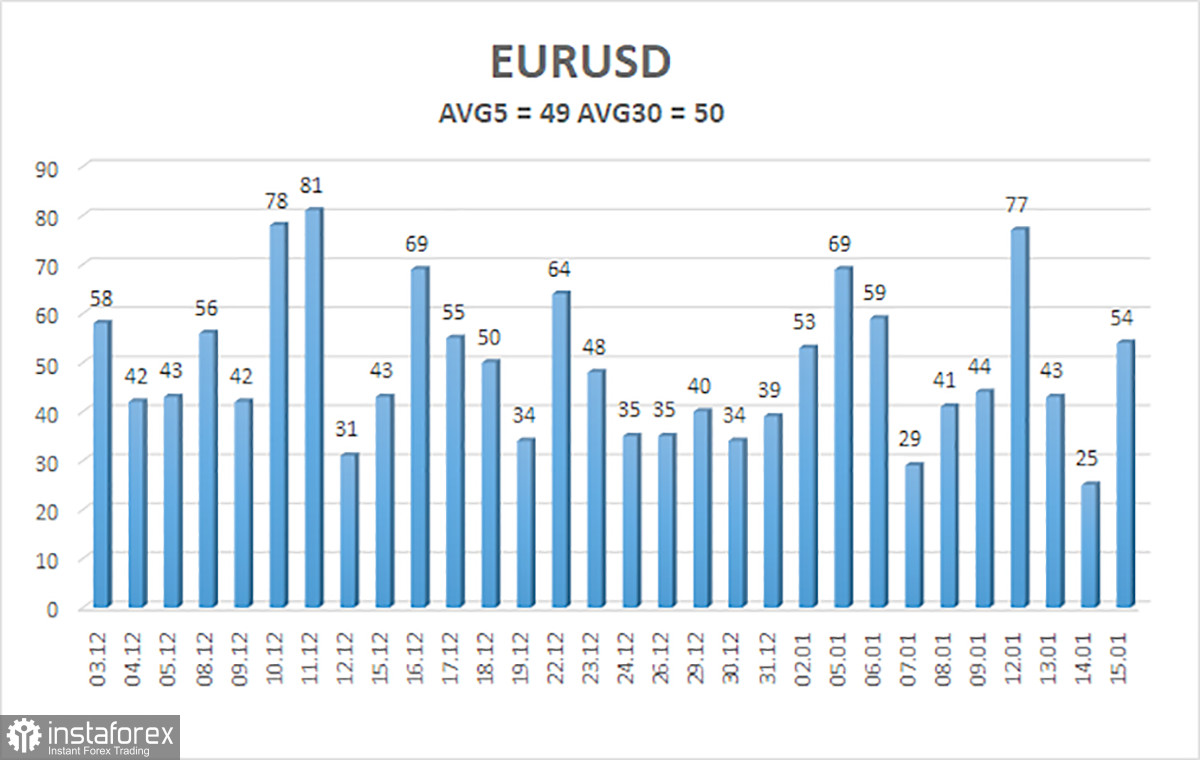
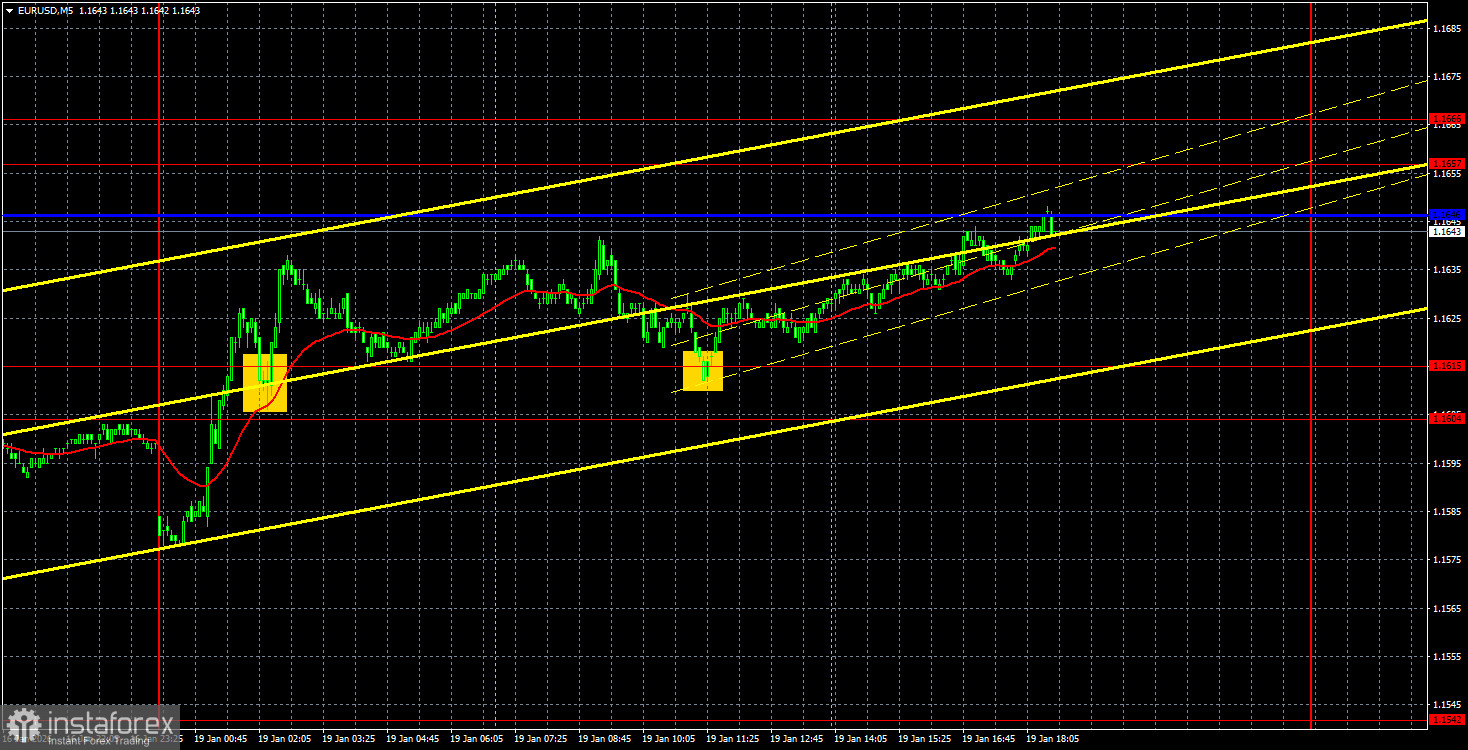
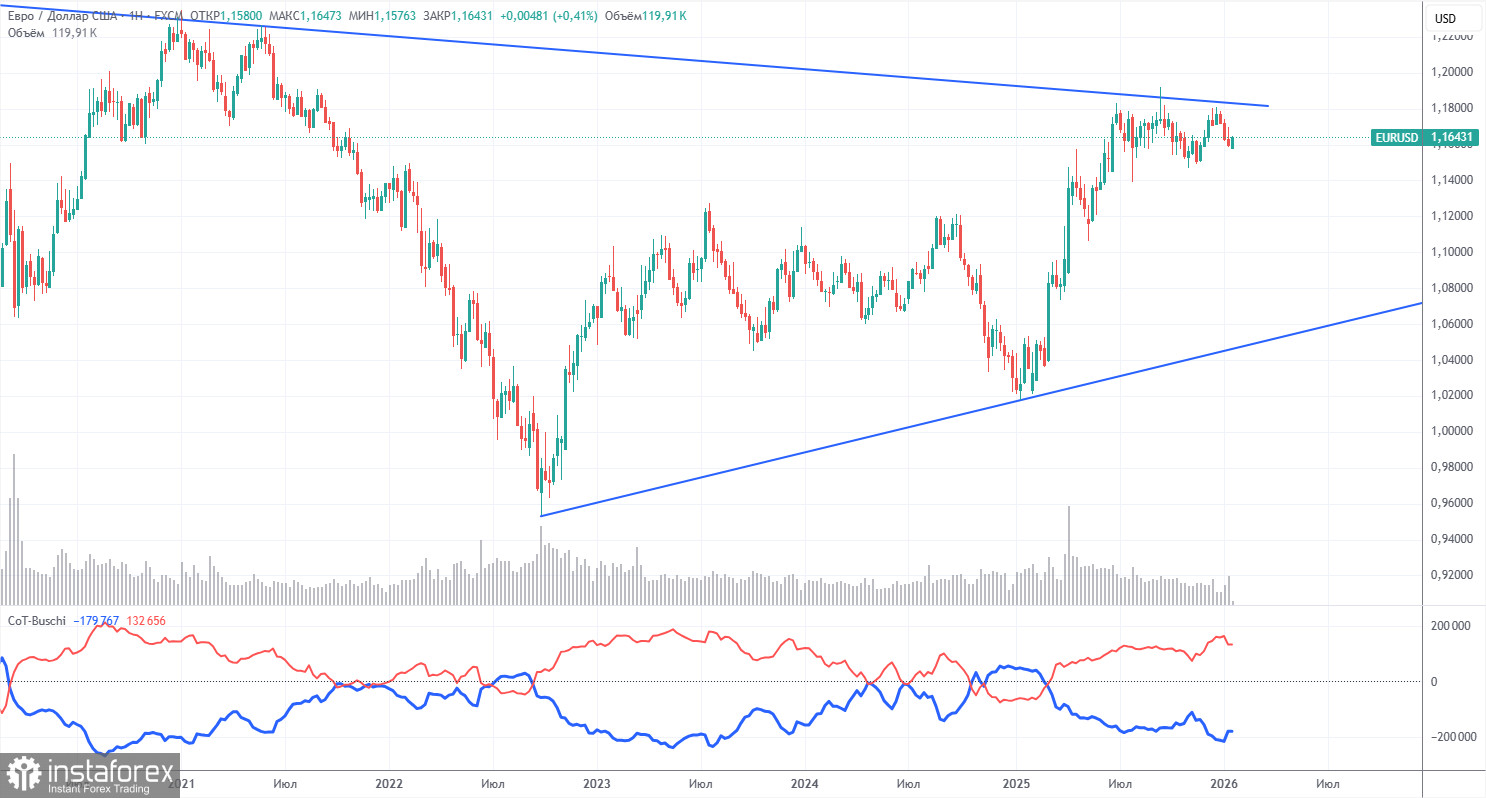
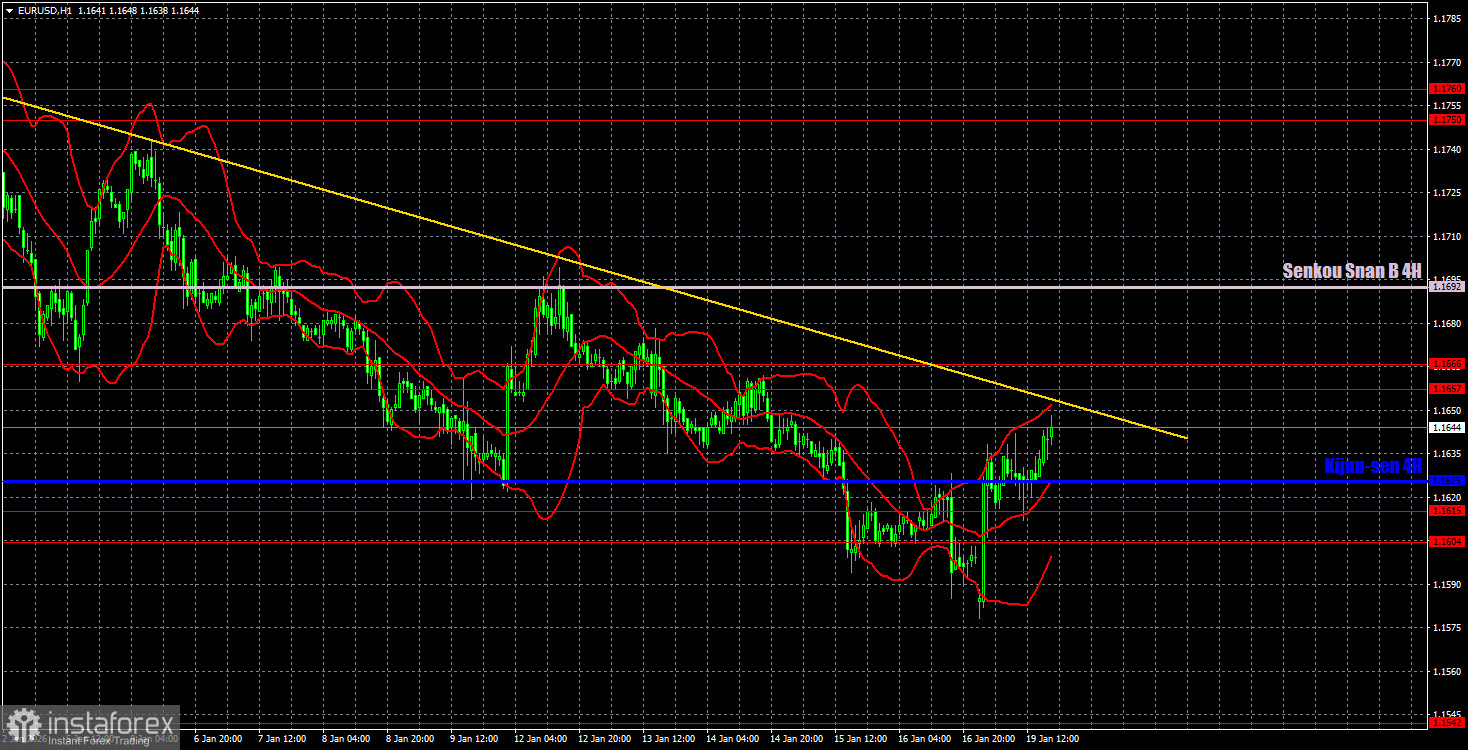
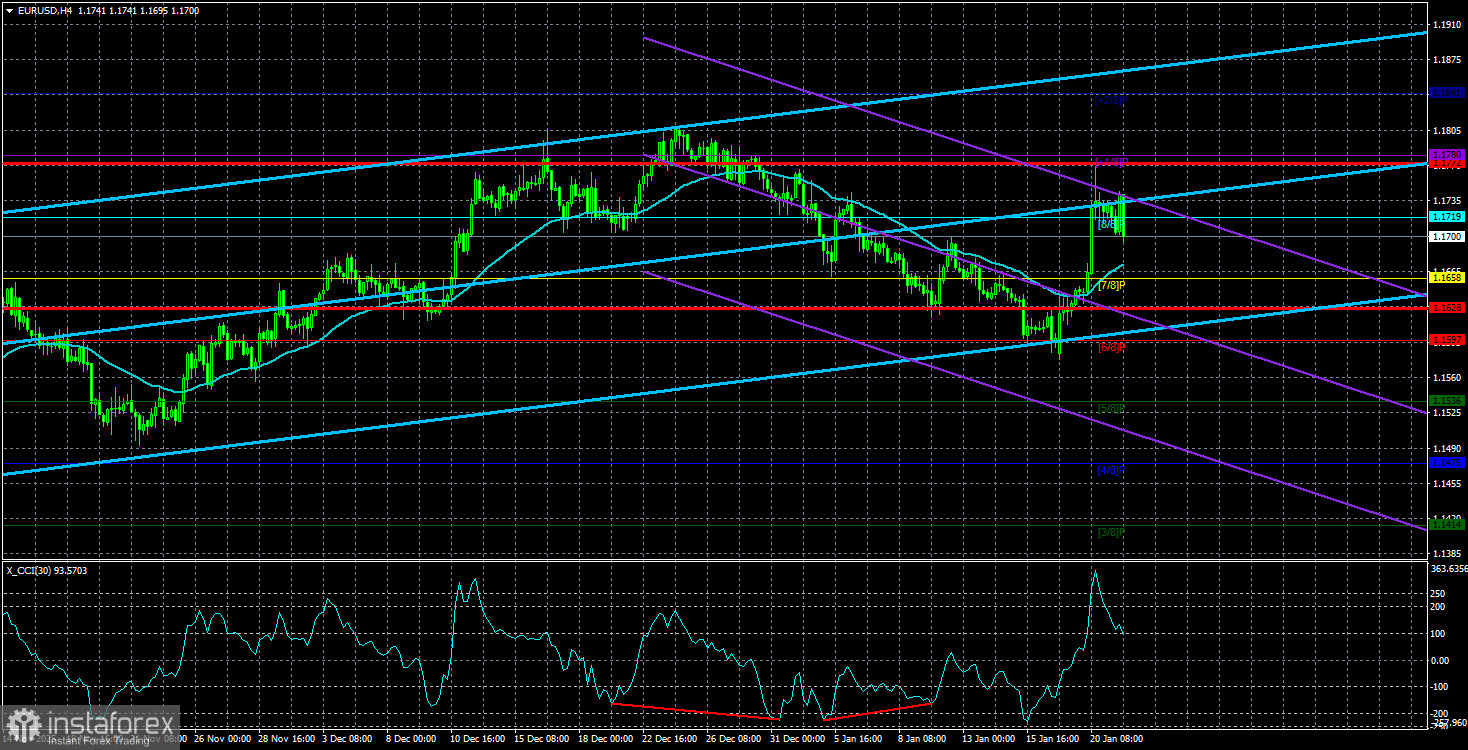
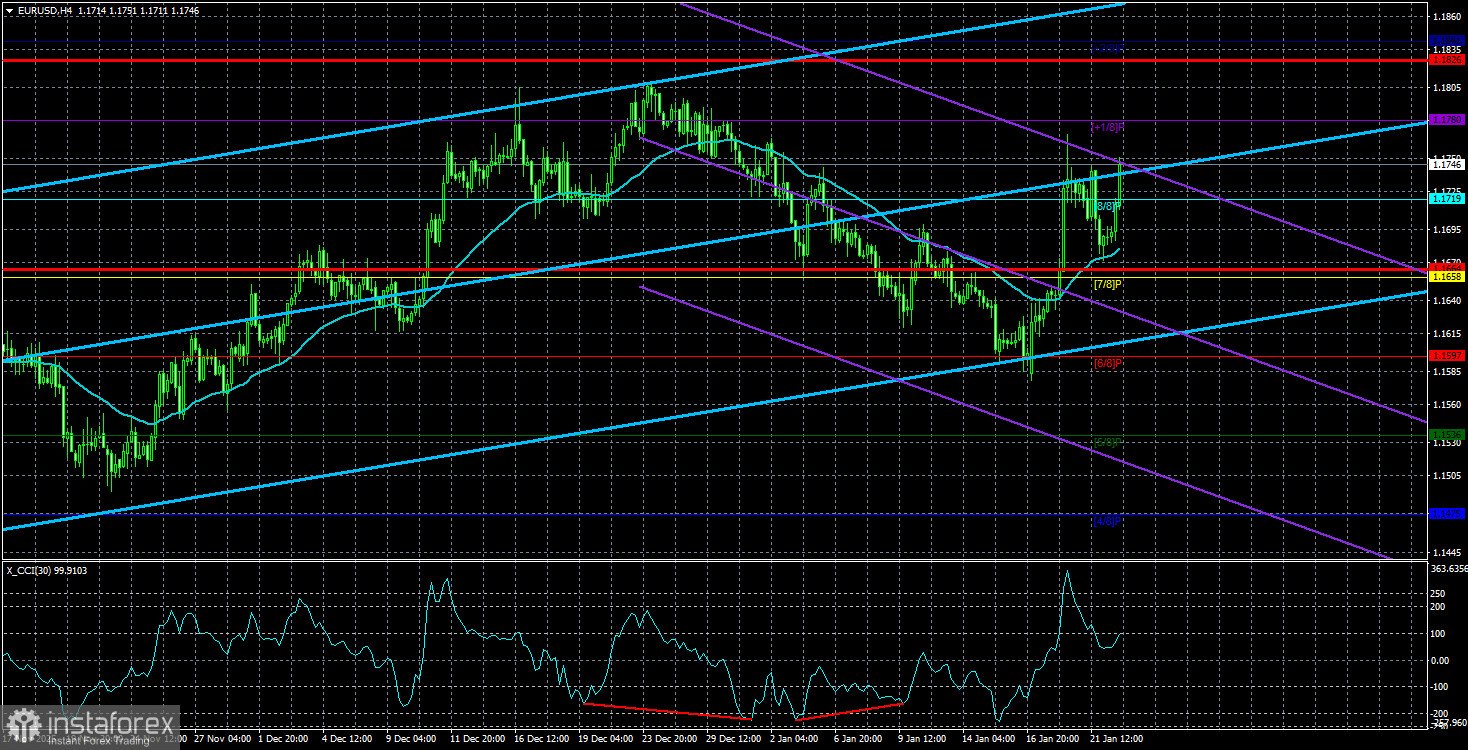
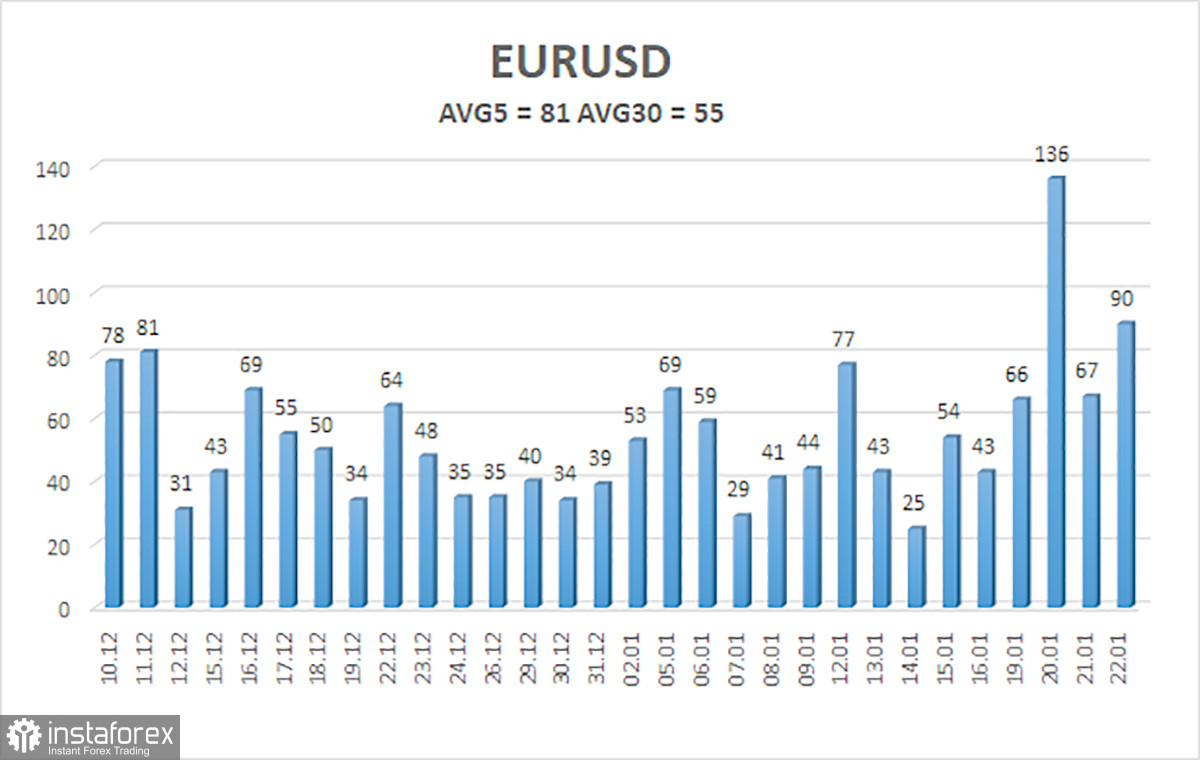
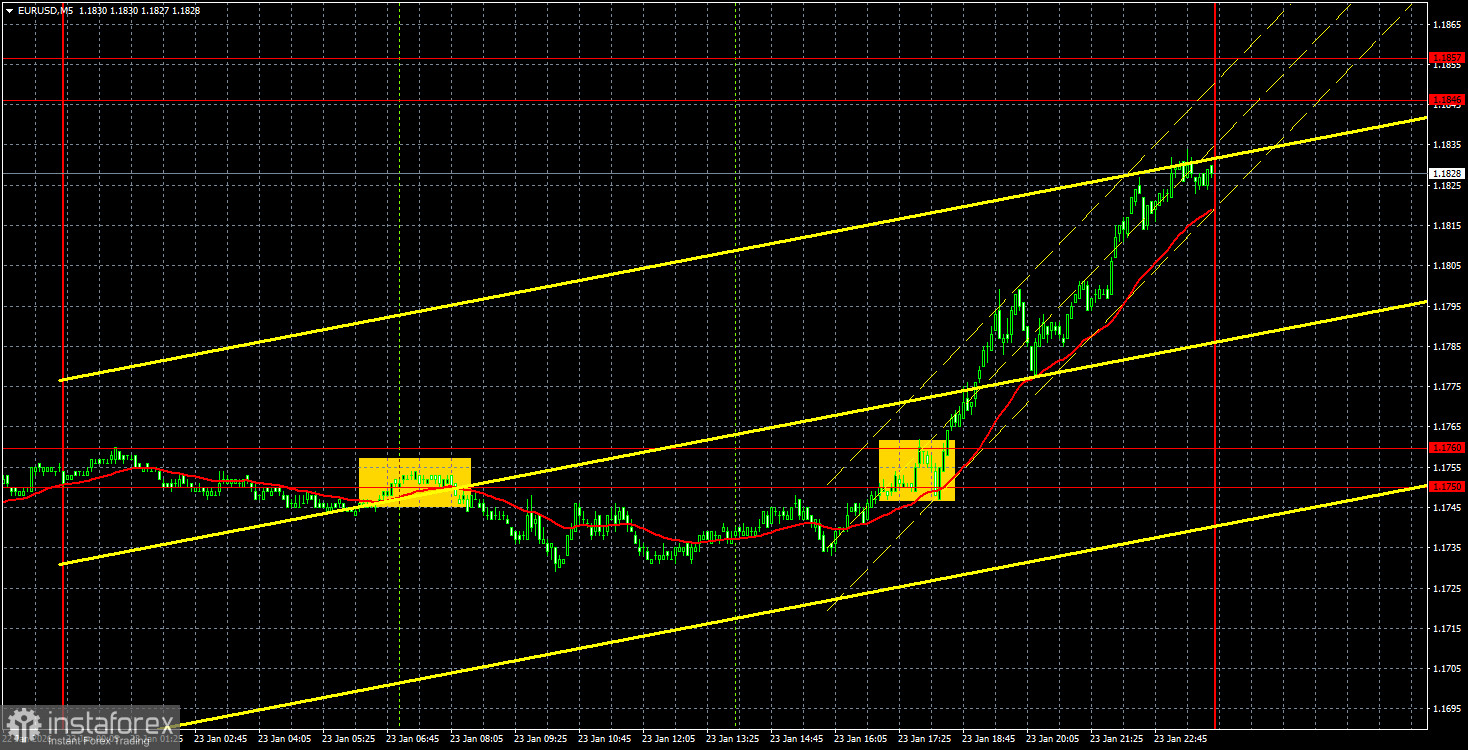
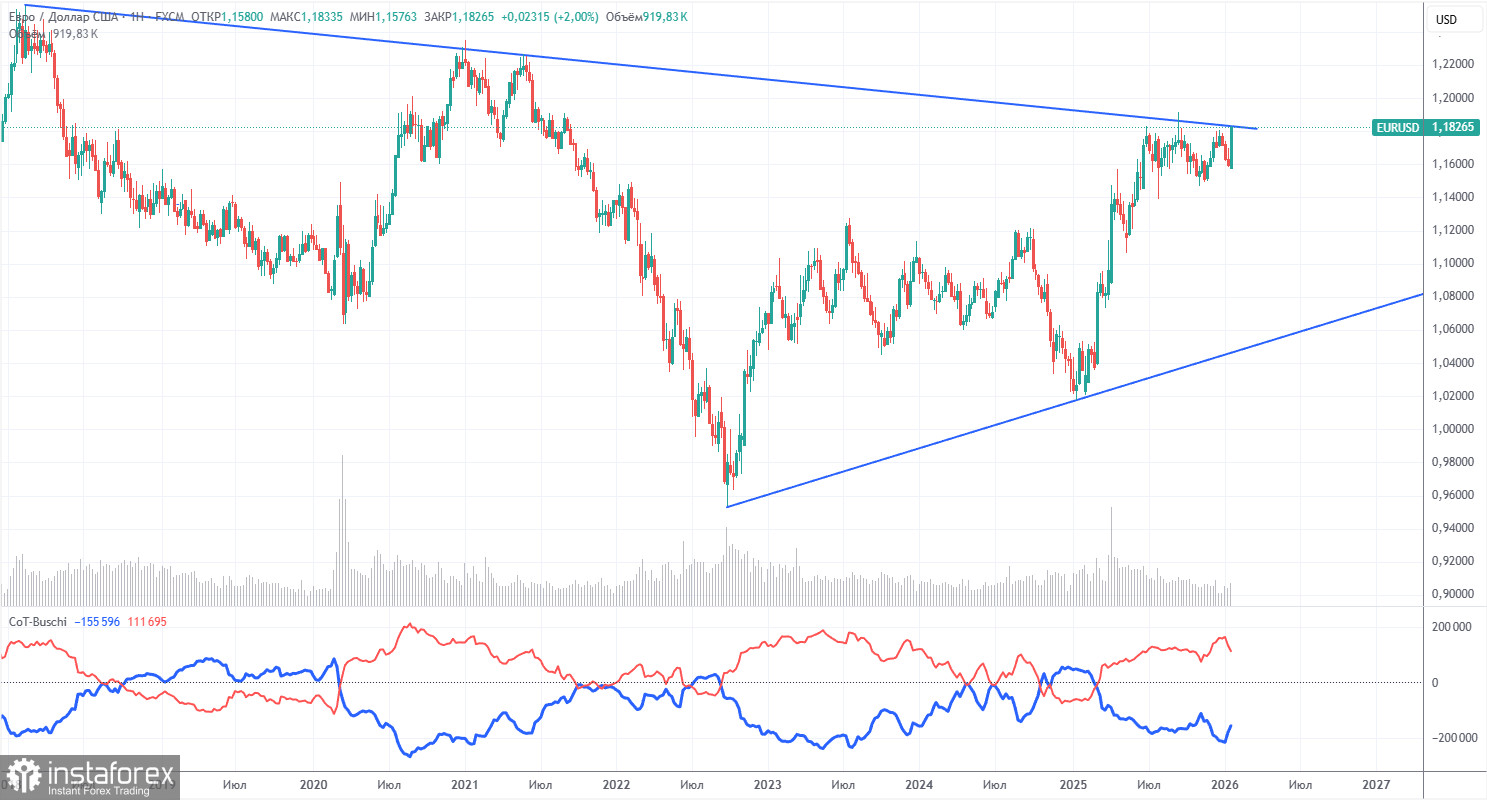
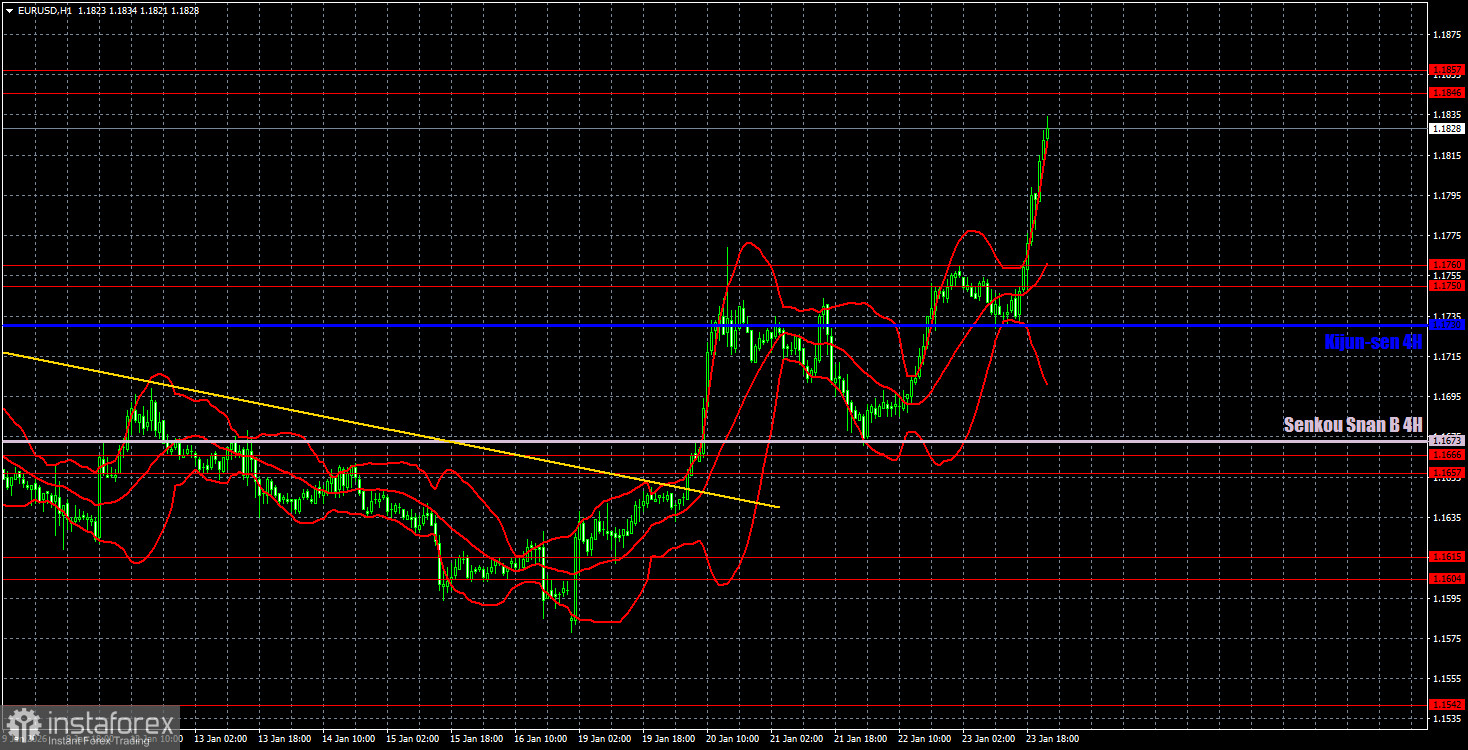
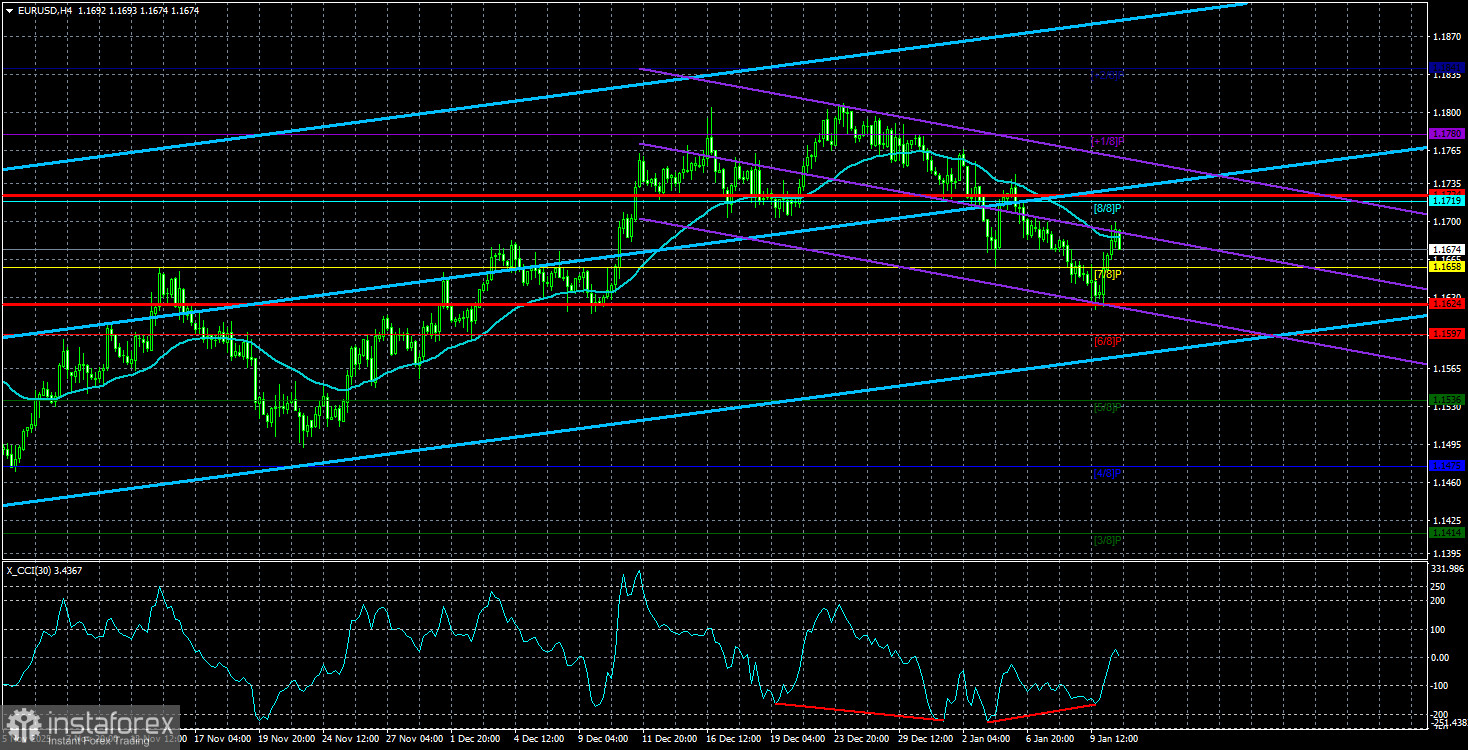
The average volatility of the EUR/USD pair over the past 5 trading days as of January 13 is 50 pips, which is characterized as "low." We expect the pair to move between 1.1624 and 1.1724 on Tuesday. The higher linear regression channel is upward, but in fact, the daily TF is still flat. The CCI indicator recently formed another "bullish" divergence, pointing to the resumption of the upward trend. However, the key point remains the flat on the daily TF. Nearest support levels: S1 – 1.1658 S2 – 1.1597 S3 – 1.1536 Nearest resistance levels: R1 – 1.1719 R2 – 1.1780 R3 – 1.1841 Trading recommendations: The EUR/USD pair remains below the moving average, but on all higher TFs the uptrend is preserved, and on the daily TF a flat continues for the sixth month in a row. The global fundamental background still matters greatly to the market, and it remains negative for the dollar. Over the past six months, the dollar has occasionally shown weak gains, but exclusively within a side channel. It has no fundamental basis for long-term strengthening. With the price below the moving average, small shorts can be considered, with targets at 1.1624 and 1.1597 on purely technical grounds. Above the moving average line, long positions remain relevant, with a target of 1.1830 (the upper line of the flat on the daily TF), which has already been reached and not overcome. Explanations of the illustrations: Linear regression channels help determine the current trend. If both are directed the same way, the trend is strong. The moving average line (settings 20,0, smoothed) indicates the short-term trend and the direction in which trading should proceed. Murray levels are target levels for moves and corrections. Volatility levels (red lines) indicate the likely price channel in which the pair will trade over the next 24 hours based on current volatility. CCI indicator — its entry into oversold territory (below -250) or overbought territory (above +250) signals an approaching trend reversal.

Analysis are provided by InstaForex.

Read more: https://ifxpr.com/49isdvU
IFX Bella
 
Posts: 605
Joined: Sat Dec 08, 2012 12:39 am

Re: Instaforex Analysis

Postby IFX Bella » Wed Jan 14, 2026 2:42 am

Forex Analysis & Reviews: Trading recommendations and trade review for EUR/USD on January 14. Convulsions continue

Analysis EUR/USD 5M


Image

The EUR/USD currency pair "came to its senses" on Tuesday. Recall that on Monday, the pair showed high volatility by current standards, but Tuesday demonstrated that it was a one-off. And it's not to say that there were no important events on Tuesday. For example, Donald Trump announced new 25% tariffs for all countries that trade with Iran, and in the US, an inflation report was published that is extremely significant for the Federal Reserve and monetary policy. Yes, the consumer price index showed a rather "bland" value that matched forecasts. But that value suggests that the Fed will not change the key rate in January. And for the dollar, a lack of new easing is positive news. But what difference does it make whether the news is positive or negative if the market continues to trade with 50-pip daily volatility? And that's the best case. Yesterday, for example, volatility was lower. The downtrend remains in force, as evidenced by the descending trendline, and the market continues to trade in a "convulsions" mode. And inside the sideways channel on the daily TF. Six months in a row. On the 5-minute TF for most of Tuesday, the price moved exclusively sideways in a 25-pip range. Total flat even intraday. Only during the US session did the market "wake up" and close below the 1.1657–1.1669 area, which, however, does not open any prospects for the dollar. Nevertheless, traders could have worked this sell signal and earned about 10–15 pips.

Image

The latest COT report is dated January 6. The illustration above clearly shows that the net position of non-commercial traders was bullish for a long time; bears struggled to gain the upper hand at the end of 2024 but quickly lost it. Since Trump took office for the second time, only the dollar has been falling. We cannot say that the decline of the US currency will continue with 100% probability, but current world events suggest that it will. The red and blue lines are diverging, indicating strong bull dominance. We still do not see any fundamental factors for the strengthening of the euro, while there remain plenty of factors for the US currency's decline. The global downtrend still persists, but what does it matter where the price moved over the last 17 years? Over the past three years, only the euro has been rising, and that is also a trend. The placement of the red and blue indicator lines continues to indicate the preservation and strengthening of the bullish trend. During the last reporting week, the number of longs in the "Non-commercial" group increased by 3,500, while shorts decreased by 1,800. Accordingly, the net position rose by another 5,300 contracts over the week.

Analysis EUR/USD 1H

Image

On the hourly timeframe, the EUR/USD pair continues forming a downtrend. Several weeks ago, the upper line of the sideways channel 1.1400–1.1830 was tested twice, but the euro failed to break out of it. Thus, technically, the pair's decline is logical. To count on euro growth and a new attempt to overcome the 1.1800–1.1830 area, one should at least wait for a break above the trendline. For January 14, we highlight the following levels for trading: 1.1234, 1.1274, 1.1362, 1.1426, 1.1542, 1.1604–1.1615, 1.1657–1.1666, 1.1750–1.1760, 1.1846–1.1857, 1.1922, 1.1971–1.1988, and also the Senkou Span B (1.1734) and Kijun-sen (1.1660) lines. Ichimoku indicator lines may shift during the day, which should be taken into account when determining trading signals. Don't forget to move a Stop Loss to breakeven if the price moves 15 pips in the favorable direction. This will protect against possible losses if the signal proves false. On Wednesday, no significant events are scheduled in the EU, while several less significant US reports will be released, such as PPI and retail sales. But what reaction should one expect to PPI if yesterday the reaction to the CPI report was only about 25 pips? Trading recommendations: On Wednesday, traders can trade from the 1.1657–1.1666 area and the Kijun-sen line. A close below this area would already have allowed opening short positions on Tuesday, targeting 1.1604–1.1615. Given current volatility, trades can be held open for several days. We would recommend considering long positions only after a break above the trendline. Explanations of the illustrations: Price support and resistance levels (resistance/support) — thick red lines near which movement may end. They are not sources of trading signals. Kijun-sen and Senkou Span B lines — Ichimoku indicator lines transferred to the hourly timeframe from the 4-hour. They are strong lines. Extremum levels — thin red lines from which the price previously bounced. They are sources of trading signals. Yellow lines — trend lines, trend channels, and any other technical patterns. Indicator 1 on the COT charts — the size of the net position of each trader category.

Analysis are provided by InstaForex.

Read more: https://ifxpr.com/4qSweNw
IFX Bella
 
Posts: 605
Joined: Sat Dec 08, 2012 12:39 am

Re: Instaforex Analysis

Postby IFX Bella » Thu Jan 15, 2026 3:02 am

Forex Analysis & Reviews: Overview of the GBP/USD pair. January 15. What is the essence of the Trump–Powell confrontation?

Image

The GBP/USD currency pair continued to trade more sideways than up or down on Wednesday. Although, unlike the euro, the pound sterling is not stuck in a flat for seven months, in recent weeks we have precisely observed a flat. The British pound does not want to fully emulate the euro, so from time to time it demonstrates more or less noticeable moves for form's sake. But few would deny the fact that volatility has fallen sharply in recent months for the GBP/USD pair. We continue to adhere to the same point of view as before. First of all, we want to note that one should not look for explanations where none exist. Many experts now constantly report on new plans by Trump to seize Greenland or stage a coup in Mexico, or to attack Iran. The media trumpet about a criminal investigation against Jerome Powell. Macroeconomic data on the US labor market, unemployment, and inflation have provided plenty of reasons for the market not to stand still. And no, none of these events are "empty" or secondary. But the problem is not that they are insignificant; it is that the market does not want to work them through. Recall that the market is people. If a Nonfarm Payrolls report comes out and you see a disastrous number, are you obliged to open a trade to sell the dollar? No. You may only do it if you want. The same applies to interbank trading. Whatever news comes from the US, no one is obliged in the literal sense to react to it immediately. Recall that the market often likes to price in events in advance, in anticipation. In some cases, it accumulates factors for future trends. If the pair made a fully logical, consistent move every time, everyone would make money in the market. The point is that the market works much more complexly, and it is run by people whose goal is to profit at others' expense. Let us return to the confrontation between Trump and Powell. It is no secret that the trial of Powell makes no sense insofar as Trump's influence on Fed monetary policy is concerned. So why is it needed? First, revenge. Powell ignored Trump's requests for eight years, and the US president is not the sort to forget slights. Second, as a lesson to other FOMC members. If every Fed official understands that today they will not vote for a rate cut and tomorrow they may receive a court summons for having crossed someone eight years ago, then the probability of dovish decisions will be much higher. Recall that Trump already "removed" Adriana Kugler, attempted to sack Lisa Cook, and now Jerome Powell is next. In the future, the same fate could befall any other FOMC member. As a result, Trump continues the war with the Fed until total victory or total defeat. There can be no other outcome in this confrontation.


Image

Average volatility of the GBP/USD pair over the last 5 trading days is 64 pips. For the pound/dollar pair, this value is "medium." On Thursday, January 15, we therefore expect movement within a range bounded by levels 1.3364 and 1.3500. The higher linear regression channel has turned upward, indicating trend recovery. The CCI indicator entered the oversold area 6 times over recent months and formed numerous "bullish" divergences, which have consistently warned traders of the continuation of the uptrend. Nearest support levels: S1 – 1.3428 S2 – 1.3306 S3 – 1.3184 Nearest resistance levels: R1 – 1.3550 R2 – 1.3672 R3 – 1.3794 Trading recommendations: The GBP/USD pair is trying to resume the 2025 uptrend, and its long-term prospects have not changed. Donald Trump's policies will continue to pressure the US economy, so we do not expect the US currency to strengthen. Thus, long positions with targets at 1.3550 and 1.3672 remain relevant in the near term as long as the price stays above the moving average. A price below the moving average line allows considering small shorts with a target of 1.3364 on technical grounds. From time to time, the US currency shows corrections (in the global sense), but for a trend to strengthen, it needs global positive factors. Explanations of the illustrations: Linear regression channels help determine the current trend. If both are directed the same way, the trend is strong. The moving average line (settings 20,0, smoothed) indicates the short-term trend and the direction in which trading should proceed. Murray levels are target levels for moves and corrections. Volatility levels (red lines) indicate the likely price channel in which the pair will trade over the next 24 hours based on current volatility. CCI indicator — its entry into oversold territory (below -250) or overbought territory (above +250) signals an approaching trend reversal.

Analysis are provided by InstaForex.

Read more: https://ifxpr.com/45FVpe0
IFX Bella
 
Posts: 605
Joined: Sat Dec 08, 2012 12:39 am

Re: Instaforex Analysis

Postby IFX Bella » Fri Jan 16, 2026 2:57 am

Forex Analysis & Reviews: Overview of the EUR/USD pair. January 16. One should not look for a black cat in a dark room

Image

The EUR/USD currency pair traded with minimal volatility on Thursday. In general, even in 2026, traders may have already become accustomed to this state of affairs. The euro continues to slip down slowly, very slowly, and the market pays no attention to fundamentals or macroeconomics. Most traders and even analysts regularly make the same mistake. They try to explain every move, every report, and every piece of news. But they forget that the market is not obliged to react to every report or news item, and that movements are not always "because of" something; they can be purely technical. We regularly say that a move is illogical if it contradicts fundamentals and macroeconomics. And that is also an absolutely normal situation for the FX market, because, once again, the market is ruled by market makers, and market makers are people. They are not obliged to process every report or every event. As a rule, these are large banks that can form long-term positions for months, causing minimal price fluctuations and illogical market moves. Therefore, we try to highlight the key factors for a certain period of time — the factors that work now, not those by which one can post-factum explain why we saw or did not see a particular move. For example, on Wednesday, January 14, the daily volatility was 25 pips, despite several US reports scheduled for that day and the fact that geopolitical news is delivered to traders practically every day. What is 25 pips? It is an absolute anti-record for recent years. Essentially, that figure means there were practically no moves in the market that day. Nevertheless, many experts continue to look for a black cat in a dark room that is not there. If the market is not reacting now to geopolitics, the criminal prosecution of Jerome Powell, or macroeconomic data (recall that we are talking about reports not only this week but last week as well), then the conclusion is only one — at the moment, the market does not react to news. The key factor for the current downward movement of the pair is only the flat on the daily TF. The flat has continued for seven months in a row. Now think: really, in the last seven months were there no important reports, events, central bank meetings, unexpected regulator decisions, geopolitical events that could have moved the pair off the spot for so long? Or is every successive event opposite in character to the previous one (seven months in a row!!!), so the price remains in one range? Thus, the current fall of the euro is not an increase in risk-off sentiment in the market, not a rise in demand for the "safe" dollar due to geopolitical tension, not a reaction to US macro data (especially since most reports failed). It is purely a technical move, minimal in strength, that began after the upper boundary of the daily sideways channel 1.1400–1.1830 was worked off.

Image

The average volatility of the EUR/USD pair over the last 5 trading days as of January 16 is 49 pips, which is characterized as "low." We expect the pair to move between 1.1561 and 1.1659 on Friday. The higher linear regression channel points upward, but in fact, the daily TF flatline still persists. The CCI indicator recently formed another "bullish" divergence, which again points to a resumption of the uptrend. However, the key point remains the daily TF flat. Nearest support levels: S1 – 1.1597 S2 – 1.1536 S3 – 1.1475 Nearest resistance levels: R1 – 1.1658 R2 – 1.1719 R3 – 1.1780 Trading recommendations: The EUR/USD pair remains below the moving average, but on all higher TFs the uptrend is preserved, and on the daily TF the flat has persisted for 7 months in a row. The global fundamental background still matters greatly to the market, and it remains negative for the dollar. Over the past six months, the dollar has occasionally shown weak gains, but exclusively within the sideways channel. It lacks a fundamental basis for long-term strengthening. With the price below the moving average, small shorts can be considered with targets 1.1561 and 1.1536 on purely technical grounds. Above the moving average line, long positions remain relevant, with a target of 1.1830 (the upper line of the daily TF flat), which has already been effectively worked and not overcome. Explanations of the illustrations: Linear regression channels help determine the current trend. If both are directed the same way, the trend is strong. The moving average line (settings 20,0, smoothed) indicates the short-term trend and the direction in which trading should proceed. Murray levels are target levels for moves and corrections. Volatility levels (red lines) indicate the likely price channel in which the pair will trade over the next 24 hours based on current volatility. CCI indicator — its entry into oversold territory (below -250) or overbought territory (above +250) signals an approaching trend reversal.

Analysis are provided by InstaForex.


Read more: https://ifxpr.com/4qOjOX0
IFX Bella
 
Posts: 605
Joined: Sat Dec 08, 2012 12:39 am

Re: Instaforex Analysis

Postby IFX Bella » Mon Jan 19, 2026 2:54 am

Forex Analysis & Reviews: How to trade the GBP/USD currency pair on January 19? Simple tips and trade review for beginners

Review of Friday's trades: 1H chart of the GBP/USD pair


Image

The GBP/USD pair also maintained a downward trend on Friday, though it did not show a noticeable decline during the day, and on Monday night, it even showed growth. Nevertheless, the pair continues to trade below the trendline, so there are no technical grounds to expect short-term growth of the British currency. On Friday, there were no major events in the UK, but traders don't need them right now anyway. A day earlier, two quite important and fairly positive reports were published in Great Britain — industrial production and monthly GDP — which had no effect on the pound. Thus, the pound's dynamics now depend more on the euro's movement, which in turn depends on the technical picture on the daily TF.

5M chart of the GBP/USD pair

Image

On the 5-minute TF, no trading signals were formed on Friday. Only at the market open on Monday did the price approach within an arm's reach of the 1.3319–1.3331 area, but it did not work it off. Thus, there are currently no relevant trading signals. How to trade on Monday: On the hourly TF, the GBP/USD pair continues forming a new downtrend, which is justified by only one factor — the euro's decline. There are no global grounds for the medium-term growth of the dollar, so we expect movement only to the north.

Overall, we also expect the resumption of the global 2025 uptrend, which could bring the pair to 1.4000 within the next couple of months. On Monday, beginner traders may consider short positions if the pair bounces off the 1.3437–1.3446 area with a target of 1.3319–1.3331. A bounce from the 1.3319–1.3331 area would allow opening long positions with a target of 1.3437–1.3446. On the 5?minute TF, you can trade using the levels 1.3043, 1.3096–1.3107, 1.3203–1.3212, 1.3259–1.3267, 1.3319–1.3331, 1.3437–1.3446, 1.3529–1.3543, 1.3574–1.3590, 1.3643–1.3652, 1.3682, 1.3763. No interesting reports or events are scheduled for Monday in the UK or the US. The day began with a sharp 45?pip rise, but it is unlikely that this dynamic will persist during the day.

Rather, today we will witness another "boring Monday." Main rules of the trading system: Signal strength is judged by the time required to form the signal (rebound or breakout). The less time required, the stronger the signal. If two or more trades were opened on false signals near a level, then all subsequent signals from that level should be ignored. In a flat, any pair can generate many false signals or none at all. In any case, at the first signs of a flat, it is better to stop trading. Trades are opened between the start of the European session and the middle of the American session; after that, all trades must be closed manually.

On the hourly timeframe, MACD-based signals should be traded only when there is good volatility and a trend confirmed by a trendline or trend channel. If two levels are located too close to each other (5–20 pips), they should be considered a support or resistance area. After the price moves 20 pips in the correct direction, set the stop loss to breakeven.

What is shown on the charts: Support and resistance price levels — levels that serve as targets when opening buys or sells. Take Profit can be placed near them. Red lines — channels or trendlines that reflect the current tendency and show which direction is preferable to trade now. MACD indicator (14,22,3) — histogram and signal line — an auxiliary indicator that can also be used as a source of signals. Important speeches and reports (always listed in the news calendar) can strongly affect a currency pair's movement. Therefore, during their release, trading should be done with maximum caution, or positions should be closed, to avoid a sharp price reversal against the preceding move. Beginner forex traders should remember that not every trade can be profitable. Developing a clear strategy and effective money management are the keys to long-term trading success.

Analysis are provided by InstaForex.


Read more: https://ifxpr.com/4b5TWBp
IFX Bella
 
Posts: 605
Joined: Sat Dec 08, 2012 12:39 am

Re: Instaforex Analysis

Postby IFX Bella » Tue Jan 20, 2026 3:40 am

Forex Analysis & Reviews: Trading recommendations and trade review for EUR/USD on January 20. The market reluctantly sells the dollar

Analysis EUR/USD 5M


Image

The EUR/USD currency pair showed restrained growth on Monday. The euro's rise, as a result of the US dollar's decline, could have been much stronger since there were sufficient reasons this time as well. Recall that in 2026, messages from Donald Trump arrive almost daily, indicating only one thing: a weaker dollar. Yet the dollar itself is not eager to fall, and the market is slow to sell it. The flat between 1.1400 and 1.1830 on the daily TF has persisted for seven months, so we still do not observe any trend moves or strong intraday movements. Currencies simply ignore most macro and fundamental information. Take, for example, yesterday. Donald Trump announced tariffs for the second time this year, but in both cases, the dollar saw virtually no drop. It appears the market is no longer very interested in a trade war. Even if that is true, the price remains flat for seven months. Thus, it seems the market is not very interested right now. We do not consider that the final conclusion — the problem lies only in the flat. On the hourly TF, a downtrend remains, as evidenced by the trendline. Only a break of that line will allow us to expect a rise back toward the 1.1800–1.1830 area. On the 5-minute TF, two buy signals were formed during the day, but overall volatility again did not exceed 50 pips. Thus, when any signal was worked out, traders could expect a maximum profit of about 20 pips.

COT Report

Image

The latest COT report is dated January 13. The illustration above clearly shows that the net position of non-commercial traders remains bullish. Since Trump took office for a second term, only the dollar has been falling. We cannot say the dollar's decline will continue with 100% probability, but current global developments point toward that scenario. The red and blue lines are diverging, which indicates a strong bullish advantage. We still do not see any fundamental factors that would strengthen the euro, but there are enough factors for the US dollar to fall. The global downtrend still persists, but what does it matter now, given that the price moved over the last 17 years? Over the past three years, only the euro has been rising, and that trend continues. The placement of the indicator's red and blue lines continues to indicate the preservation and strengthening of the bullish tendency. During the last reporting week, the number of longs among the "Non-commercial" group decreased by 14,600, while shorts increased by 15,500. Accordingly, the net position fell by 30,100 contracts over the week.

Analysis EUR/USD 1H

Image

On the hourly timeframe, EUR/USD continues to form a downtrend, within which it declines almost every day. Several weeks ago, the upper line of the 1.1400–1.1830 sideways channel was tested twice, but the euro was unable to break out of it. Thus, technically, the pair's decline is entirely natural. To expect euro growth and a new attempt to break the 1.1800–1.1830 area, one should wait for a break of the trendline on the hourly chart. For January 20, we highlight the following levels for trading: 1.1234, 1.1274, 1.1362, 1.1426, 1.1542, 1.1604–1.1615, 1.1657–1.1666, 1.1750–1.1760, 1.1846–1.1857, 1.1922, 1.1971–1.1988, as well as the Senkou Span B line (1.1692) and the Kijun-sen (1.1625). The Ichimoku indicator lines may move during the day, which should be taken into account when determining trading signals. Do not forget to move the stop loss to breakeven if the price moves 15 pips in the favorable direction. This will protect against potential losses if the signal turns out to be false. On Tuesday, the EU will publish secondary ZEW indices. If the market reacts to Trump's new tariffs and aggression toward the EU by only about 40 pips at best, what reaction should we expect to indices of business sentiment? In the US, the weekly ADP employment report will be released, but monthly reports are what matter for the dollar. Trading recommendations: On Tuesday, traders can trade from the 1.1657–1.1666 area or from the Kijun-sen line. A rebound from the line or area will allow opening short positions with a target of 1.1604–1.1615. Expecting a stronger move right now is unrealistic. A break above the 1.1657–1.1666 area will make longs relevant with a target at the Senkou Span B line. Explanations of the illustrations: Price support and resistance levels (resistance/support) — thick red lines near which movement may end. They are not sources of trading signals. Kijun-sen and Senkou Span B lines — Ichimoku indicator lines transferred to the hourly timeframe from the 4-hour. They are strong lines. Extremum levels — thin red lines from which the price previously bounced. They are sources of trading signals. Yellow lines — trend lines, trend channels, and any other technical patterns. Indicator 1 on the COT charts — the size of the net position of each trader category.

Analysis are provided by InstaForex.

Read more: https://ifxpr.com/4sTAq1q
IFX Bella
 
Posts: 605
Joined: Sat Dec 08, 2012 12:39 am

Re: Instaforex Analysis

Postby IFX Bella » Wed Jan 21, 2026 2:08 am

Forex Analysis & Reviews: Trading recommendations and trade review for EUR/USD on January 21. Donald Trump awakened the market

Analysis EUR/USD 5M


Image

The EUR/USD currency pair continued its upward movement on Tuesday, with the rally intensifying sharply throughout the day. We cannot say that any extra-important information became available to traders yesterday. Rather, the market realised the full danger of Donald Trump's new tariffs against the European Union. First, traders may have understood that Trump's intentions to seize Greenland are not a bluff or empty threats. Second, the new trade tariffs against the EU effectively nullify the 2025 trade deal. Third, this time Europe may respond not half-heartedly but proportionately, because it is now clear to everyone — don't play with Trump, he will bite off more than a finger. If Europe keeps jumping to please Washington, soon not only Greenland but a couple of other countries may be at stake. The market, which spent most of last year pricing in the trade war organised by Trump, began the new year the same way — by selling the dollar. These sales are entirely logical, and the weak fundamentals for the dollar are not limited to the new tariffs. True, the daily TF is still flat, but the hourly TF has broken the downtrend. That means the price can soon return to the 1.1800–1.1830 area. A sideways channel cannot hold the price inside it forever. On the 5-minute TF several very attractive signals were formed yesterday. As soon as the pair showed good volatility, profit followed — and decent profit at that. The first buy signal was formed at the very start of the European session, so traders could easily capitalise on it. Price broke the 1.1657–1.1666 area and later the Senkou Span B line. The target area of 1.1750–1.1760 was reached without difficulty, and the rebound from it was unambiguous. One buy trade yielded about 70–80 pips.

COT Report

Image

The latest COT report is dated January 13. The illustration above clearly shows that the net position of non-commercial traders remains bullish. Since Trump took office for the second time, only the dollar has been falling. We cannot say the dollar's decline will continue with 100% probability, but current global developments suggest this scenario. The red and blue lines are diverging, indicating strong bull dominance. We still do not see any fundamental factors that would strengthen the euro, while there are plenty that would weaken the dollar. The global downtrend still persists, but what does it matter now, given that the price moved over the last 17 years? Over the past three years, only the euro has been rising, and that trend is too. The positioning of the indicator's red and blue lines continues to indicate preservation and strengthening of the bullish trend. During the last reporting week, the number of longs in the "Non-commercial" group decreased by 14,600, while shorts increased by 15,500. Accordingly, the net position fell by 30,100 contracts over the week.

Analysis EUR/USD 1H

Image

On the hourly timeframe, EUR/USD broke the downtrend and began a rapid rise. The descending trendline has been overcome. In the near term, the euro may return to the upper line of the 1.1400–1.1830 sideways channel and, we hope, break out of this cursed area this time. The fundamental and macroeconomic backdrop continues to support a non-dollar bias. For January 21, we highlight the following levels for trading: 1.1234, 1.1274, 1.1362, 1.1426, 1.1542, 1.1604–1.1615, 1.1657–1.1666, 1.1750–1.1760, 1.1846–1.1857, 1.1922, 1.1971–1.1988, as well as the Senkou Span B (1.1692) and Kijun-sen (1.1673) lines. Ichimoku lines may move during the day, which should be taken into account when determining trading signals. Don't forget to move your Stop Loss to breakeven if the price has moved 15 pips in the right direction — this will protect against potential losses if the signal turns out to be false. On Wednesday, there are no major events scheduled in the EU or the US, except for remarks by Christine Lagarde. Lagarde may again comment on Trump's geopolitical ambitions in the Arctic and on possible EU countermeasures to US tariffs. Trading recommendations: On Wednesday, traders can trade from the 1.1750–1.1760 area. A rebound from this area will allow opening short positions with a target of 1.1692. A break above the 1.1750–1.1760 area will make longs relevant with targets of 1.1800–1.1830. Explanations of the illustrations: Price support and resistance levels (resistance/support) — thick red lines near which movement may end. They are not sources of trading signals. Kijun-sen and Senkou Span B lines — Ichimoku indicator lines transferred to the hourly timeframe from the 4-hour. They are strong lines. Extremum levels — thin red lines from which the price previously bounced. They are sources of trading signals. Yellow lines — trend lines, trend channels, and any other technical patterns. Indicator 1 on the COT charts — the size of the net position of each trader category.

Analysis are provided by InstaForex.

Read more: https://ifxpr.com/4quVWHY
IFX Bella
 
Posts: 605
Joined: Sat Dec 08, 2012 12:39 am

Re: Instaforex Analysis

Postby IFX Bella » Thu Jan 22, 2026 3:07 am

Forex Analysis & Reviews: Overview of the EUR/USD pair. January 22. The European Union risks losing trust and sovereignty

Image

The EUR/USD currency pair continued to trade higher on Wednesday. Overall, there is no need to search long for the reasons. Since the start of the week, the market has been reacting to a single event — the new trade confrontation between Trump and the European Union, which began against the backdrop of Trump's claims on the island of Greenland, which belongs to Denmark. As of yesterday, nothing has changed, and even on Tuesday, there was no significant news on this topic. However, the market has sold the US dollar for three days in a row, and it is absolutely justified.

In our view, it is completely irrelevant how and with what outcome the "Battle for Greenland" ends. It is quite possible that there will be no battle at all. Already, some European officials are ready to hand over the Danish island to avoid spoiling relations with Trump and new tariffs. Attitudes toward such a stance may vary. On the one hand, Greenland is not particularly needed by Denmark and, even more so, by the EU. Today, Trump deemed it necessary to seize Greenland; tomorrow, he may deem it necessary to take entire countries under his control. This is not a joke: last year, the US president demanded that Canada join the United States. And when refused, he responded with tariffs. Therefore, to put it as simply as possible, without political epithets, Brussels itself seems not to understand what it is doing. It has two paths.

The first is escalation — responding blow for blow. If Trump imposes new tariffs and threatens to seize Greenland by force, then Brussels must respond in kind. Only then will the world respect Europe. The second is de-escalation — another truce and an attempt to negotiate. Europe could strike a deal with Trump under which it would avoid higher trade tariffs but cede a huge part of its territory. It does not matter on paper who it remains with. If Trump begins to build military bases there, develop mineral resources and oil, Europeans will have nothing to do there, neither now nor in 50 years. As for the currency market's reaction to what is happening in 2026, we, as before, believe the dollar will only fall. It does not matter which path Europe chooses in the fight for its territories. Even if the conflict ends peacefully, investors will continue to divest from US assets.

Of course not massively and not panically, but they will. And the EU is one of the largest creditors of the US. The dollar will also remain out of favor with traders because the level of uncertainty under Trump is off the charts. Another confrontation with the EU, with which a trade deal was concluded last year, is by far not the only factor putting pressure on the US currency. Throughout Trump's first year in office, the list of reasons for the dollar's decline has only grown. Therefore, we continue to expect only an increase in the EUR/USD pair.

Analysis are provided by InstaForex.

Read more: https://ifxpr.com/4sO3ozP
IFX Bella
 
Posts: 605
Joined: Sat Dec 08, 2012 12:39 am

Re: Instaforex Analysis

Postby IFX Bella » Fri Jan 23, 2026 2:34 am

Forex Analysis & Reviews: EUR/USD Review. January 23. The King Forgives the European Union

Image

The EUR/USD currency pair maintained an upward trend throughout Thursday. It is very good that the bulls did not back down from their intentions after Trump issued another pardon. At the moment, there is little official, verified, and confirmed information available. During the forum in Davos (where he, by the way, arrived late, but the king can do that), Donald Trump stated that he reached agreements regarding Greenland with NATO Secretary General Mark Rutte. And we are left with one question: since when does Secretary General Rutte have jurisdiction over Danish territories? There are several possible answers to this. Rutte may have discussed potential locations for U.S. military bases and air defense systems on the island of Greenland that do not contradict NATO standards with Donald Trump. Since Denmark is a NATO member, this option seems quite logical and fair. However, if that is the case, then why was Trump insisting on buying the entire island? What stopped him from simply negotiating with the Europeans about placing military bases on it? Especially since Europe and the U.S. are NATO allies. The second option is that Trump agreed to anything with Rutte, but Copenhagen knows nothing about it, and Brussels will simply block the deal. In our view, Trump wants to acquire the huge island for geopolitical purposes while also establishing control over all natural resources, which are surely worth hundreds of billions of dollars beneath the snowy territory. That is why he offers a million dollars to each resident of Greenland if they vote for joining the U.S. in a referendum (who will allow this referendum to happen?). What does 75 billion mean for America? This is exactly why Trump insists on purchasing the island rather than just leasing it for various military facilities. To place even 10 military bases, an area of 2.166 million square kilometers is clearly not needed. Thus, first of all, there is no official information about the agreements, and secondly, we highly doubt that the matter has been resolved so easily and simply. However, Trump has canceled his decision to implement additional tariffs on the EU and the UK countries, effective February 1. According to him, the agreement regarding Greenland has been reached, so the tariffs are no longer necessary. Remember? "Trump always chickens out." Of course, not always in practice, but quite often. Trump clearly calculates all possible moves and the consequences of any of his actions. Or perhaps, it is not just him who calculates but a whole team of analysts, economists, and political scientists. If "the juice is worth the squeeze," then Trump makes a forward move. If potentially his next initiative may cause far more losses than gains, Trump... bluffs. Imagine a simple situation. Trump threatens to raise tariffs by 500% on China if it does not cease its attempts to take over Taiwan. If Beijing is scared, great. If not, well, that's okay. China won't be intimidated; the European Union or some smaller "fish" might be.

Image

The average volatility of the EUR/USD currency pair over the last five trading days as of January 23 is 81 pips, which is considered "average." We expect the pair to trade between 1.1664 and 1.1826 on Friday. The higher linear regression channel is directed upward, but in fact, a flat has still been in place on the daily timeframe. The CCI indicator has entered the oversold area this week, indicating a downward pullback that may already be complete. The key point remains the flat on the daily timeframe. Nearest support levels: S1 – 1.1719 S2 – 1.1658 S3 – 1.1597 Nearest resistance levels: R1 – 1.1780 R2 – 1.1841 Trading Recommendations: The EUR/USD pair remains below the moving average, but on all higher timeframes the upward trend persists, while the flat has persisted on the daily timeframe for 7 months. The global fundamental backdrop remains highly significant for the market and remains negative for the dollar. Over the past six months, the dollar has occasionally shown weak growth, but exclusively within the sideways channel. For long-term strengthening, it lacks a fundamental basis. With the price situated below the moving average, small short positions can be considered with targets at 1.1597 and 1.1536 on purely technical grounds. Above the moving average line, long positions remain relevant with a target of 1.1830 (the upper line of the flat on the daily timeframe). Explanations of the illustrations: Linear regression channels help determine the current trend. If both are directed the same way, the trend is strong. The moving average line (settings 20,0, smoothed) indicates the short-term trend and the direction in which trading should proceed. Murray levels are target levels for moves and corrections. Volatility levels (red lines) indicate the likely price channel in which the pair will trade over the next 24 hours based on current volatility. CCI indicator — its entry into oversold territory (below -250) or overbought territory (above +250) signals an approaching trend reversal.

Analysis are provided by InstaForex.

Read more: https://ifxpr.com/4qBJaHK
IFX Bella
 
Posts: 605
Joined: Sat Dec 08, 2012 12:39 am

Re: Instaforex Analysis

Postby IFX Bella » Mon Jan 26, 2026 2:23 am

Forex Analysis & Reviews: Trading Recommendations and Trade Analysis for EUR/USD on January 26. The Total Collapse of the Greenback

EUR/USD 5M Analysis


Image

The EUR/USD currency pair soared on Friday but... remained within the sideways channel on the daily timeframe of 1.1400-1.1830. The European currency has been trading in this channel for 7 months, closing Friday at 1.1828. Thus, the pair is currently undergoing another test of the upper boundary of the sideways channel. We believe that this week's movements will depend 90% on technical factors. If the area between 1.1800 and 1.1830 is breached, the upward movement will continue regardless of the fundamental and macroeconomic backdrop. Moreover, the market has been paying little attention to economic reports lately. If a rebound occurs from the area of 1.1800-1.1830, we should expect a new round of decline within the sideways channel. On Friday, a considerable amount of diverse reports was published in the Eurozone, Germany, and the US. Now, take a look at the charts of the pair. Do you get the feeling that the pair's growth of 100 pips was provoked by any report? First of all, the growth began during the American trading session. During the European trading session, volatility was minimal, and prices traded sideways. Thus, the entire morning statistical package was completely ignored. In the second half of the day, the U.S. S&P business activity indices were slightly weaker than forecasts (and could hardly trigger a 1-cent drop in the dollar within a few hours), while the consumer sentiment index from the University of Michigan showed a positive value (and, consequently, could also not provoke a drop in the dollar). On the 5-minute timeframe, two trading signals were formed on Friday. The first was formed in the morning, and this was the only trade that traders could open. The price bounced twice off the Senkou Span B line, then began a sustained upward move. By the end of the day, the pair managed to gain about 60 pips, which traders could comfortably pocket.

COT Report

Image

The latest COT report is dated January 20. The illustration above clearly shows that the net position of non-commercial traders remains "bullish." Since Trump took office as president of the United States for the second time, only the dollar has been falling. We cannot say that the decline of the American currency will continue with 100% probability, but the current developments in the world suggest this possibility. We still do not see any fundamental factors for the strengthening of the European currency, but there are enough factors for the decline of the American currency. The global downward trend still persists, but what difference does it make where the price has moved in the last 18 years? A new upward trend has been forming over the past three years, and in the coming weeks, the price could break the global descending trendline, confirming further long-term growth. The positioning of the red and blue lines in the indicator continues to indicate the maintenance and strengthening of the "bullish" trend. Over the last reporting week, the number of longs for the "Non-commercial" group decreased by 8,400, while the number of shorts increased by 12,600. Consequently, the net position fell by 21,000 contracts over the week.

EUR/USD 1H Analysis

Image

On the hourly timeframe, the EUR/USD pair continues to form a local upward trend and is currently near the upper boundary of the sideways channel of 1.1400-1.1830. Thus, the fate of the pair for the coming weeks and months will be determined soon. Either the flat will continue, or the global upward trend will resume. The fundamental and macroeconomic background continues to support not the dollar. For January 26, we highlight the following trading levels—1.1234, 1.1274, 1.1362, 1.1426, 1.1542, 1.1604-1.1615, 1.1657-1.1666, 1.1750-1.1760, 1.1802-1.1830, 1.1922, 1.1971-1.1988, as well as the Senkou Span B line (1.1673) and Kijun-sen line (1.1730). The Ichimoku indicator lines may move throughout the day, which should be taken into account when determining trading signals. Don't forget to set a Stop Loss order to break even if the price moves in the correct direction by 15 pips. This will protect against potential losses if the signal turns out to be false. On Monday, there are no important events or reports scheduled in the UK, while the U.S. will release a relatively important report on durable goods orders, which may reflect in the charts. Trading Recommendations: On Monday, traders can trade in the 1.1800-1.1830 range. Since the effective level of 1.1830 has been reached, trading can be done specifically from this level rather than the entire area. A rebound from this level will allow for new short positions with a target of 1.1750-1.1760. A consolidation above 1.1830 will make longs targeting 1.1922 relevant. Explanations for the Illustrations: Price support and resistance levels (resistance/support) — thick red lines near which movement may end. They are not sources of trading signals. Kijun-sen and Senkou Span B lines — Ichimoku indicator lines transferred to the hourly timeframe from the 4-hour. They are strong lines. Extremum levels — thin red lines from which the price previously bounced. They are sources of trading signals. Yellow lines — trend lines, trend channels, and any other technical patterns. Indicator 1 on the COT charts — the size of the net position of each trader category.

Analysis are provided by InstaForex.

Read more: https://ifxpr.com/3O3woU0
IFX Bella
 
Posts: 605
Joined: Sat Dec 08, 2012 12:39 am

PreviousNext

Return to Forex Brokers