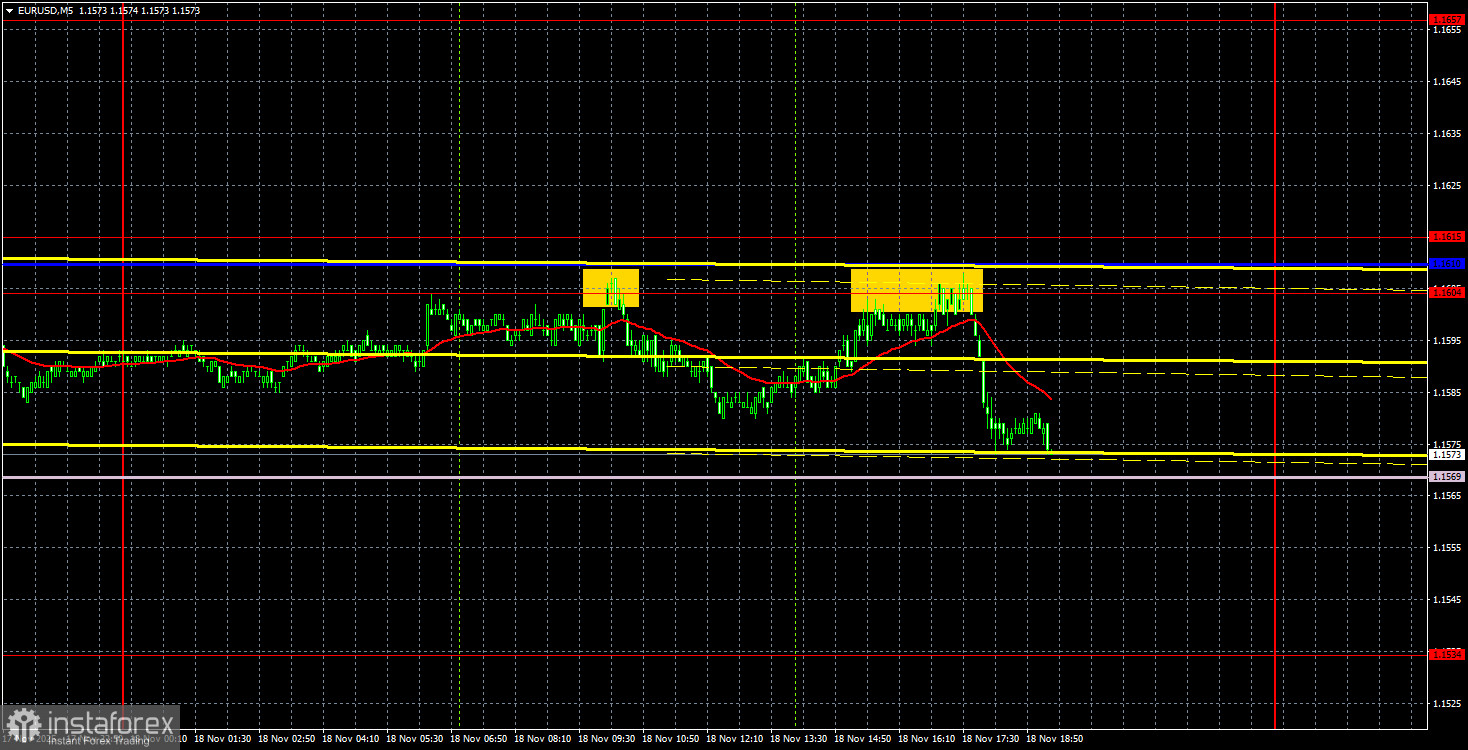
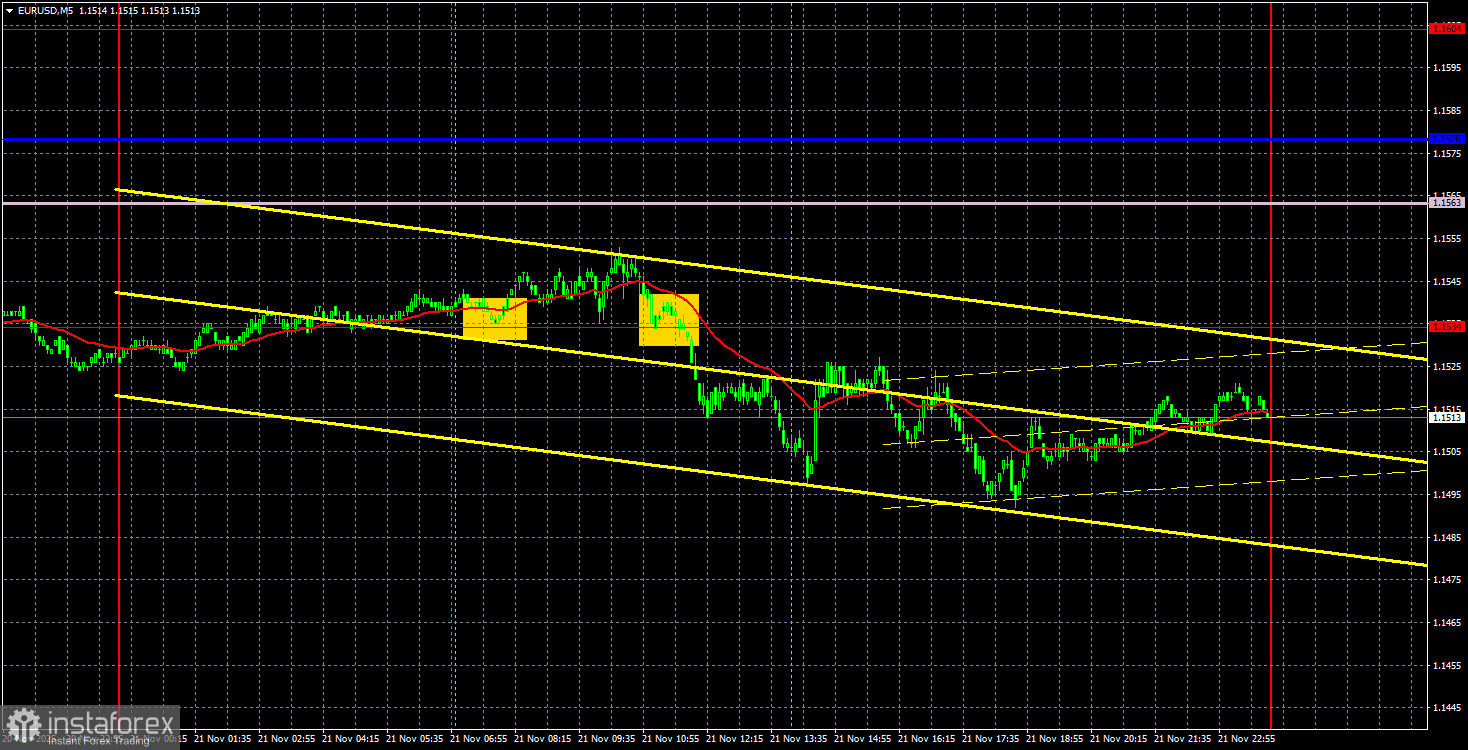
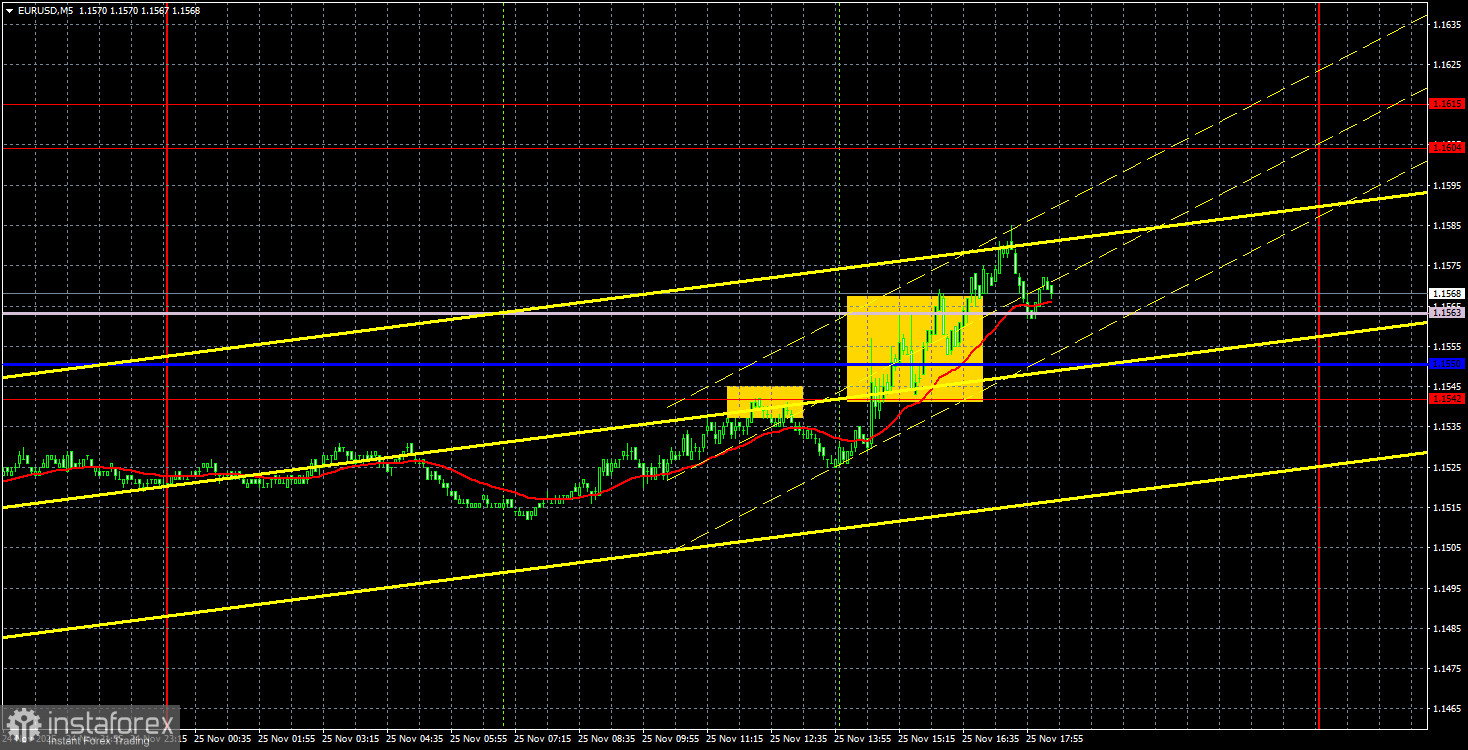
Analysis of EUR/USD 5M
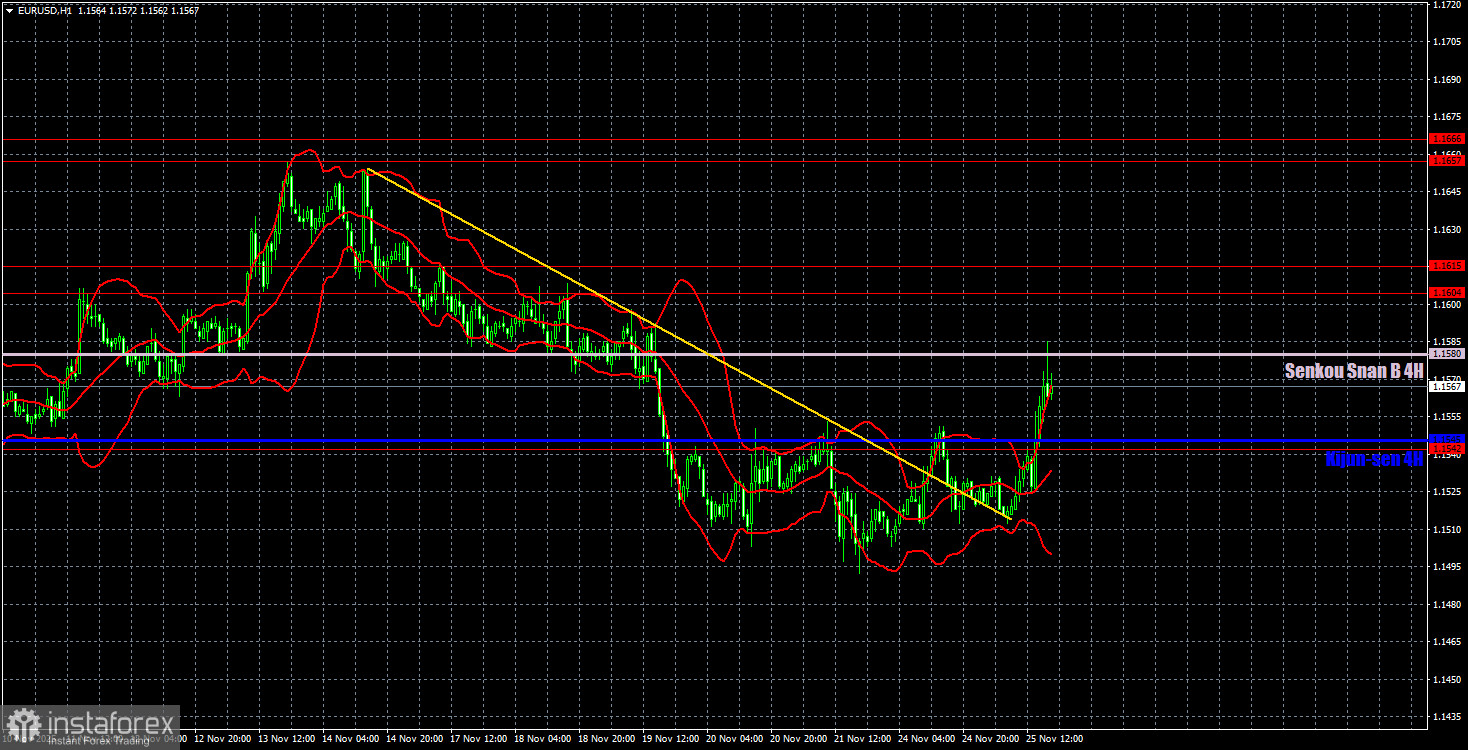
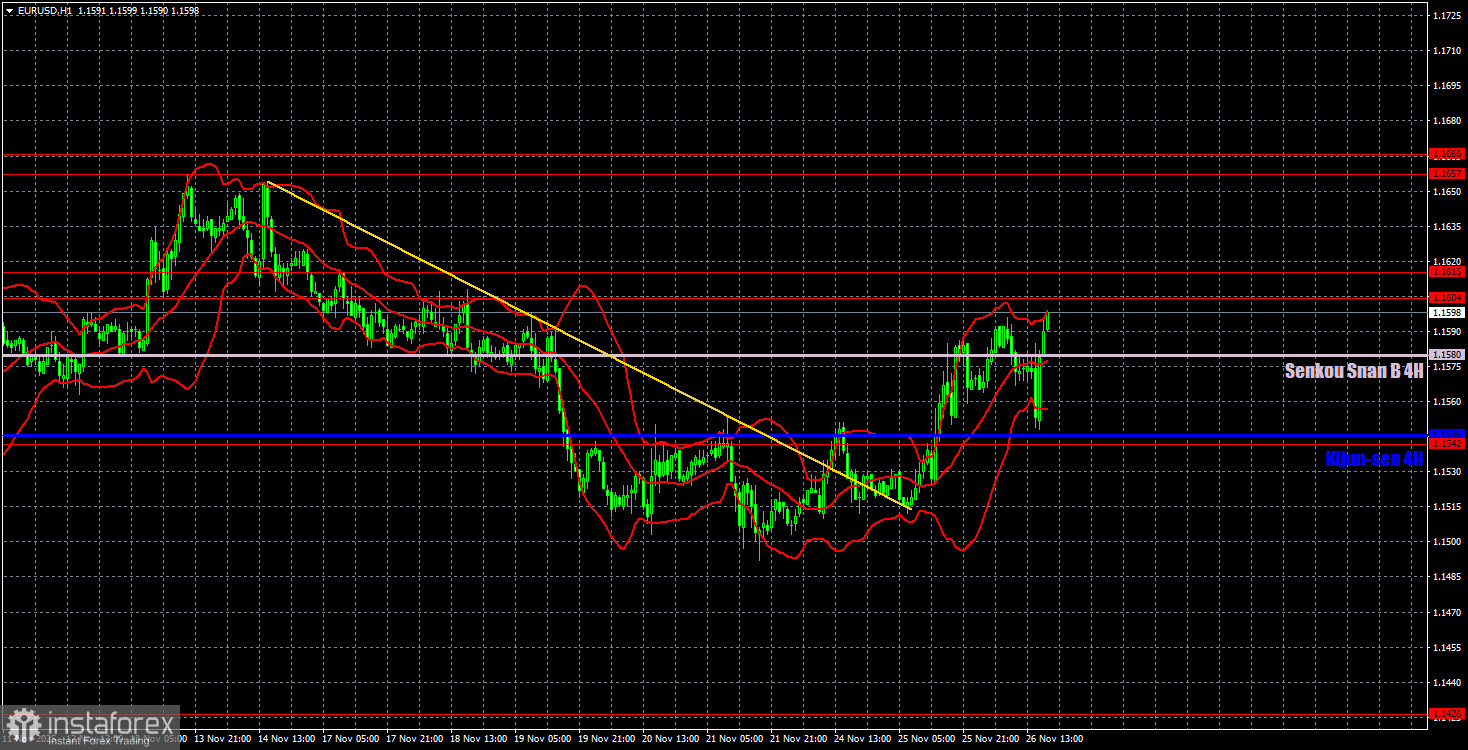
On Monday, the EUR/USD currency pair saw a minor pullback. Over the past week and a half, the euro has been slowly but steadily rising, recovering from the unjustified decline of the previous one-and-a-half months. Therefore, a minor correction within the local upward trend would not be detrimental. However, it is essential to note that the concept of trend is quite conditional, even on the hourly timeframe. The daily chart continues to show a global flat that has persisted for three months. Thus, any internal movement is a correction against a correction against a correction. The ascending trend on the hourly timeframe remains intact, as the price continues to stay above the Senkou Span B line. There is no clear trend line at the moment, but one could be constructed from the current correction. The fundamental and macroeconomic backdrop was absent on Monday, which once again explains the market's low volatility. The most important macroeconomic data in the U.S. is still not being published, and all other reports for the week are not significant under the current circumstances. The market is focused on what decision the Fed will make in December. To answer this question, statistics on the labor market and unemployment are needed. On the 5-minute timeframe, we see that for most of Monday, the pair traded sideways between the Kijun-sen line and the 1.1615 level. During the American trading session, the price consolidated below the Kijun-sen line; however, was it worth opening trades with such low volatility and with the Senkou Span B line 30 pips below?
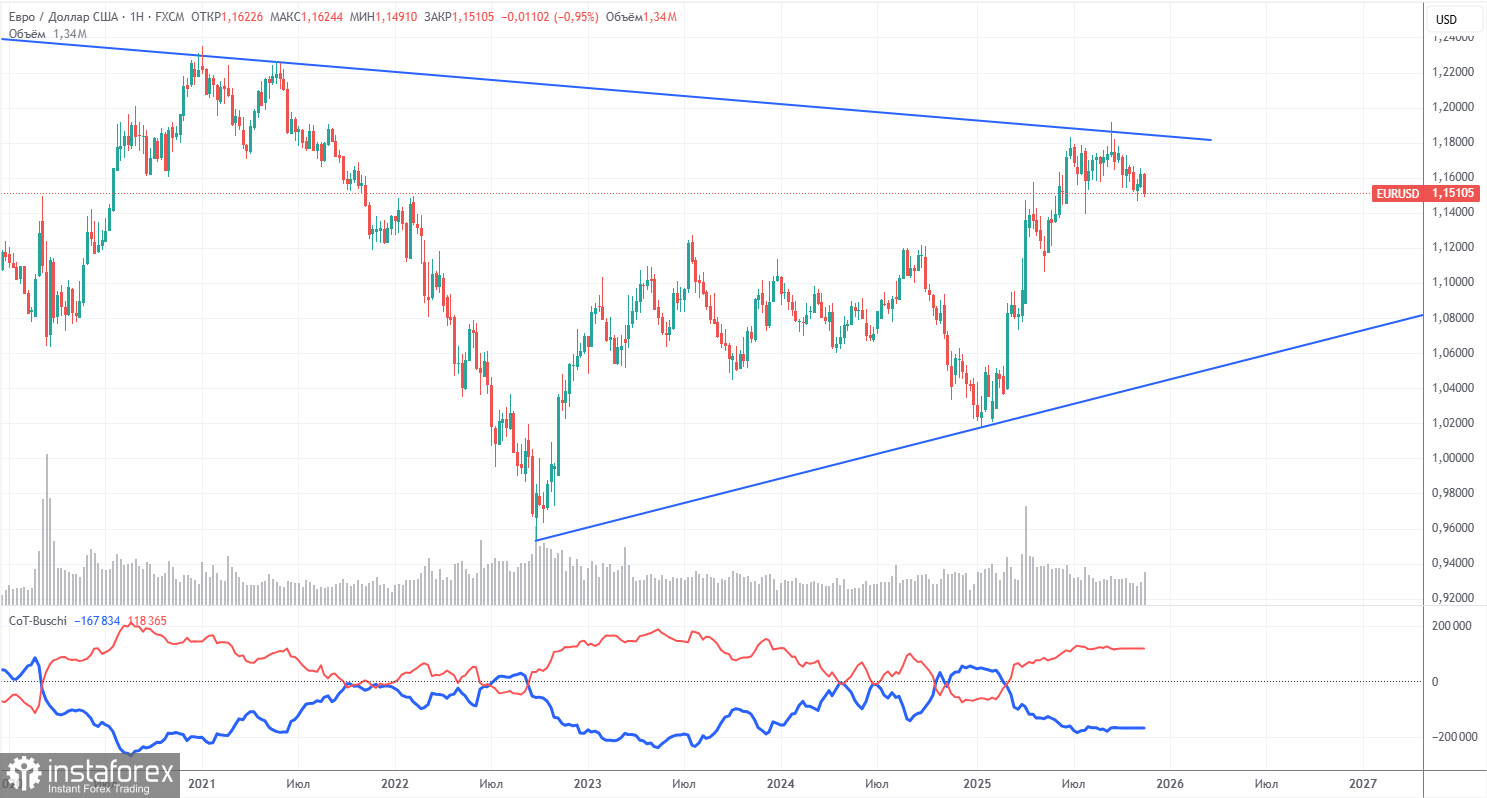
COT Report
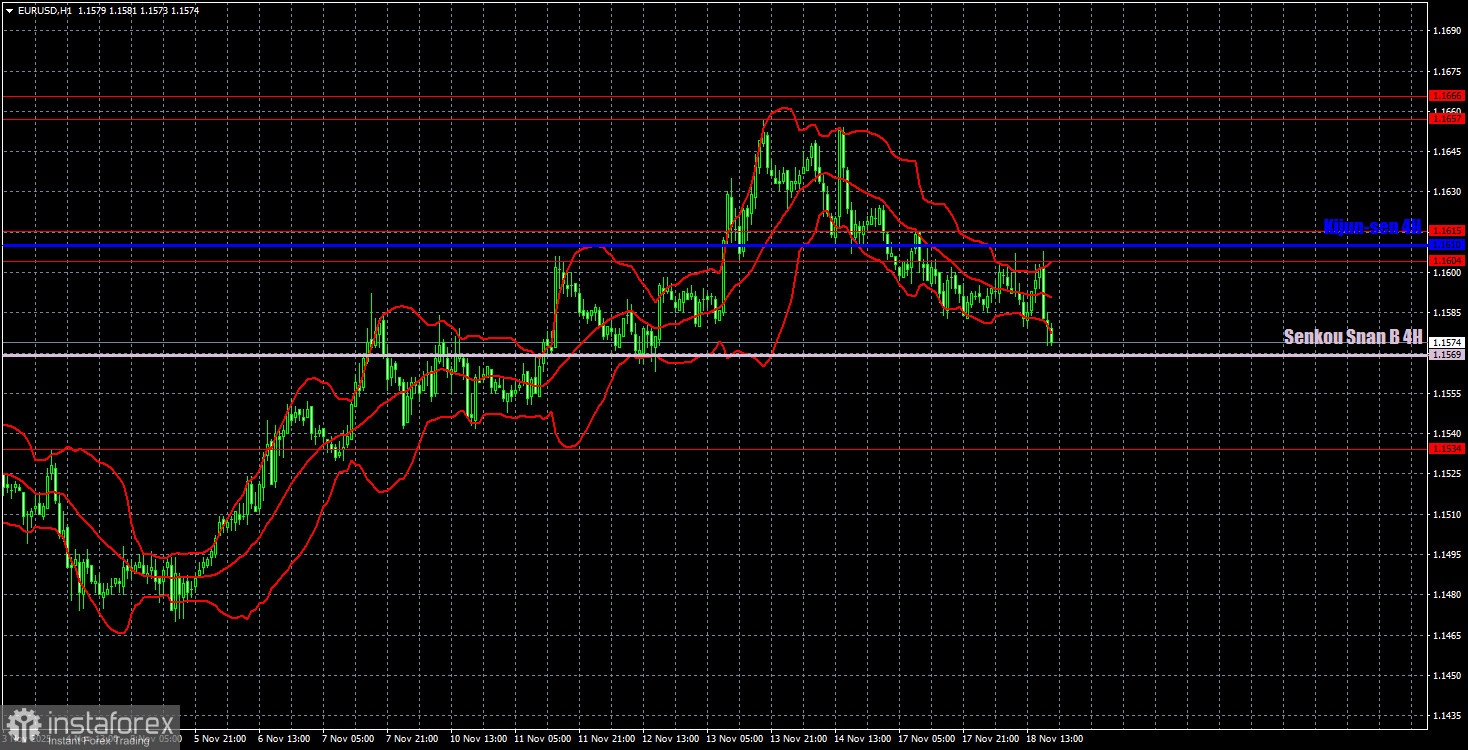
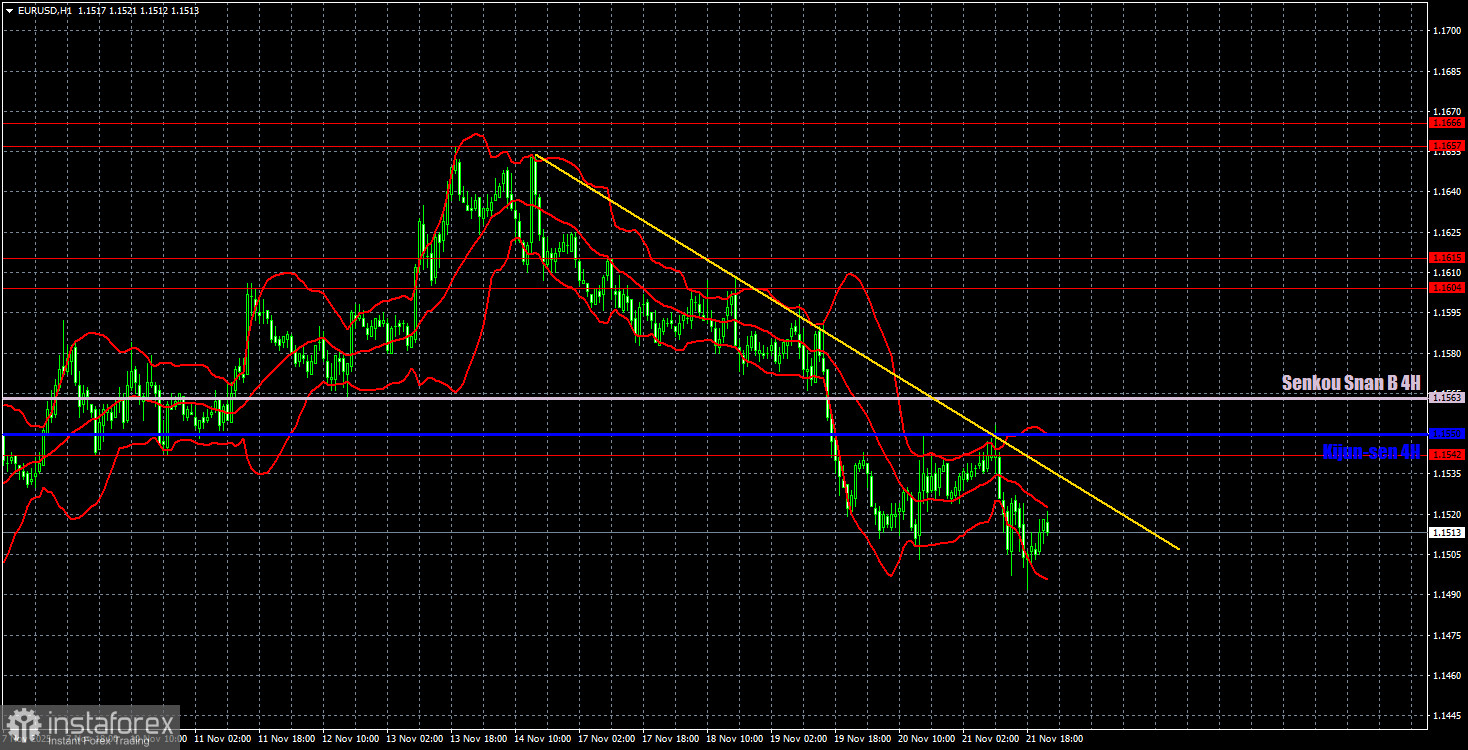
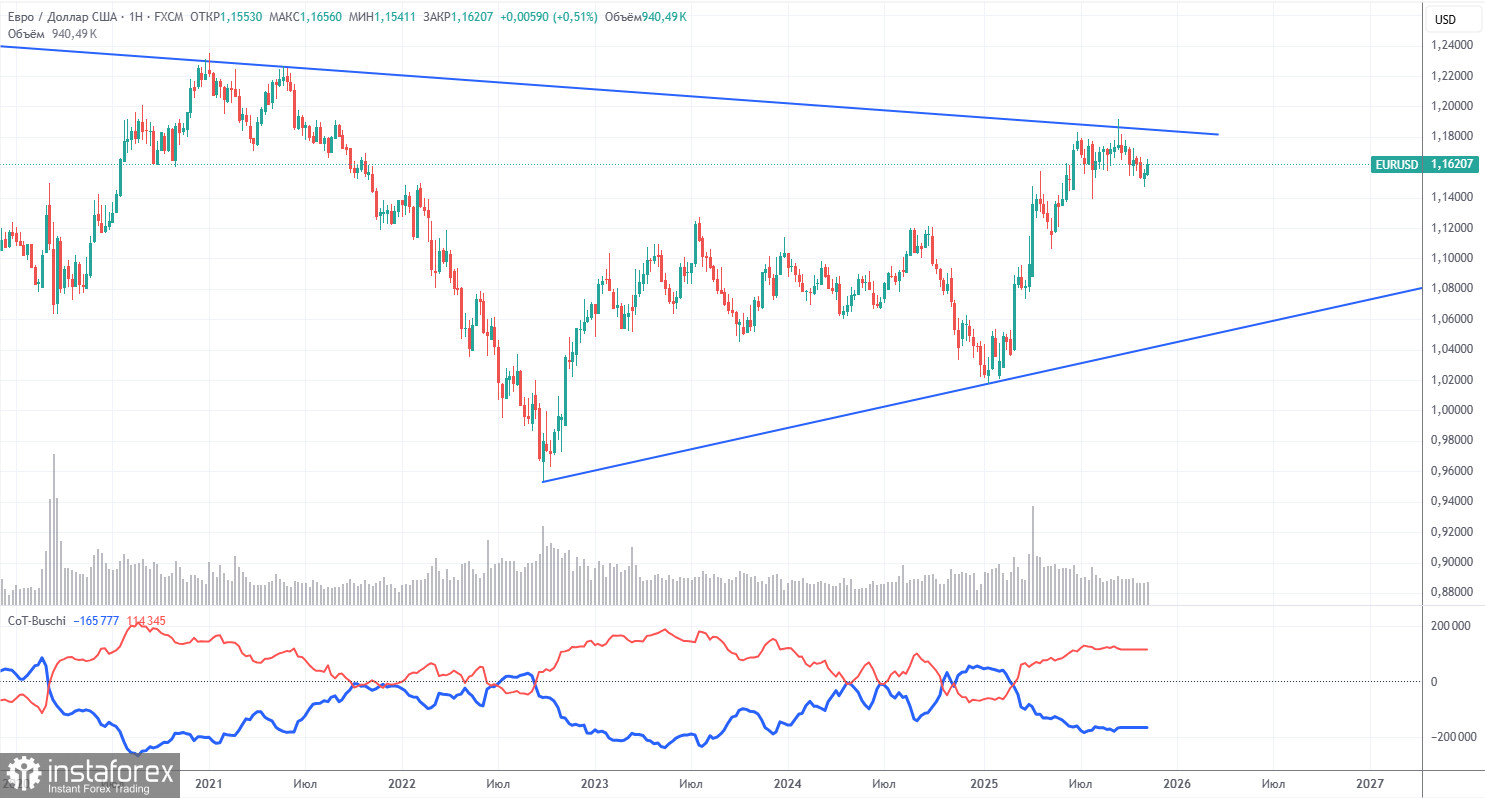
The latest COT report is dated September 23. Since then, no further COT reports have been published due to the U.S. "shutdown." In the illustration above, it is clear that the net position of non-commercial traders has long been "bullish," with bears struggling to gain the upper hand at the end of 2024 but quickly losing it. Since Trump took office for a second term as President of the U.S., the dollar has been falling. We cannot assert that the decline of the American currency will continue with 100% probability, but current world events suggest that this may be the case. We still do not see any fundamental factors that would strengthen the euro, while there remain sufficient factors that would weaken the dollar. The global downtrend is still ongoing, but what difference does it make where the price moved in the last 17 years? Once Trump concludes his trade wars, the dollar may start to rise, but recent events indicate that the war will continue in one form or another for a long time yet. The position of the red and blue lines of the indicator continues to indicate the preservation of a "bullish" trend. During the last reporting week, the number of long positions in the "Non-commercial" group decreased by 800, while the number of shorts increased by 2,600. Consequently, the net position decreased by 3,400 contracts over the week. However, this data is already outdated and holds no significance. Analysis of EUR/USD 1H
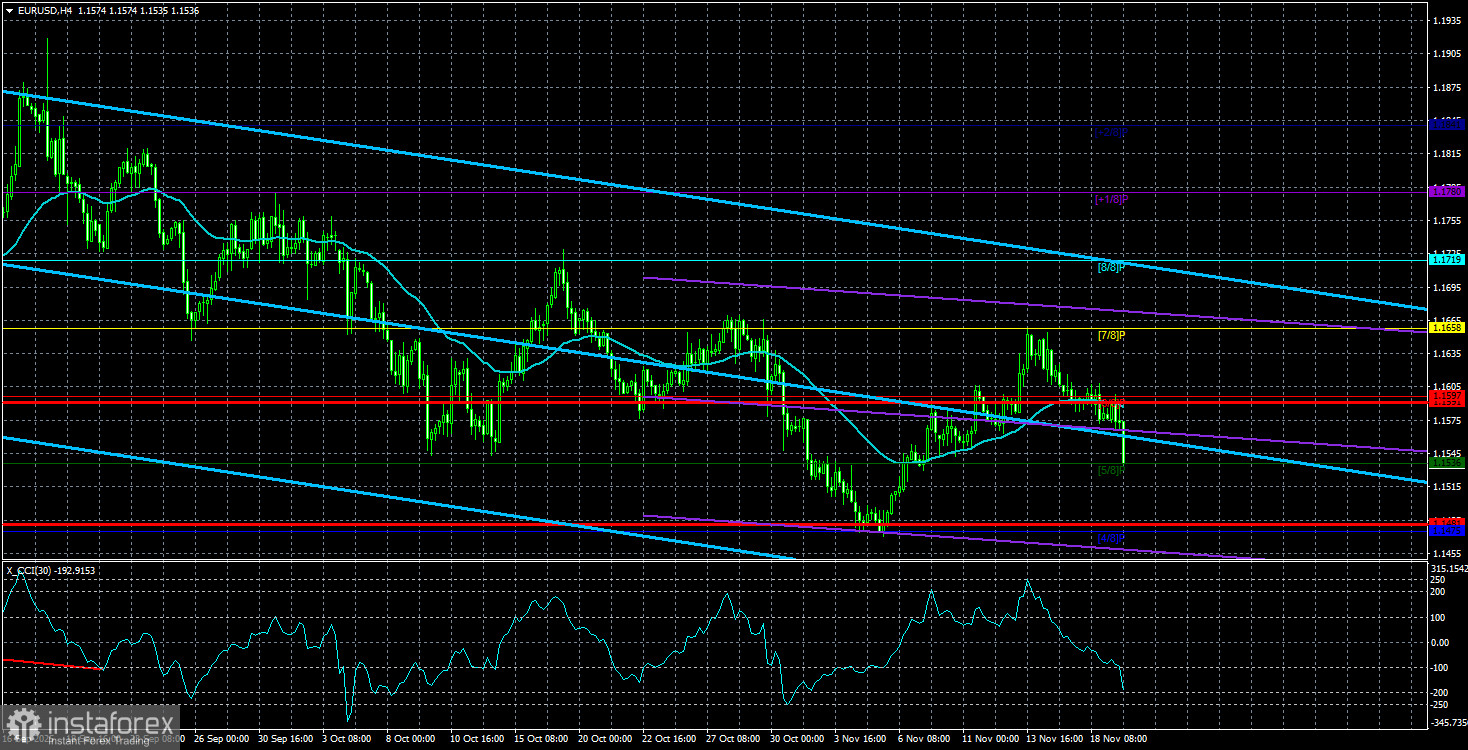
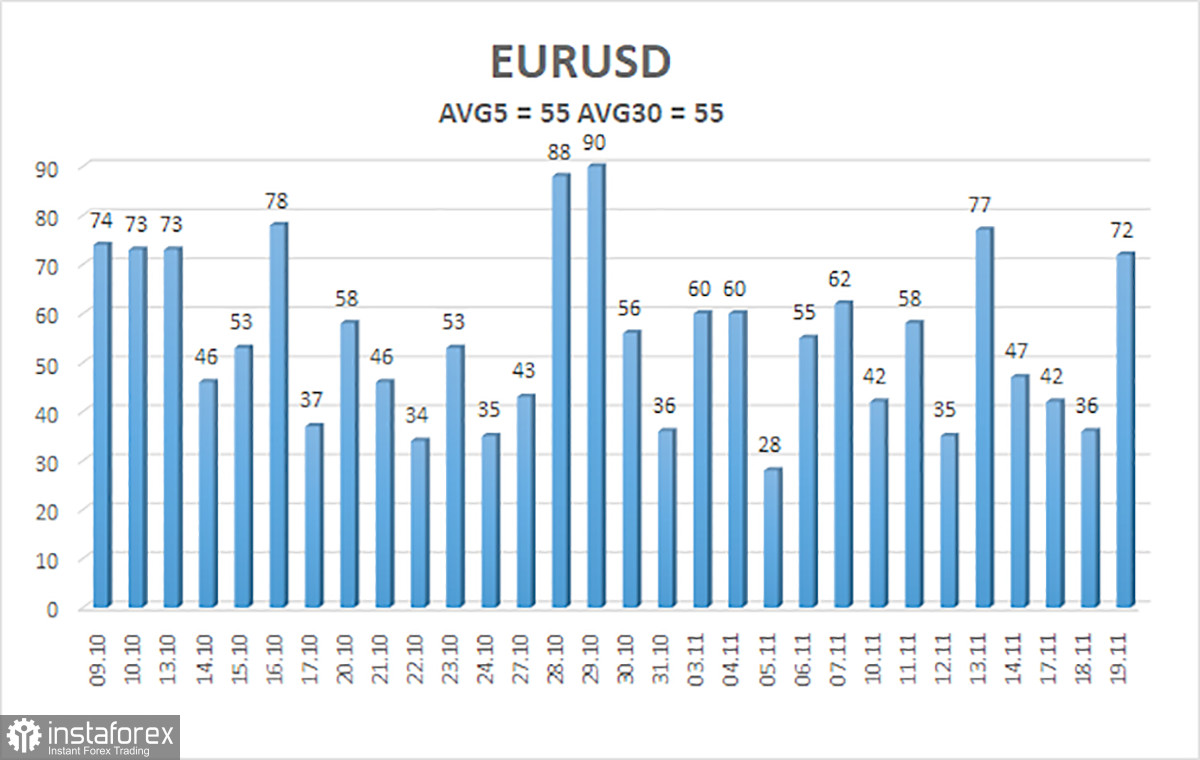
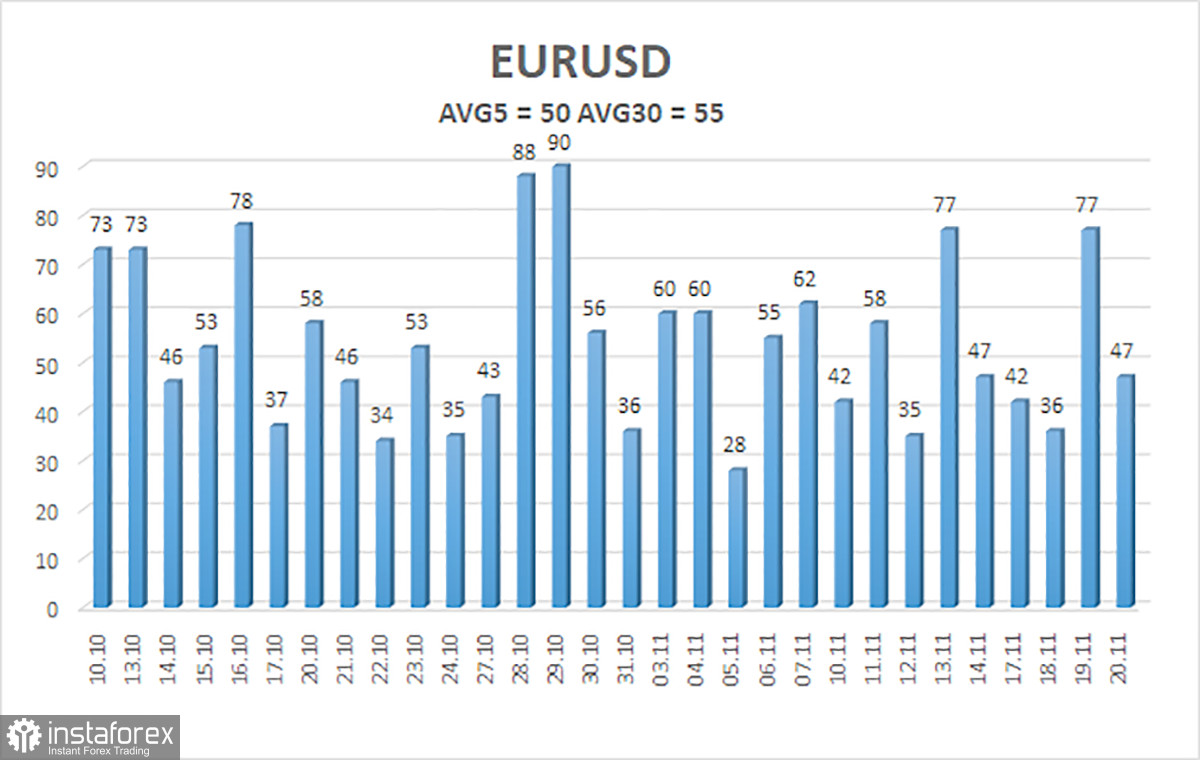
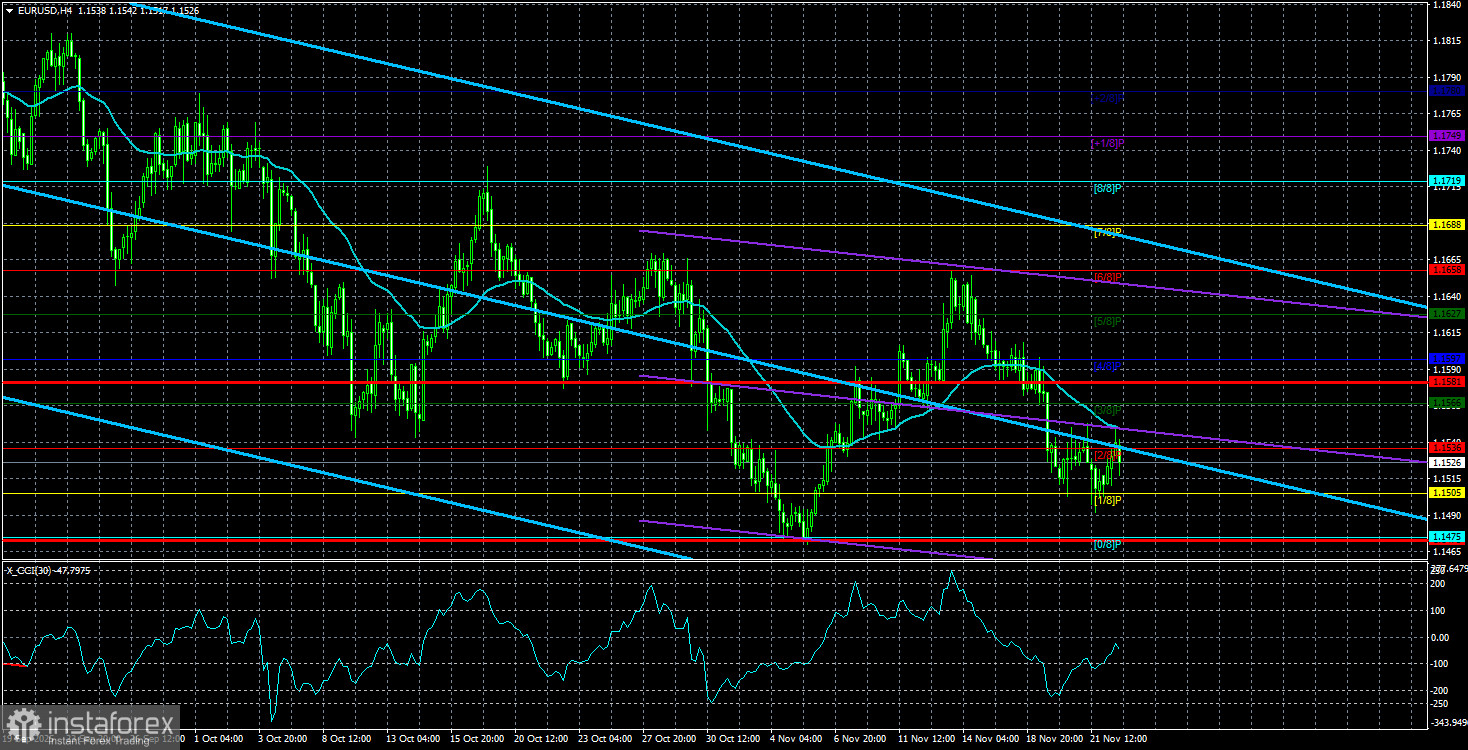
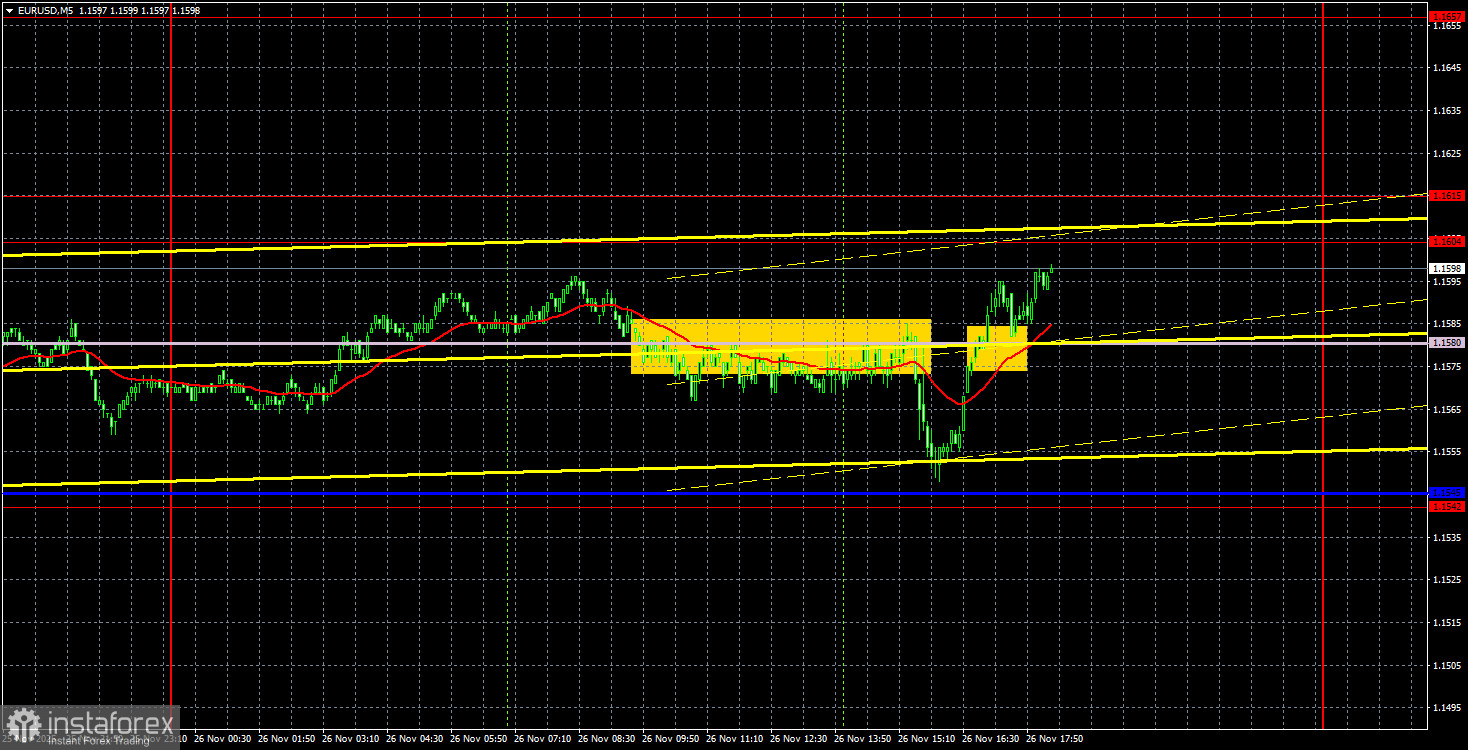
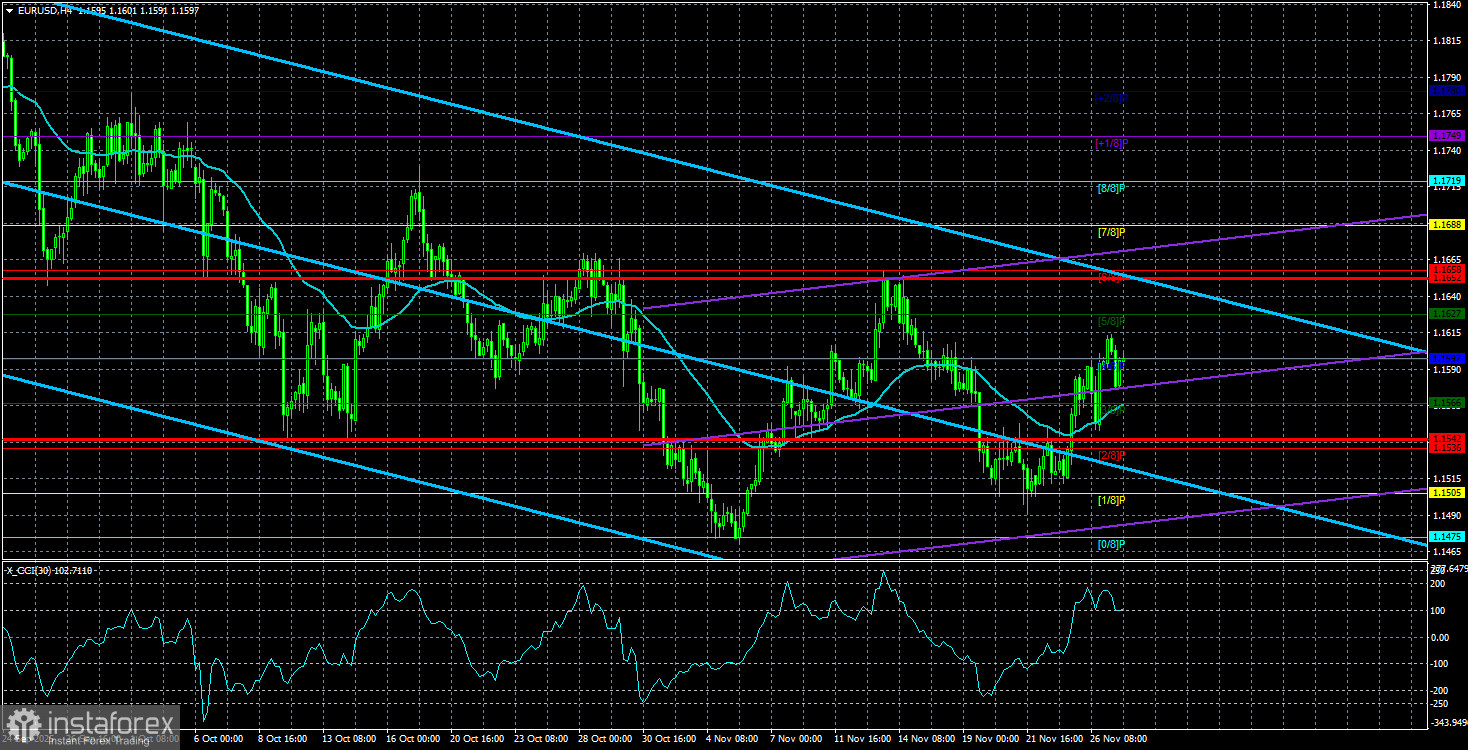
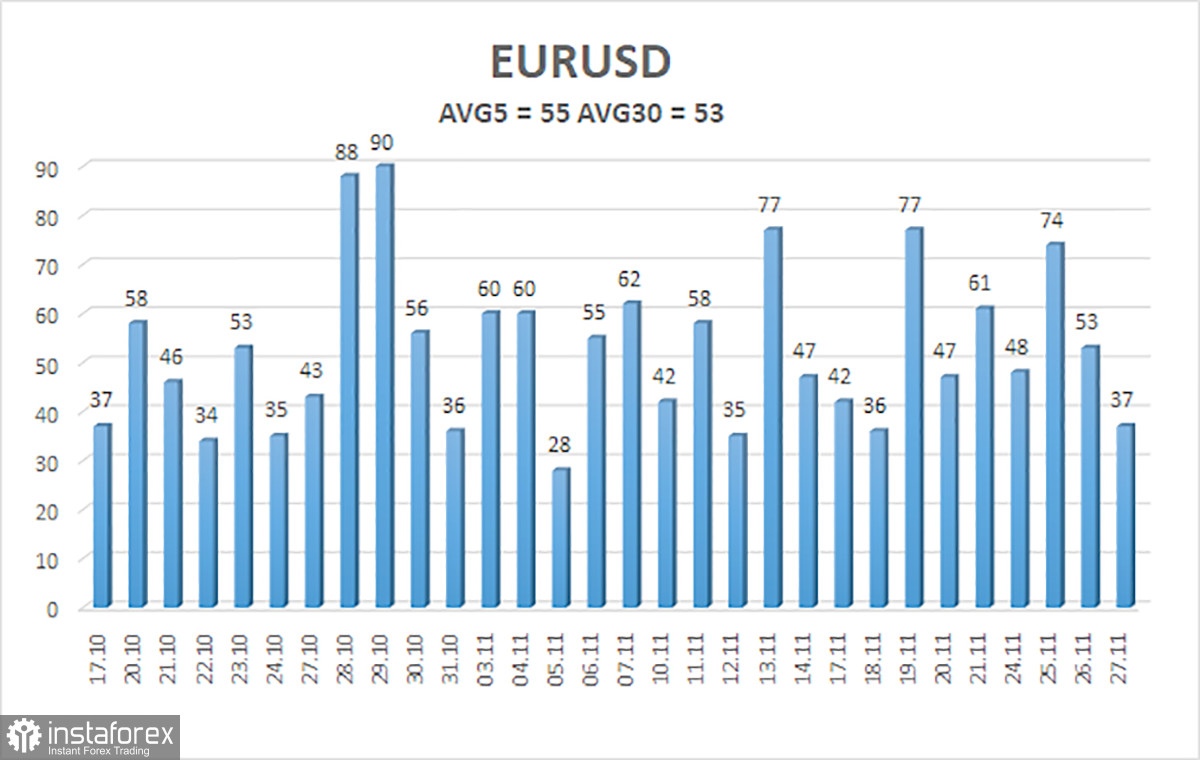
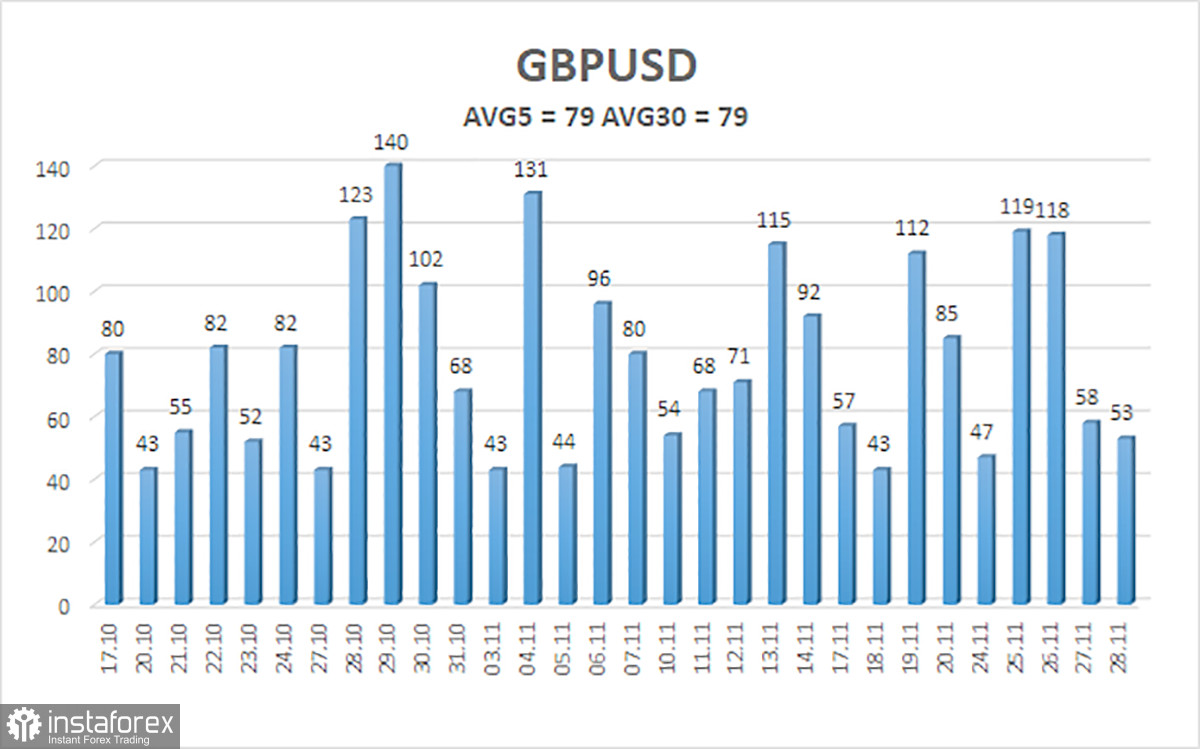
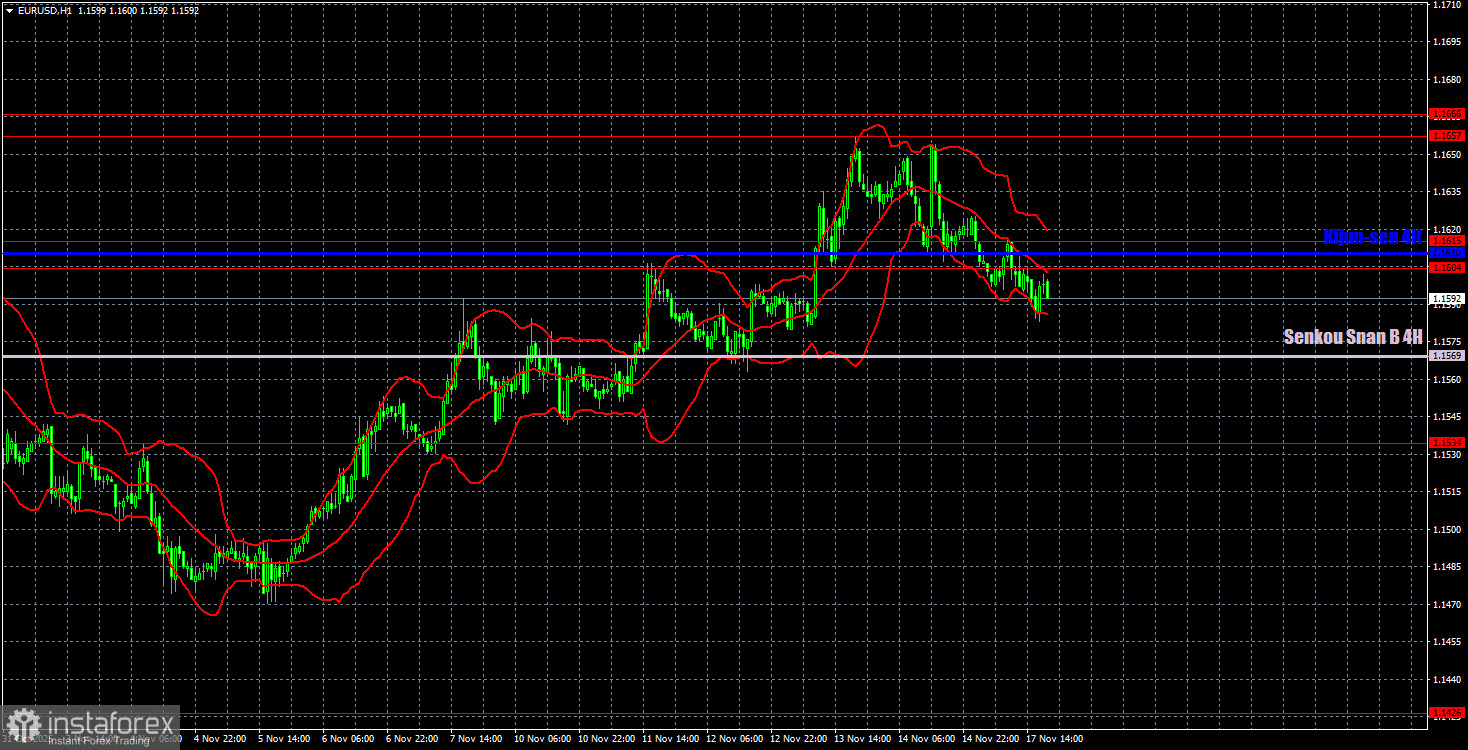
On the hourly timeframe, the EUR/USD pair continues to form a new upward trend. The current growth of the euro does not align with the local macroeconomic backdrop and fundamentals, but does correspond with the global context. The price remains within the daily range of 1.1400–1.1830, suggesting that a rise in the euro towards 1.1800 can be expected even within this local trend. For November 18, we highlight the following significant levels for trading: 1.1234, 1.1274, 1.1362, 1.1426, 1.1534, 1.1604-1.1615, 1.1657-1.1666, 1.1750-1.1760, 1.1846-1.1857, 1.1922, 1.1971-1.1988, as well as the Senkou Span B line (1.1569) and Kijun-sen (1.1610). The Ichimoku indicator lines may shift throughout the day, which should be taken into account when determining trading signals. Don't forget to set Stop Loss orders to break even once the price moves in the correct direction by 15 pips. This will safeguard against potential losses if the signal turns out to be false. On Tuesday, no significant or interesting events or reports are scheduled in the Eurozone or the U.S. Therefore, volatility is unlikely to rise significantly above the average of around 50 pips. Throughout the day, the pair may trade predominantly sideways. Trading Recommendations: On Tuesday, traders may open long positions if there is a consolidation above the 1.1604–1.1615 range, targeting 1.1657–1.1666. A bounce from the Senkou Span B line will also provide an opportunity for long positions. Short positions will become relevant if the price consolidates below the Senkou Span B line, with a target at 1.1534. Explanations for Illustrations: Support and resistance price levels are shown as thick red lines, near which the movement may end. They are not sources of trading signals. Kijun-sen and Senkou Span B lines are lines from the Ichimoku indicator transferred to the hourly timeframe from the 4-hour timeframe. They are strong lines. Extreme levels are thin red lines from which the price previously bounced. They are sources of trading signals. Yellow lines are trend lines, trend channels, and any other technical patterns. Indicator 1 on COT charts represents the size of each category of traders' net position.
Read more: https://ifxpr.com/4qZQ1eJ