Forex Analysis & Reviews: EUR/USD: trading tips for beginners for European session on May 30
The price test of 1.0836 occurred at a time when the MACD indicator was just starting to move down from the zero mark, which confirmed the entry point to sell the euro. As a result, the EUR/USD pair dropped more than 30 pips. Yesterday, Germany's data on consumer confidence and the Consumer Price Index exerted pressure on the euro, and comments from Federal Reserve officials regarding the prospects of U.S. inflation only increased pressure on risk assets, pushing EUR/USD even lower. Today, reports on Spain's CPI and the Eurozone's unemployment rate will be published. Weak results will increase pressure on the euro, which will help the corrective movement at the end of the month. As for the intraday strategy, I will rely more on the implementation of scenarios No. 1 and 2.
Buy signals Scenario No 1. Today, you can buy the euro when the price reaches 1.0806 plotted by the green line on the chart, aiming for growth to the level of 1.0841. At the level of 1.0841, I plan to exit the market and also sell the euro in the opposite direction, counting on a movement of 30-35 pips from the entry point. You can count on the euro to rise today only after very good Eurozone data, as there will be no other reasons to buy. Before buying, make sure that the MACD indicator is above the zero mark and is just starting to rise from it. Scenario No 2. I am also going to buy the euro today in case of two consecutive tests of the price of 1.0787 at the time when the MACD indicator is in the oversold area. This will limit the downward potential of the instrument and lead to an upward reversal of the market. We can expect growth to the opposite levels of 1.0806 and 1.0841. Sell signals Scenario No 1. I plan to sell the euro after EUR/USD reaches the level of 1.0787 plotted by the red line on the chart. The target will be the level of 1.0755, where I am going to exit the market and buy immediately in the opposite direction (expecting a movement of 20-25 pips in the upward direction from the level). Pressure on EUR/USD will increase in case the price fails to consolidate near the daily high and if Spain and the Eurozone release weak data. Before selling, make sure that the MACD indicator is below the zero mark and is just starting to decline from it. Scenario No 2. I am also going to sell the euro today in case of two consecutive price tests of 1.0806 at the time when the MACD indicator is in the overbought area. This will limit the pair's upward potential and lead to a downward reversal of the market. We can expect a decline to the opposite level of 1.0787 and 1.0755.
What's on the chart: The thin green line is the entry price at which you can buy the trading instrument. The thick green line is the price where you can set Take-Profit (TP) or manually fix profits, as further growth above this level is unlikely. The thin red line is the entry price at which you can sell the trading instrument. The thick red line is the price where you can set Take-Profit (TP) or manually fix profits, as further decline below this level is unlikely. MACD line: it is important to be guided by overbought and oversold areas when entering the market Important: Novice traders in the cryptocurrency market need to be very cautious when making decisions to enter the market. It is best to stay out of the market before important fundamental reports are released to avoid getting caught in sharp price fluctuations. If you decide to trade during news releases, always place stop orders to minimize losses. Without setting stop orders, you can quickly lose your entire deposit, especially if you don't use money management and trade with large volumes. Remember, for successful trading, it is necessary to have a clear trading plan, similar to the one I presented above. Spontaneously making trading decisions based on the current market situation is inherently a losing strategy for an intraday trader.
Analysis are provided by InstaForex.
Read more: https://ifxpr.com/4bWydcf
|
|

|
Instaforex Analysis
Re: Instaforex Analysis
![]() by IFX Bella » Thu May 30, 2024 6:00 am
by IFX Bella » Thu May 30, 2024 6:00 am
- IFX Bella
- Posts: 650
- Joined: Sat Dec 08, 2012 12:39 am
Re: Instaforex Analysis
![]() by IFX Bella » Fri May 31, 2024 4:42 am
by IFX Bella » Fri May 31, 2024 4:42 am
Forex Analysis & Reviews: USD/JPY: trading tips for beginners for European session on May 31
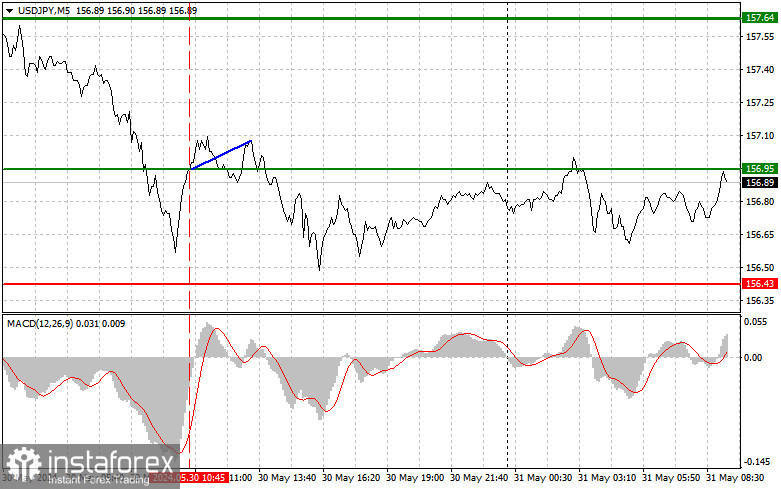
Overview of trading and tips on USD/JPY The price test of 156.95 occurred at a time when the MACD indicator was just starting to rise from the zero mark, which confirmed the entry point to buy the dollar. As a result, the USD/JPY pair was up by only 10 pips before it was under pressure again. The dollar fell due to US data. Although traders took advantage of this moment, it's too early to say that the bulls are in control of the market. Today's figures for the Tokyo Consumer Price Index and Japan's unemployment rate matched economists' forecasts, while the retail sales report exceeded economists' expectations. This could theoretically support the yen during the European session. However, the lower the dollar falls, the more attractive it is for the bulls, so be cautious with selling the pair at current levels. As for the intraday strategy, I will rely more on the implementation of scenarios No. 1 and 2.
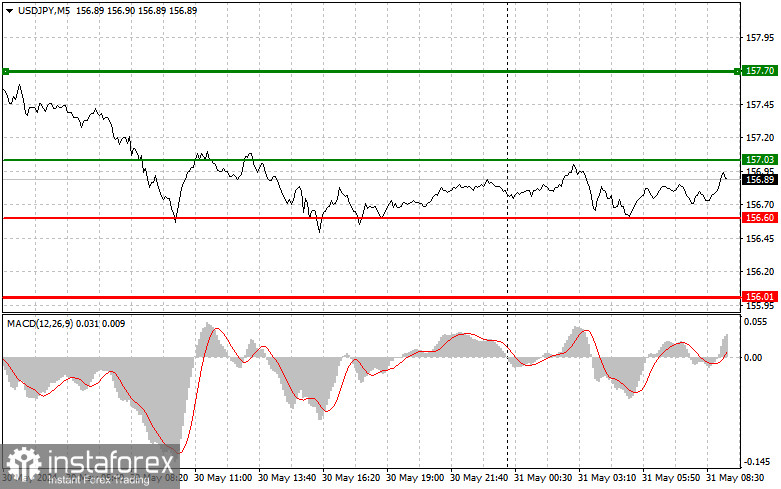
Buy signals Scenario No. 1. I plan to buy USD/JPY today when the price reaches the entry point at 157.03 plotted by the green line on the chart, aiming for growth to 157.70 plotted by the thicker green line on the chart. In the area of 157.70, I'm going to exit long positions and open short ones in the opposite direction, expecting a movement of 30-35 pips in the opposite direction from that level. You can count on USD/JPY's growth today in continuation of the trend. Before buying, make sure that the MACD indicator is above the zero mark and is just starting to rise from it. Scenario No. 2. I also plan to buy USD/JPY today in case of two consecutive tests of 156.60 at the time when the MACD indicator is in the oversold area. This will limit the downward potential of the pair and lead to an upward reversal of the market. We can expect growth to the opposite levels of 157.03 and 157.70. Sell signals Scenario No. 1. I plan to sell USD/JPY today only after testing the level of 156.60 plotted by the red line on the chart, which will lead to a rapid decline in the price. The key target for sellers will be 156.01, where I am going to exit short positions and also immediately open long ones in the opposite direction, expecting a movement of 20-25 pips in the opposite direction from that level. Pressure on USD/JPY may return in case the price fails to settle near the day's high. Before selling, make sure that the MACD indicator is below the zero mark and is just starting to decline from it. Scenario No. 2. I also plan to sell USD/JPY today in case of two consecutive tests of the price of 157.03 at the time when the MACD indicator is in the overbought area. This will limit the pair's upward potential and lead to a downwards market reversal. We can expect a decline to the opposite levels of 156.60 and 156.01.
Analysis are provided by InstaForex.
Read more: https://ifxpr.com/4aHmVHB
Overview of trading and tips on USD/JPY The price test of 156.95 occurred at a time when the MACD indicator was just starting to rise from the zero mark, which confirmed the entry point to buy the dollar. As a result, the USD/JPY pair was up by only 10 pips before it was under pressure again. The dollar fell due to US data. Although traders took advantage of this moment, it's too early to say that the bulls are in control of the market. Today's figures for the Tokyo Consumer Price Index and Japan's unemployment rate matched economists' forecasts, while the retail sales report exceeded economists' expectations. This could theoretically support the yen during the European session. However, the lower the dollar falls, the more attractive it is for the bulls, so be cautious with selling the pair at current levels. As for the intraday strategy, I will rely more on the implementation of scenarios No. 1 and 2.
Buy signals Scenario No. 1. I plan to buy USD/JPY today when the price reaches the entry point at 157.03 plotted by the green line on the chart, aiming for growth to 157.70 plotted by the thicker green line on the chart. In the area of 157.70, I'm going to exit long positions and open short ones in the opposite direction, expecting a movement of 30-35 pips in the opposite direction from that level. You can count on USD/JPY's growth today in continuation of the trend. Before buying, make sure that the MACD indicator is above the zero mark and is just starting to rise from it. Scenario No. 2. I also plan to buy USD/JPY today in case of two consecutive tests of 156.60 at the time when the MACD indicator is in the oversold area. This will limit the downward potential of the pair and lead to an upward reversal of the market. We can expect growth to the opposite levels of 157.03 and 157.70. Sell signals Scenario No. 1. I plan to sell USD/JPY today only after testing the level of 156.60 plotted by the red line on the chart, which will lead to a rapid decline in the price. The key target for sellers will be 156.01, where I am going to exit short positions and also immediately open long ones in the opposite direction, expecting a movement of 20-25 pips in the opposite direction from that level. Pressure on USD/JPY may return in case the price fails to settle near the day's high. Before selling, make sure that the MACD indicator is below the zero mark and is just starting to decline from it. Scenario No. 2. I also plan to sell USD/JPY today in case of two consecutive tests of the price of 157.03 at the time when the MACD indicator is in the overbought area. This will limit the pair's upward potential and lead to a downwards market reversal. We can expect a decline to the opposite levels of 156.60 and 156.01.
Analysis are provided by InstaForex.
Read more: https://ifxpr.com/4aHmVHB
- IFX Bella
- Posts: 650
- Joined: Sat Dec 08, 2012 12:39 am
Re: Instaforex Analysis
![]() by IFX Bella » Mon Jun 03, 2024 4:36 am
by IFX Bella » Mon Jun 03, 2024 4:36 am
Forex Analysis & Reviews: Forecast for EUR/USD on June 3, 2024
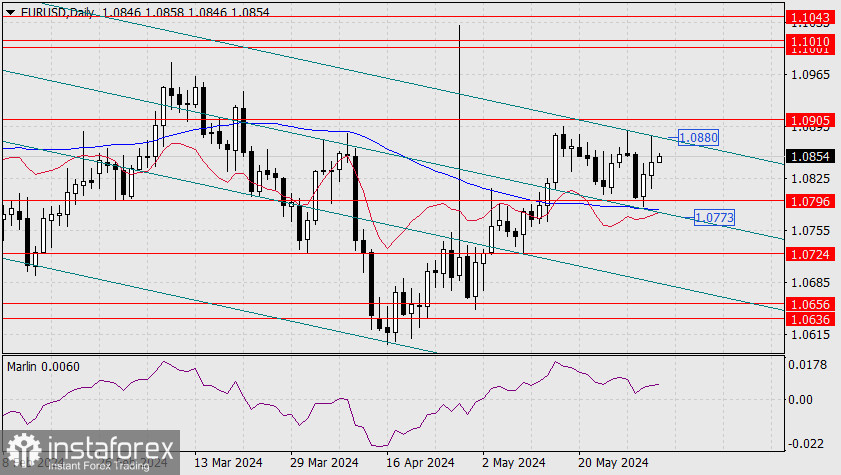
EUR/USD On Friday, the euro tested the upper boundary of the price channel. If the price aims to test this line again, the resistance will be slightly lower at 1.0880. If the price surpasses this resistance, the next target will be 1.0905.
https://forex-images.ifxdb.com/userfile ... ource!.jpg
Here, a divergence with the Marlin oscillator might form. The price may achieve this before the European Central Bank meeting on Thursday. However, the euro might abandon its final attempt at growth if the US ISM Manufacturing PMI for May, to be published this evening, meets or exceeds the forecast of 49.8, compared to April's 49.2.
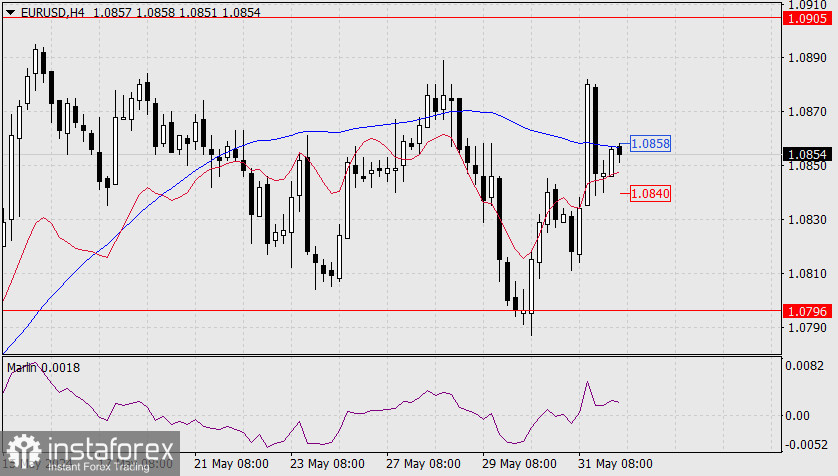
On the 4-hour chart, the price sharply climbed above the Kijun-Sen line on Friday and then quickly returned below it, confirming the move. However, the price did not break the support of the balance line, and the Marlin oscillator remains in the bullish territory. Therefore, in order to show that it refuses to resume the upward movement, the price needs to fall below the balance line, under the 1.0840 mark. Consolidation above 1.0858 (the Kijun-Sen line) would provide a reason to advance towards 1.0880.
Analysis are provided by InstaForex.
Read more: https://ifxpr.com/3Vpksx3
EUR/USD On Friday, the euro tested the upper boundary of the price channel. If the price aims to test this line again, the resistance will be slightly lower at 1.0880. If the price surpasses this resistance, the next target will be 1.0905.
https://forex-images.ifxdb.com/userfile ... ource!.jpg
Here, a divergence with the Marlin oscillator might form. The price may achieve this before the European Central Bank meeting on Thursday. However, the euro might abandon its final attempt at growth if the US ISM Manufacturing PMI for May, to be published this evening, meets or exceeds the forecast of 49.8, compared to April's 49.2.
On the 4-hour chart, the price sharply climbed above the Kijun-Sen line on Friday and then quickly returned below it, confirming the move. However, the price did not break the support of the balance line, and the Marlin oscillator remains in the bullish territory. Therefore, in order to show that it refuses to resume the upward movement, the price needs to fall below the balance line, under the 1.0840 mark. Consolidation above 1.0858 (the Kijun-Sen line) would provide a reason to advance towards 1.0880.
Analysis are provided by InstaForex.
Read more: https://ifxpr.com/3Vpksx3
- IFX Bella
- Posts: 650
- Joined: Sat Dec 08, 2012 12:39 am
Re: Instaforex Analysis
![]() by IFX Bella » Tue Jun 04, 2024 4:31 am
by IFX Bella » Tue Jun 04, 2024 4:31 am
Forex Analysis & Reviews: EUR/USD and GBP/USD: Technical analysis on June 4
EUR/USD

Yesterday, the bulls took advantage of some optimism by the May monthly candlestick and they managed to close the day above the highs of the last four weeks (1.0895), as well as above the resistance that was tested the previous day (1.0863-71-85). The resistance levels now serve as near-term supports. The next bullish target is in the area of 1.0934 (the final level of the weekly Ichimoku cross), the bulls will also focus on the breakthrough of the daily cloud (1.1028 - 1.1075).
GBP/USD

Higher Timeframes Yesterday the pound managed to renew the highs of the previous week and month (May 1.2799). As a result, the bulls can now reach the most important targets of this section of the chart - the monthly Ichimoku cloud (1.2892 - 1.3007) and a breakdown of the daily Ichimoku cloud (1.2947 - 1.3019). Today, the main center in focus is the daily short-term trend (1.2746), as the pair has not yet broken away from the level. If the bears manage to regain the daily Tenkan, they will focus on the consolidation of the weekly and daily Fibo Kijun supports around 1.2665-74.
Analysis are provided by InstaForex.
Read more: https://ifxpr.com/3X7umoj
EUR/USD
Yesterday, the bulls took advantage of some optimism by the May monthly candlestick and they managed to close the day above the highs of the last four weeks (1.0895), as well as above the resistance that was tested the previous day (1.0863-71-85). The resistance levels now serve as near-term supports. The next bullish target is in the area of 1.0934 (the final level of the weekly Ichimoku cross), the bulls will also focus on the breakthrough of the daily cloud (1.1028 - 1.1075).
GBP/USD
Higher Timeframes Yesterday the pound managed to renew the highs of the previous week and month (May 1.2799). As a result, the bulls can now reach the most important targets of this section of the chart - the monthly Ichimoku cloud (1.2892 - 1.3007) and a breakdown of the daily Ichimoku cloud (1.2947 - 1.3019). Today, the main center in focus is the daily short-term trend (1.2746), as the pair has not yet broken away from the level. If the bears manage to regain the daily Tenkan, they will focus on the consolidation of the weekly and daily Fibo Kijun supports around 1.2665-74.
Analysis are provided by InstaForex.
Read more: https://ifxpr.com/3X7umoj
- IFX Bella
- Posts: 650
- Joined: Sat Dec 08, 2012 12:39 am
Re: Instaforex Analysis
![]() by IFX Bella » Wed Jun 05, 2024 5:37 am
by IFX Bella » Wed Jun 05, 2024 5:37 am
Forex Analysis & Reviews: Forecast for EUR/USD on June 5, 2024
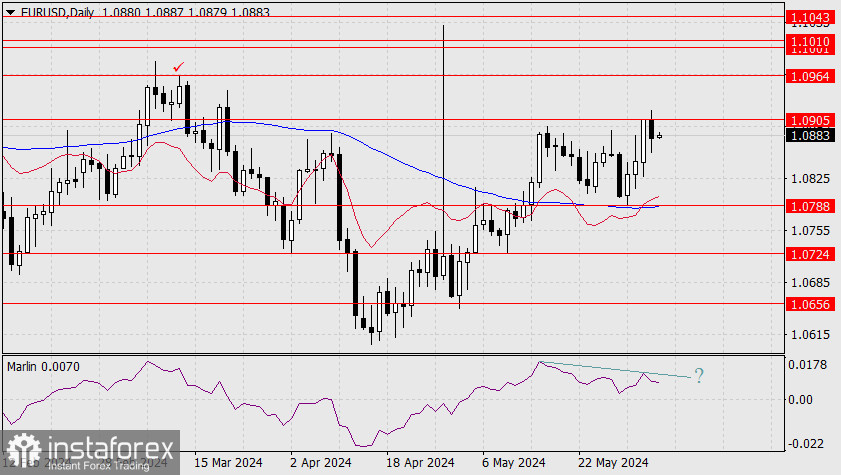
EUR/USD After a strong rise on Monday, yesterday the euro lost 25 pips from the resistance at 1.0905, without testing its fate ahead of the European Central Bank meeting on Thursday. As a result, a divergence formed on the daily chart, which suggests that the price will likely fall today.
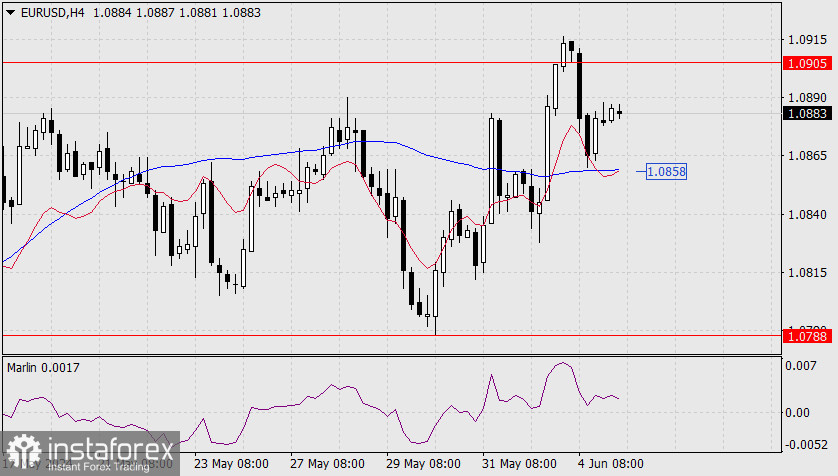
In the evening, the Bank of Canada may lower the rate from 5.00% to 4.75%. The US composite PMI is expected to increase from 51.3 to 54.4 in May, and according to the ADP private sector employment estimate for May, 173,000 new jobs are expected. All these economic indicators suggest that the dollar may rise. The pair has shown high trading volumes since Monday, so investors may not make significant decisions today. We expect the pair to edge down.
On the 4-hour chart, yesterday the price stopped falling as it approached the MACD line. Today, the price may attempt to test this support again (1.0858). Yesterday, the Marlin oscillator did not dare to breach the boundary of the downtrend. Tomorrow, the price and the oscillator will likely encounter the ECB's decision at their neutral levels.
Analysis are provided by InstaForex.
Read more: https://ifxpr.com/3xbBKV9
EUR/USD After a strong rise on Monday, yesterday the euro lost 25 pips from the resistance at 1.0905, without testing its fate ahead of the European Central Bank meeting on Thursday. As a result, a divergence formed on the daily chart, which suggests that the price will likely fall today.
In the evening, the Bank of Canada may lower the rate from 5.00% to 4.75%. The US composite PMI is expected to increase from 51.3 to 54.4 in May, and according to the ADP private sector employment estimate for May, 173,000 new jobs are expected. All these economic indicators suggest that the dollar may rise. The pair has shown high trading volumes since Monday, so investors may not make significant decisions today. We expect the pair to edge down.
On the 4-hour chart, yesterday the price stopped falling as it approached the MACD line. Today, the price may attempt to test this support again (1.0858). Yesterday, the Marlin oscillator did not dare to breach the boundary of the downtrend. Tomorrow, the price and the oscillator will likely encounter the ECB's decision at their neutral levels.
Analysis are provided by InstaForex.
Read more: https://ifxpr.com/3xbBKV9
- IFX Bella
- Posts: 650
- Joined: Sat Dec 08, 2012 12:39 am
Re: Instaforex Analysis
![]() by IFX Bella » Thu Jun 06, 2024 4:27 am
by IFX Bella » Thu Jun 06, 2024 4:27 am
Forex Analysis & Reviews: Forecast of EUR/USD pair on June 6, 2024
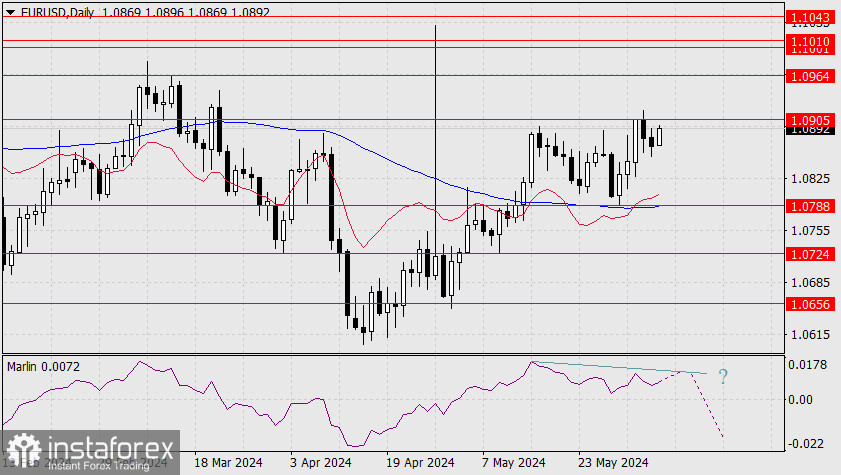
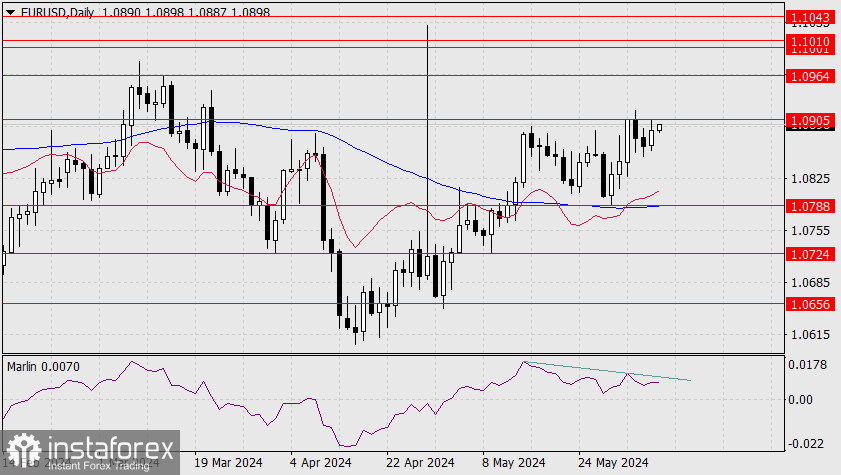
EUR/USD In anticipation of today's ECB meeting, the euro has covered the entire range of target levels, nearly 120 points (1.0788-1.0905), with final consolidation near the upper level of this range. Yesterday, the euro closed with a 10-point decline, but since the S&P 500 rose by 1.18%, the European currency is starting to rise this morning. The ECB is expected to cut the rate by 0.25%. Although this cut is anticipated, it is not priced in by the markets. Consequently, we expect a price drop with an attempt to break through the significant support at 1.0788. Consolidating below this level will mark the beginning of a new medium-term downtrend.
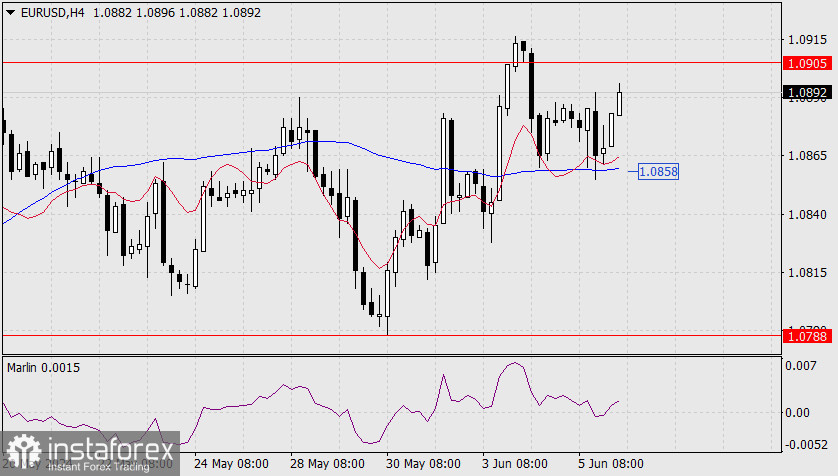
However, technical details allow for a significant rise in the euro before it falls. The simplest scenario is reaching the target level of 1.0964, gradually increasing the divergence with the Marlin oscillator. The price might rise even higher to the target range of 1.1001/10 (the peaks of November and December last year). By this time, the S&P 500 index, which has so far prevented the euro from falling, will reach a new historical high around 5382 at the boundary of the rising price channel and will also form technical divergence. These technical details could have been highlighted during Christine Lagarde's press conference, during which she acknowledged the strength of inflation and indicated a longer-than-expected period before the second rate cut.
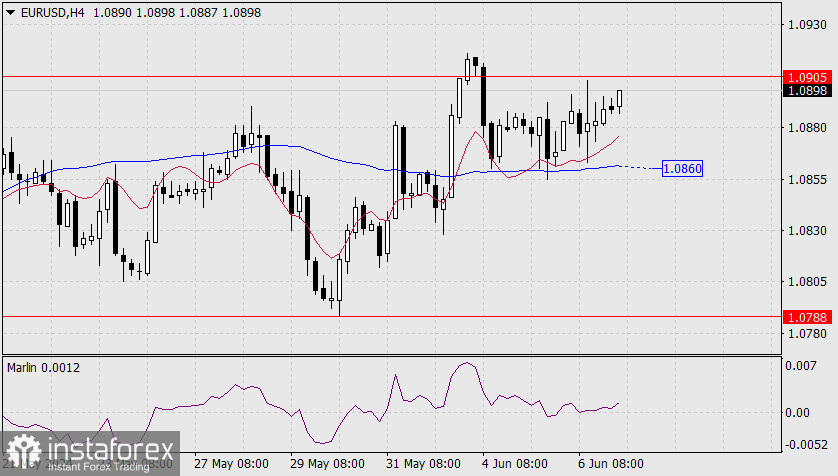
The price found support yesterday from the MACD indicator line on the four-hour chart. The Marlin oscillator briefly dipped below the zero line but has returned to positive territory. We see the traditional false downward movement. Consolidating the price below the MACD line, below the 1.0858 mark, will shift the technical indicators towards a decline. We now await the ECB release and subsequent comments from Christine Lagarde
Analysis are provided by InstaForex.
Read more: https://ifxpr.com/3x8E0g3
EUR/USD In anticipation of today's ECB meeting, the euro has covered the entire range of target levels, nearly 120 points (1.0788-1.0905), with final consolidation near the upper level of this range. Yesterday, the euro closed with a 10-point decline, but since the S&P 500 rose by 1.18%, the European currency is starting to rise this morning. The ECB is expected to cut the rate by 0.25%. Although this cut is anticipated, it is not priced in by the markets. Consequently, we expect a price drop with an attempt to break through the significant support at 1.0788. Consolidating below this level will mark the beginning of a new medium-term downtrend.
However, technical details allow for a significant rise in the euro before it falls. The simplest scenario is reaching the target level of 1.0964, gradually increasing the divergence with the Marlin oscillator. The price might rise even higher to the target range of 1.1001/10 (the peaks of November and December last year). By this time, the S&P 500 index, which has so far prevented the euro from falling, will reach a new historical high around 5382 at the boundary of the rising price channel and will also form technical divergence. These technical details could have been highlighted during Christine Lagarde's press conference, during which she acknowledged the strength of inflation and indicated a longer-than-expected period before the second rate cut.
The price found support yesterday from the MACD indicator line on the four-hour chart. The Marlin oscillator briefly dipped below the zero line but has returned to positive territory. We see the traditional false downward movement. Consolidating the price below the MACD line, below the 1.0858 mark, will shift the technical indicators towards a decline. We now await the ECB release and subsequent comments from Christine Lagarde
Analysis are provided by InstaForex.
Read more: https://ifxpr.com/3x8E0g3
- IFX Bella
- Posts: 650
- Joined: Sat Dec 08, 2012 12:39 am
Re: Instaforex Analysis
![]() by IFX Bella » Fri Jun 07, 2024 4:02 am
by IFX Bella » Fri Jun 07, 2024 4:02 am
Forex Analysis & Reviews: Forecast of EUR/USD pair on June 7, 2024
EUR/USD So, the ECB rate cut by the expected 0.25% has passed. The euro reacted calmly to the news, even slightly increasing its resistance of 1.0905. Christine Lagarde, describing the prospects of the economy in optimistic tones, noted, however, that the next action of the Central Bank is beyond the horizon of forecasts. Nevertheless, the discrepancy with the Fed's rate has increased to 1.25%, and the US economy looks stronger, with the Treasury actively attracting debt through government bonds, so the markets will still feel this pressure, and the euro will decline.
Today, this confrontation remains uncertain. In the eurozone, GDP for the 1st quarter may show an increase of 0.3%, and in the United States, the non-agricultural sector may show an increase of 186 thousand in May against 175 thousand in April. A qualitative change in the market is likely next week when investors compare the balance of the economies. A divergence has been formed on the daily chart of the single currency. This is already a signal and the first sign of a reversal. We will find out on Monday morning whether the divergence will withstand the pressure of speculators.
On the four-hour chart, the price looks well fixed above the indicator lines, especially after yesterday's testing of the balance line by the lower shadow, which threw the price up. But the Marlin oscillator is in no hurry to grow and lies on the horizon above the neutral zero line. The euro's fall will become confident after overcoming the support of the Kruzenshtern line (1.0860). The goal is 1.0788. Fixing the price above 1.0905 may be false, even if the target of 1.0964 is formally opened – it is possible to form a double divergence on a daily scale.
Analysis are provided by InstaForex.
Read more: https://www.instaforex.eu/forex_analysis/378957
- IFX Bella
- Posts: 650
- Joined: Sat Dec 08, 2012 12:39 am
Re: Instaforex Analysis
![]() by IFX Bella » Mon Jun 10, 2024 4:04 am
by IFX Bella » Mon Jun 10, 2024 4:04 am
Forex Analysis & Reviews: Technical Analysis of Daily Price Movement of USD/IDR Exotic Currency Pairs , Monday June 10, 2024.
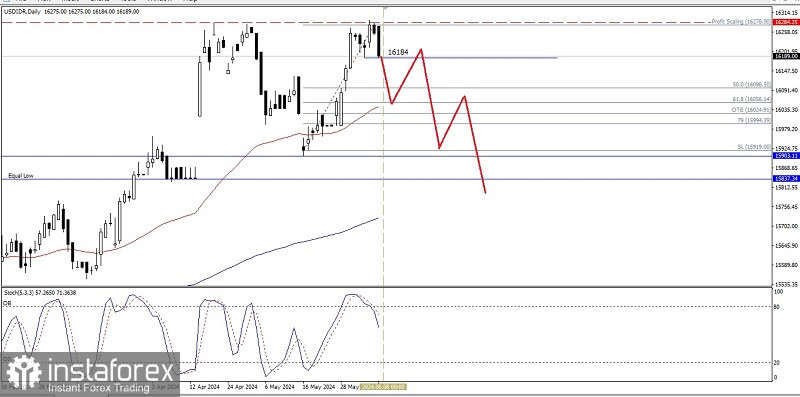
If you pay attention to the daily chart, the exotic currency pair USD/IDR appears to be still in a bullish condition, where this can be seen from the EMA 50 which is still above the EMA 200 (Golden Cross), which indicates that buyers are still dominant on the Daily chart of USD/IDR. However, with the condition of the Stochastic Oscillator indicator which has managed to break below level 80, in the next few days, as long as this currency does not return to its initial bias, especially if it succeeds in breaking above level 16374.73, USD/IDR has the potential to be corrected down to level 16024.91 as the main target and if the momentum and volatility support then level 15837.34 will be the next target to aim for.
Analysis are provided by InstaForex.
Read more: https://ifxpr.com/4aQeMRv
- IFX Bella
- Posts: 650
- Joined: Sat Dec 08, 2012 12:39 am
Re: Instaforex Analysis
![]() by IFX Bella » Tue Jun 11, 2024 3:25 am
by IFX Bella » Tue Jun 11, 2024 3:25 am
Forex Analysis & Reviews: Forecast for EUR/USD on June 11, 2024
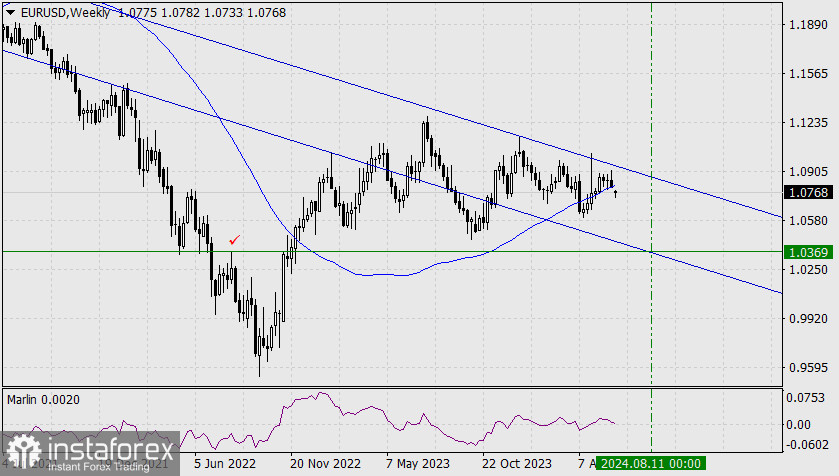
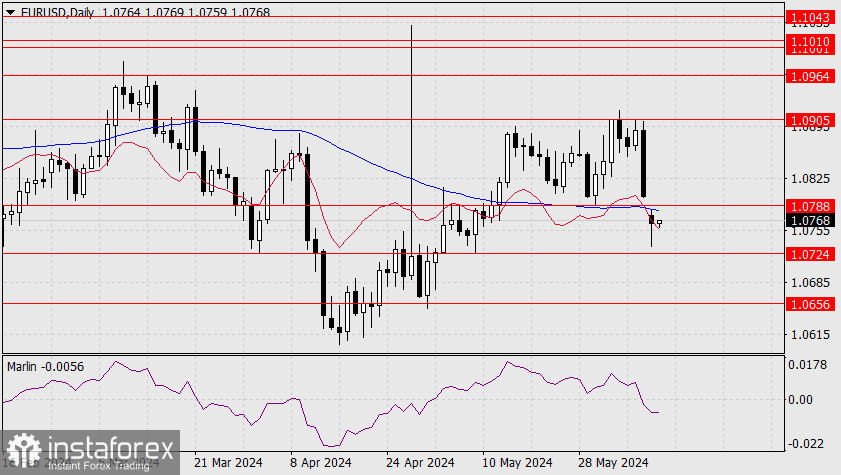
EUR/USD On the weekly chart, the euro has opened a gap below the support of the Kijun-sen line, setting a target at 1.0369, which coincides with the August 2022 peak and the embedded line of the descending price channel. The Marlin oscillator is close to entering negative territory, but first, we hope to see the gap closed below the Kijun-sen line.
If European market participants are alarmed by the victory of right-wing forces in the European Parliament elections, it simplifies the carry trade operation for the U.S. Treasury involving foreign investors, which in turn increases the demand for dollars. Today, there is an auction for 10-year bonds worth $39 billion and one-year bills worth $46 billion.
On the daily chart, the price has consolidated below the Kijun-sen line and the 1.0788 level, while the Marlin oscillator also settled below the neutral zero line. However, unless the gap is closed, it is unlikely for the price to fall in the medium-term. The Federal Reserve will announce its monetary policy decision tomorrow evening, and if the gap is not closed by then, high volatility is expected at the time of the release. Ultimately, we anticipate the price to reach the 1.0656 level.
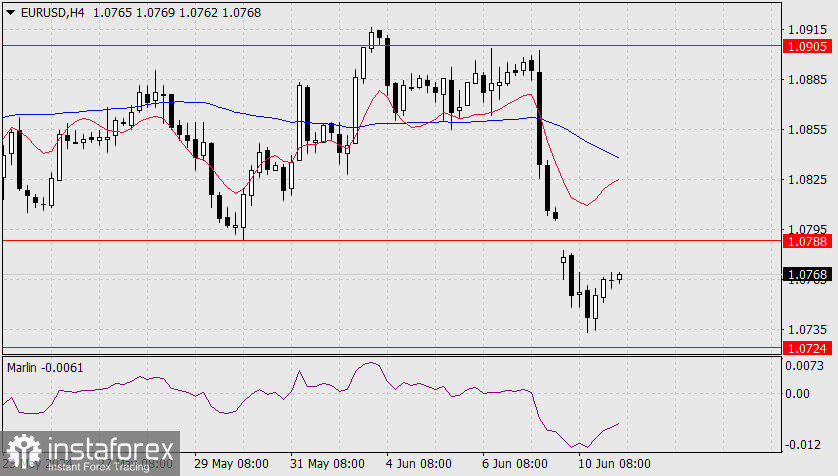
On the 4-hour chart, the corrective growth continues as usual, with the Marlin oscillator rising and pulling the price above the 1.0788 level. The market has the opportunity to rise and close the gap before the Fed meeting.
Analysis are provided by InstaForex.
Read more: https://ifxpr.com/4cfY8fe
EUR/USD On the weekly chart, the euro has opened a gap below the support of the Kijun-sen line, setting a target at 1.0369, which coincides with the August 2022 peak and the embedded line of the descending price channel. The Marlin oscillator is close to entering negative territory, but first, we hope to see the gap closed below the Kijun-sen line.
If European market participants are alarmed by the victory of right-wing forces in the European Parliament elections, it simplifies the carry trade operation for the U.S. Treasury involving foreign investors, which in turn increases the demand for dollars. Today, there is an auction for 10-year bonds worth $39 billion and one-year bills worth $46 billion.
On the daily chart, the price has consolidated below the Kijun-sen line and the 1.0788 level, while the Marlin oscillator also settled below the neutral zero line. However, unless the gap is closed, it is unlikely for the price to fall in the medium-term. The Federal Reserve will announce its monetary policy decision tomorrow evening, and if the gap is not closed by then, high volatility is expected at the time of the release. Ultimately, we anticipate the price to reach the 1.0656 level.
On the 4-hour chart, the corrective growth continues as usual, with the Marlin oscillator rising and pulling the price above the 1.0788 level. The market has the opportunity to rise and close the gap before the Fed meeting.
Analysis are provided by InstaForex.
Read more: https://ifxpr.com/4cfY8fe
- IFX Bella
- Posts: 650
- Joined: Sat Dec 08, 2012 12:39 am
Re: Instaforex Analysis
![]() by IFX Bella » Wed Jun 12, 2024 5:32 am
by IFX Bella » Wed Jun 12, 2024 5:32 am
Forex Analysis & Reviews: Trading Signals for GOLD (XAU/USD) for June 11-13, 2024: buy above $2,312 (5/8 Murray- GAP
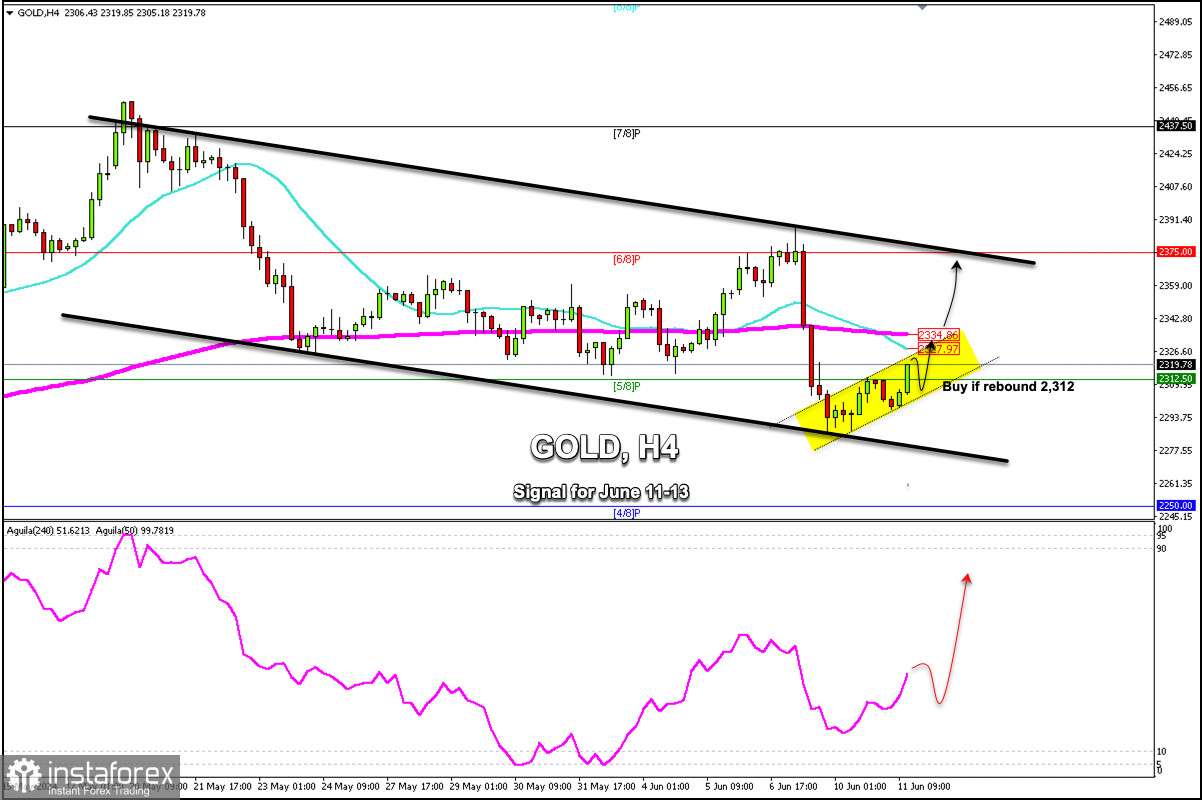
Early in the American session, Gold is trading around 2,319.78, bouncing within the secondary uptrend channel formed on the H4 chart after reaching the low of 2,277. Gold could reach a resistance zone of around 2,320. If it fails to break this zone, we could expect a technical correction to occur and the metal could reach 5/8 Murray located at 2,312. If the XAU/USD pair returns to support levels, the key point is located at 2,312. This level could offer us a good opportunity to resume buying and gold could reach the 200 EMA located at 2,334. On the other hand, if gold consolidates above 2,334, the outlook could remain positive. We could expect it to reach the top of the downtrend channel around 2,374, the level that coincides with 6/8 Murray representing strong resistance. Gold left a GAP after the US Non-Farm Payrolls data at about 2,328. If the price consolidates above 2,312 in the coming days, it could rebound and cover this gap. On the contrary, with a drop and consolidation below 2,312, gold could return to support levels of around 2,280 and even towards 2,271. Our trading plan for the next few hours is to buy gold, but to do so, we should wait for a technical correction and a consolidation above 2,312. Then, we could buy with targets at 2,334 and 2,374.
Analysis are provided by InstaForex.
Read more: https://ifxpr.com/3yUKyQ2
- IFX Bella
- Posts: 650
- Joined: Sat Dec 08, 2012 12:39 am