Instaforex Analysis

Forex broker related topics and discussions

Re: Instaforex Analysis

Postby IFX Gertrude » Tue Nov 07, 2023 1:30 am

EURUSD H4 I Boucnig off support?

Image

The EUR/USD chart shows bearish momentum, potentially heading towards the 1st support at 1.0678, a pullback support. The 2nd support at 1.0606, coinciding with the 61.80% Fibonacci Retracement, adds to the support zone.

On the resistance side, the 1st resistance at 1.0759, a multi-swing high resistance, could lead to selling pressure. The 2nd resistance at 1.0835 is another potential obstacle for upward movement.

Analysis are provided by InstaForex.

Read More https://ifxpr.com/49nCXXS
Best regards, PR Manager

Learn more about InstaForex Company at http://instaforex.com
IFX Gertrude
 
Posts: 5198
Joined: Wed Nov 07, 2012 6:25 am

Re: Instaforex Analysis

Postby IFX Gertrude » Wed Nov 08, 2023 1:03 am

Technical Analysis of Intraday Price Movement of AUD/JPY Cross Currency Pairs, Wednesday, November 08 2023

Image

With a price movement which is above its EMA 200 that has an upward slope as well as the appearance of Bullish 123 pattern followed by the Bullish Ross Hook (RH) which in a few times manages to breakout above as well as the appearance of Fractal Bar pattern which detected at the candle Pinbar on the 4 hour chart of AUD/JPY Cross currency pairs, then in the near future, this cross currency pairs has the potential to appreciate above to the level 97.53. If on the way to the level there is no downward correction which breaks under the level 95.84, because if this level manages to break above, then the strengthening condition that has been described before will become invalid and cancel itself.

Analysis are provided by InstaForex.

Read More https://ifxpr.com/4707Akz
Best regards, PR Manager

Learn more about InstaForex Company at http://instaforex.com
IFX Gertrude
 
Posts: 5198
Joined: Wed Nov 07, 2012 6:25 am

Re: Instaforex Analysis

Postby IFX Gertrude » Thu Nov 09, 2023 2:21 am

EURUSD H4 I Continue to resistance?

Image

EUR/USD exhibits bullish momentum with a focus on the 1st resistance. The 1st support at 1.0664 coincides with the 38.20% Fibonacci Retracement, a key buying level. Similarly, the 2nd support at 1.0606 aligns with the 61.80% Fibonacci Retracement, enhancing its significance.

Resistance is expected at the 1st resistance of 1.0758, a multi-swing high resistance likely to trigger selling pressure. The 2nd resistance at 1.0835, a pullback resistance, may further impede upward movement

Analysis are provided by InstaForex.

Read More https://ifxpr.com/40tV8a8
Best regards, PR Manager

Learn more about InstaForex Company at http://instaforex.com
IFX Gertrude
 
Posts: 5198
Joined: Wed Nov 07, 2012 6:25 am

Re: Instaforex Analysis

Postby IFX Gertrude » Fri Nov 10, 2023 1:33 am

XAUUSD H4 I Continue to Support?

Image

The XAU/USD chart currently has a bearish momentum, indicating a potential move towards the 1st support at 1946.66, an overlap support with historical significance. The 2nd support at 1932.50 reinforces the potential buying zone as a pullback support. The 1st resistance at 1964.79, an overlap resistance coinciding with the 38.20% Fibonacci Retracement level, may impede upward movement. The 2nd resistance at 1976.78 acts as a pullback resistance, potentially adding to selling pressure during the bearish continuation.

Analysis are provided by InstaForex.

Read More https://ifxpr.com/3u9ozCm
Best regards, PR Manager

Learn more about InstaForex Company at http://instaforex.com
IFX Gertrude
 
Posts: 5198
Joined: Wed Nov 07, 2012 6:25 am

Re: Instaforex Analysis

Postby IFX Gertrude » Mon Nov 13, 2023 12:44 am

Forecast for EUR/USD on November 13, 2023

On Friday, the euro rebounded for the fourth time from the MACD indicator line with the lower shadow of the daily candle. Visually, the price has risen further, this might be real, which means that the Fibonacci ray is just around 1.0764.

Image

A break above this mark makes it possible for the pair to aim for 1.0834. If the price manages to settle below Friday's low (simultaneously below the MACD line), the euro will head towards the lower Fibonacci ray at around 1.0490.

Image

On the 4-hour chart, the price found strong support from the MACD line. The Marlin oscillator is rising, and its signal line is approaching the border of the uptrend territory. Under these conditions, the main scenario is that the price will rise to 1.0764.

Analysis are provided by InstaForex.

Read More https://ifxpr.com/3u8fFF7
Best regards, PR Manager

Learn more about InstaForex Company at http://instaforex.com
IFX Gertrude
 
Posts: 5198
Joined: Wed Nov 07, 2012 6:25 am

Re: Instaforex Analysis

Postby IFX Gertrude » Tue Nov 14, 2023 2:10 am

AUDUSD H4 I Continue to Support?

Image

The AUD/USD chart currently shows a bearish momentum with key levels to watch. The 1st support at 0.6324 (overlap and 78.60% Fibonacci Retracement) signifies a historical buying level. The 2nd support at 0.6275 is a swing low support. On the resistance side, the 1st resistance at 0.6392 (overlap) may block further upside, and the 2nd resistance at 0.6436 (50% Fibonacci Retracement) could serve as strong resistance.

Analysis are provided by InstaForex.

Read More https://ifxpr.com/3ucmZQn
Best regards, PR Manager

Learn more about InstaForex Company at http://instaforex.com
IFX Gertrude
 
Posts: 5198
Joined: Wed Nov 07, 2012 6:25 am

Re: Instaforex Analysis

Postby IFX Gertrude » Wed Nov 15, 2023 1:47 am

Forecast for GBP/USD on November 15, 2023

GBP/USD:
After sharply rising on Tuesday, the British pound decided to take a break in the consolidation range of September 7-13 at 1.2447-1.2524. During this pause, the Marlin oscillator's signal line will discharge slightly and then be ready to continue the ascent.

Image

Once the price surpasses 1.2524, the target will be 1.2617. Next is 1.2745, the peak of August 30. If the price falls below the nearest price channel line at 1.2415, it will significantly complicate the correction. The bulls must close above 1.2447.

Image

On the 4-hour chart, the correction is also looming. The Marlin oscillator's signal line sharply turned down, but apparently, this was so that the price would not fall below the critical support after the oscillator. After a consolidation, we expect the price to continue rising.

Analysis are provided by InstaForex.

Read More https://ifxpr.com/3QHw9vs
Best regards, PR Manager

Learn more about InstaForex Company at http://instaforex.com
IFX Gertrude
 
Posts: 5198
Joined: Wed Nov 07, 2012 6:25 am

Re: Instaforex Analysis

Postby IFX Gertrude » Thu Nov 16, 2023 1:24 am

Analysis of Gold for November 16, 2023 - Key resistance cluster on the test

Image

Gold has been trading sideways at the price of $1.961 but I found that key resistance sat the prie of $1.970 is on the test.

In case of the rejection of the key resistance cluster, I see potetnial for the further downside movement towards lower references at $1.948 and $1.921.

In case of the upside breakout of the resistance cluster and hold above, there is the chance for the rally towards $2.003

RSI oscillator is showing reading above 50, which is sign that buyers are in control.

Analysis are provided by InstaForex.

Read More https://ifxpr.com/3QGfXL5
Best regards, PR Manager

Learn more about InstaForex Company at http://instaforex.com
IFX Gertrude
 
Posts: 5198
Joined: Wed Nov 07, 2012 6:25 am

Re: Instaforex Analysis

Postby IFX Gertrude » Fri Nov 17, 2023 12:18 am

Forecast for USD/JPY on November 17, 2023

USD/JPY:
On the daily chart, the yen is coiling around the price channel line within a wide range but has not been able to settle above or below this line. Let's see if the price can do this today. If it consolidates below the price channel line, the price will try to challenge the support levels at 150.00 and the MACD line at 149.65. Overcoming the MACD line not only opens up the nearest target at 148.18 but also paves the way for a decline in the medium-term (140.93).

Image

A day closing with a white candle, followed by Monday's close above the price channel line, provides the opportunity to overcome the target level of 151.95 and the price can rise to 153.25. This scenario does not look weak, as the Marlin oscillator is ready to repeat the bullish reversal from the zero line.

Image

On the 4-hour chart, the price is forming a triangle pattern. If this is a triangle, we can expect at least one more upward movement. If this is not a potential triangle, a bearish breakout may follow. Also, take note that the price is progressing below both indicator lines, and the Marlin oscillator is in the bearish territory. Keep an eye on the price's behavior at the levels of 150.00 and 149.65.

Analysis are provided by InstaForex.

Read More https://ifxpr.com/49DqQGd
Best regards, PR Manager

Learn more about InstaForex Company at http://instaforex.com
IFX Gertrude
 
Posts: 5198
Joined: Wed Nov 07, 2012 6:25 am

Re: Instaforex Analysis

Postby IFX Gertrude » Mon Nov 20, 2023 12:14 am

Forecast for EUR/USD on November 20, 2023

EUR/USD:
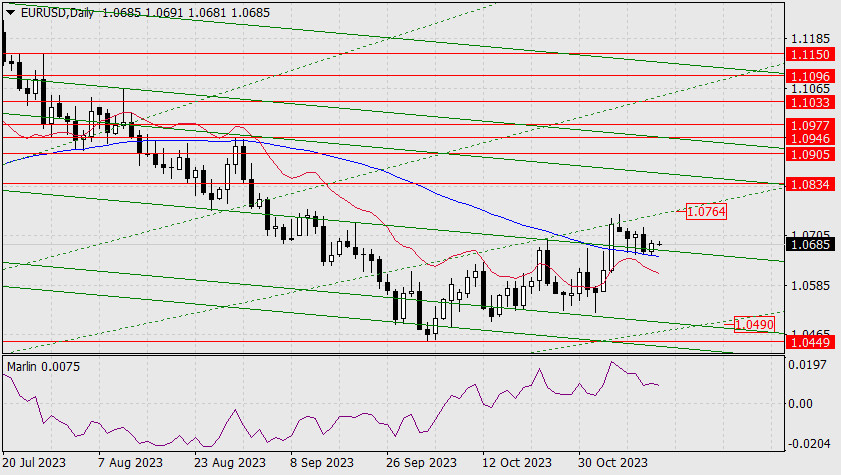
After fluctuating for some time, the euro rose on Friday, gaining more than 60 pips. It reached the target level of 1.0905. The signal line of the Marlin oscillator is turning upward towards the upper band of the ascending channel.

Image

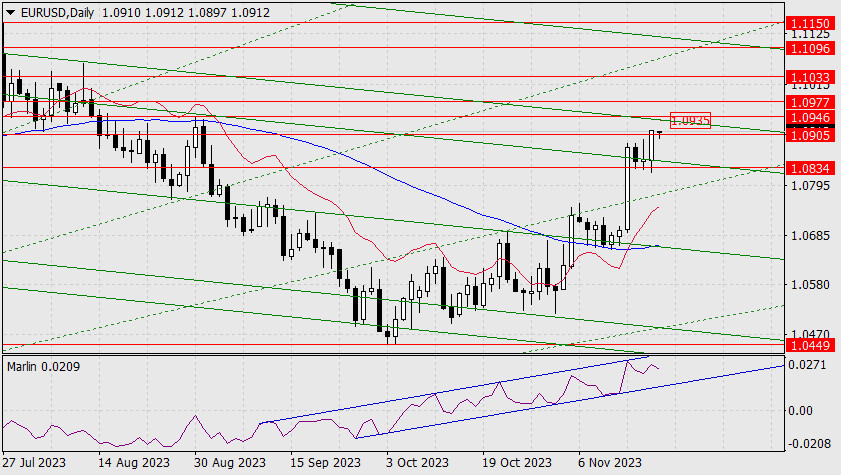
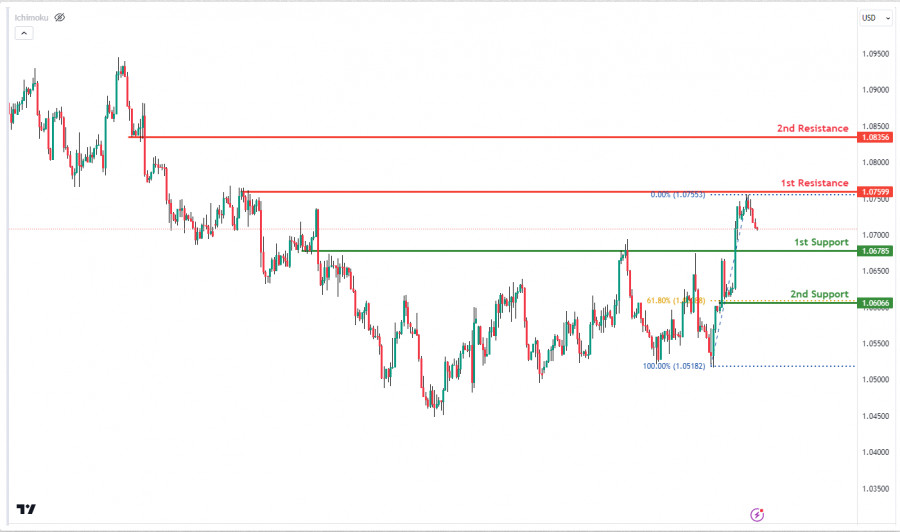
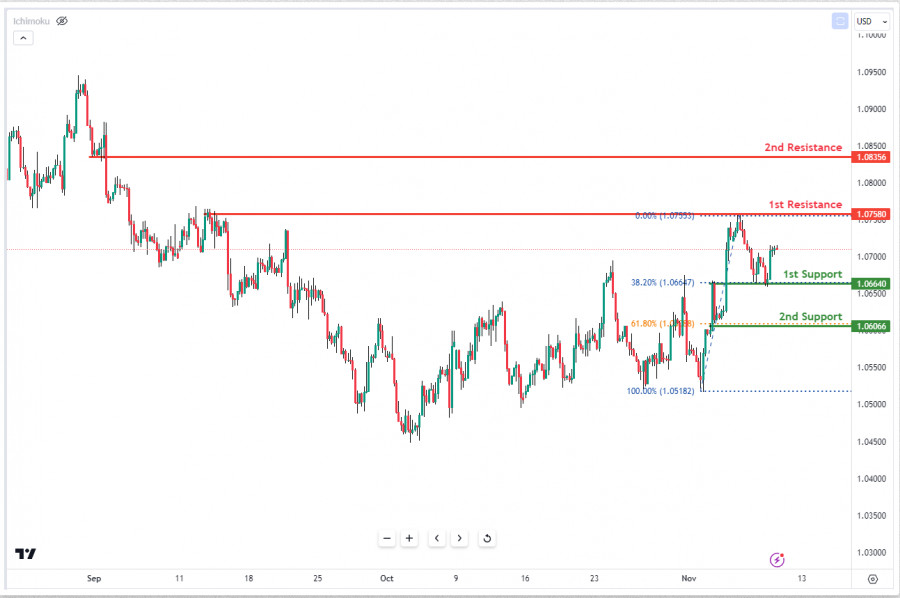
There is a high probability of a synchronous downward reversal of the Marlin oscillator from both the channel's boundary and the price from any target level (1.0946, 1.0977). Today, the price has been falling, so the pair can only show a stable upward movement if the price returns above 1.0905.

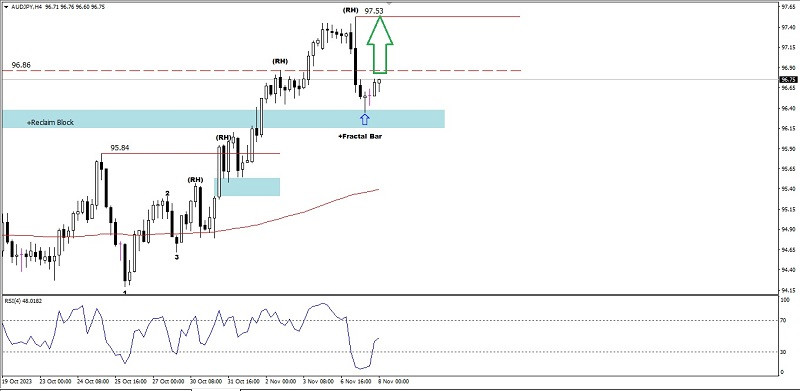
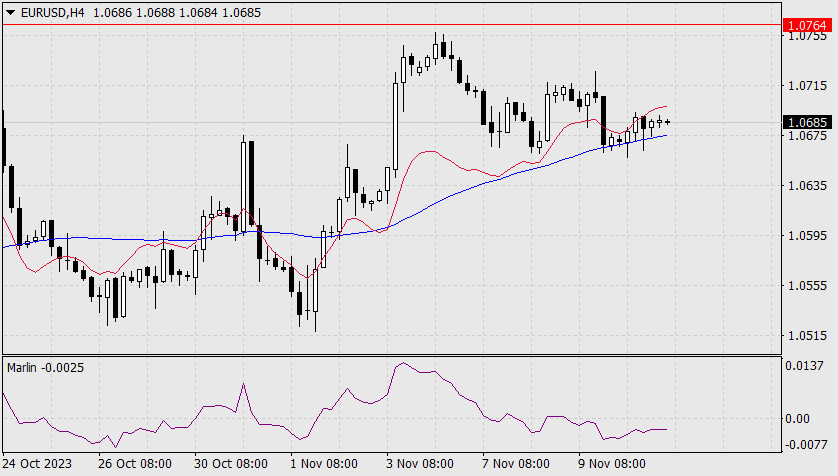
On the 4-hour chart, the price is rising, slightly pausing at 1.0905. But the potential divergence, when it forms, will indicate a more significant corrective decline.

Image

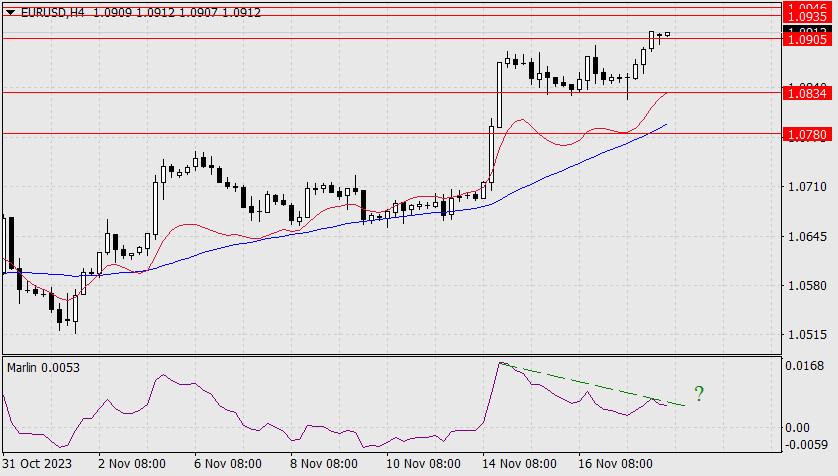
Once the correction ends, we expect the price to continue rising towards the level of 1.1096, considering the intermediate resistances at 1.0935/46, 1.0977, 1.1033.

Analysis are provided by InstaForex.

Read More https://ifxpr.com/3Rgr7Id
Best regards, PR Manager

Learn more about InstaForex Company at http://instaforex.com
IFX Gertrude
 
Posts: 5198
Joined: Wed Nov 07, 2012 6:25 am

PreviousNext

Return to Forex Brokers


cron