Instaforex Analysis

Forex broker related topics and discussions

Re: Instaforex Analysis

Postby IFX Gertrude » Tue Oct 24, 2023 12:51 am

XAUUSD H4 I Reacting off Resistance?

Image

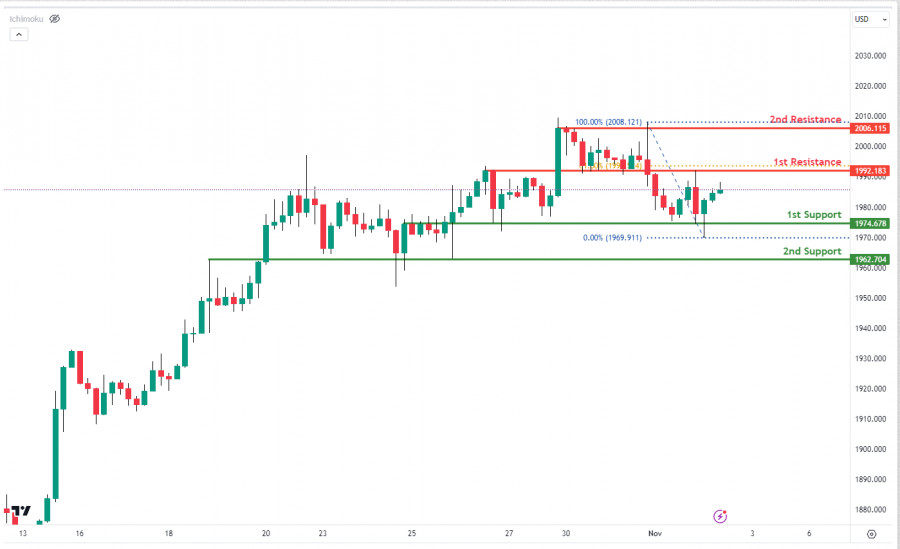
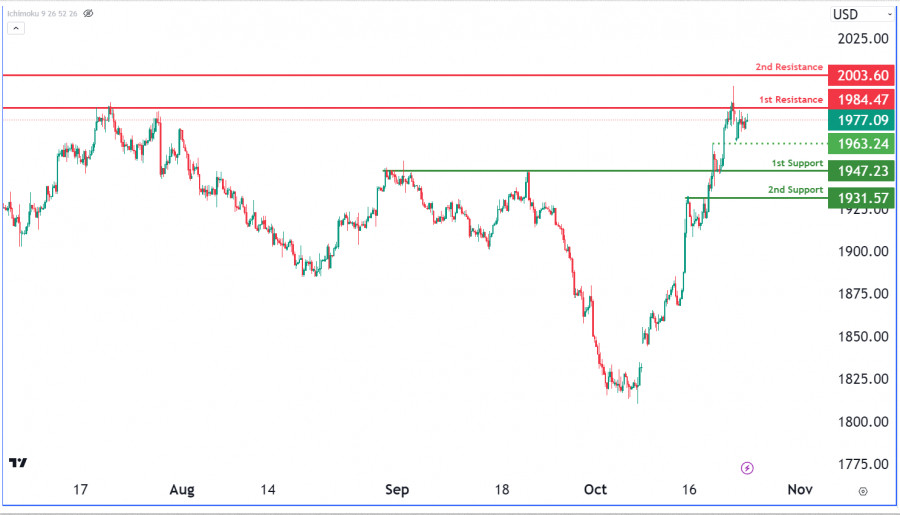
The XAU/USD chart currently shows bearish momentum, suggesting potential further decline towards the 1st support at 1947.23, which aligns with an overlap support. The 2nd support at 1931.57 adds to this bearish outlook as a pullback support.

On the resistance side, the 1st resistance at 1984.47 has historically acted as a strong barrier to upward movement, and the 2nd resistance at 2003.60 could provide additional resistance. An intermediate support level at 1963.24 might offer a temporary pause in the bearish trend

Analysis are provided by InstaForex.

Read More https://ifxpr.com/46NVFq4
Best regards, PR Manager

Learn more about InstaForex Company at http://instaforex.com
IFX Gertrude
 
Posts: 5198
Joined: Wed Nov 07, 2012 6:25 am

Re: Instaforex Analysis

Postby IFX Gertrude » Wed Oct 25, 2023 1:11 am

GBPUSD H4 | Bearish Continuation Expected?

Image

The GBP/USD chart currently shows bearish momentum with potential for a bearish continuation towards the 1st support at 1.2106, which aligns with a multi-swing low support. The 2nd support at 1.2049, also a multi-swing low support, adds to its significance as it coincides with the 127.20% Fibonacci Extension level. On the resistance side, the 1st resistance at 1.2270 is characterized as an overlap resistance, while the 2nd resistance at 1.2340 is marked as a swing high resistance.

Analysis are provided by InstaForex.

Read More https://ifxpr.com/406qiV3
Best regards, PR Manager

Learn more about InstaForex Company at http://instaforex.com
IFX Gertrude
 
Posts: 5198
Joined: Wed Nov 07, 2012 6:25 am

Re: Instaforex Analysis

Postby IFX Gertrude » Thu Oct 26, 2023 1:17 am

USDCAD H4 I Heading into resistance?

Image

The USD/CAD chart currently displays bullish overall momentum, with the potential scenario of a bullish continuation towards the 1st resistance level.

The 1st resistance level at 1.3848 is identified as a swing-high resistance that aligns with the 127.20% Fibonacci extension level. Higher up, the 2nd resistance level at 1.3919 is marked as a resistance level that aligns with the 161.80% Fibonacci extension level.

To the downside, the 1st support level at 1.3786 is identified as a pullback support. Further below, the 2nd support level at 1.3736 is noted as an overlap support, potentially acting as a strong support zone.

Analysis are provided by InstaForex.

Read More https://ifxpr.com/3s5BBA7
Best regards, PR Manager

Learn more about InstaForex Company at http://instaforex.com
IFX Gertrude
 
Posts: 5198
Joined: Wed Nov 07, 2012 6:25 am

Re: Instaforex Analysis

Postby IFX Gertrude » Fri Oct 27, 2023 2:45 am

Elliott wave analysis of EUR/USD for October 27, 2023

Image

After a minor correction from 1.0695, EUR/USD is ready for the next push higher towards at least 1.0805 and most likely above here too. In the long term, we are looking for EUR/USD to move towards 1.2085 as the next major upside target as wave 3 gathers strength.

Support remains seen near 1.0521 for the next push above 1.0695.

Analysis are provided by InstaForex.

Read More https://ifxpr.com/3MeCkpF
Best regards, PR Manager

Learn more about InstaForex Company at http://instaforex.com
IFX Gertrude
 
Posts: 5198
Joined: Wed Nov 07, 2012 6:25 am

Re: Instaforex Analysis

Postby IFX Gertrude » Mon Oct 30, 2023 1:15 am

USDJPY Day I Reacting off resistance level?

Image

USD/JPY displays bearish momentum, potentially heading towards the 1st support at 144.94, which aligns with overlap support. On the resistance front, the 1st resistance at 150.30, marked as a multi-swing high resistance, may hinder further upward movement. A 2nd resistance at 152.72, coinciding with the 100% Fibonacci Projection, adds to its potential as a significant resistance zone.

Analysis are provided by InstaForex.

Read More https://ifxpr.com/3sbMhgJ
Best regards, PR Manager

Learn more about InstaForex Company at http://instaforex.com
IFX Gertrude
 
Posts: 5198
Joined: Wed Nov 07, 2012 6:25 am

Re: Instaforex Analysis

Postby IFX Gertrude » Tue Oct 31, 2023 12:36 am

USDJPY H4 I Falling to support level?

Image

USD/JPY indicates bearish momentum with a potential bearish reaction near the 1st resistance at 149.50, leading to a possible decline to the 1st support at 148.92. The 1st support is reinforced by overlap support, while the 2nd support at 148.42 adds further strength to this support zone.

On the resistance side, the 1st resistance at 149.50 is significant due to overlap resistance and the 38.20% Fibonacci Retracement, potentially impeding upward movement. The 2nd resistance at 149.97 presents challenges with overlap resistance, the 78.60% Fibonacci Projection, and the 61.80% Fibonacci Retracement, signifying a strong resistance area.

Analysis are provided by InstaForex.

Read More https://ifxpr.com/47dB7qM
Best regards, PR Manager

Learn more about InstaForex Company at http://instaforex.com
IFX Gertrude
 
Posts: 5198
Joined: Wed Nov 07, 2012 6:25 am

Re: Instaforex Analysis

Postby IFX Gertrude » Wed Nov 01, 2023 12:45 am

Forecast for GBP/USD on November 1, 2023

GBP/USD Yesterday, the British pound tried to move towards the target range of 1.2271/87 but stopped by the balance line on the daily chart, just as it was on October 24th. Afterwards, the price returned below the descending price channel line. The signal line of the Marlin oscillator came close to the border of the bearish territory.

Image

In case the Federal Reserve shows a softer stance, the price may reach some bullish targets (1.2271/87, 1.2400). However, the current situation lowers the chances of growth, which warns the speculative nature of the moment. If the price settles below 1.2070, it will likely fall towards 1.1880.

Image

On the 4-hour chart, the price has settled below the balance and MACD indicator lines after a false bullish breakout. The Marlin oscillator has also returned to the bearish territory. As a result of the FOMC meeting, the pound may weaken.

Analysis are provided by InstaForex.

Read More https://ifxpr.com/40lTLdx
Best regards, PR Manager

Learn more about InstaForex Company at http://instaforex.com
IFX Gertrude
 
Posts: 5198
Joined: Wed Nov 07, 2012 6:25 am

Re: Instaforex Analysis

Postby IFX Gertrude » Thu Nov 02, 2023 12:36 am

XAUUSD H4 | Neutral Momentum?

Image

The XAU/USD chart currently shows a neutral overall momentum, indicating a lack of a strong directional trend. In this scenario, the price is expected to fluctuate between the 1st support at 1974.67 (overlap support) and the 1st resistance at 1992.18 (overlap resistance). These levels are significant, with the support potentially attracting buyers at 1974.67 and the resistance posing a hurdle for further price gains. The 2nd support at 1962.70 (overlap support) and the 2nd resistance at 2006.11 (multi-swing high resistance) further reinforce these potential support and resistance zones.

Analysis are provided by InstaForex.

Read More https://ifxpr.com/3QI3yHZ
Best regards, PR Manager

Learn more about InstaForex Company at http://instaforex.com
IFX Gertrude
 
Posts: 5198
Joined: Wed Nov 07, 2012 6:25 am

Re: Instaforex Analysis

Postby IFX Gertrude » Fri Nov 03, 2023 1:05 am

USDCHF H4 I Falling to Support level?

Image

The USD/CHF chart shows bearish momentum with potential movement towards the 1st support at 0.9032, a pullback support strengthened by the 61.80% Fibonacci Retracement. The 2nd support at 0.8982, considered an overlap support, adds to its significance as a potential buying area.

On the resistance side, the 1st resistance at 0.9111, an overlap resistance, might attract selling interest. The 2nd resistance at 0.9177, a multi-swing high resistance, could strongly impede upward movement. Traders should closely watch these levels, given the overall bearish chart bias.

Analysis are provided by InstaForex.

Read More https://ifxpr.com/49n7fK8
Best regards, PR Manager

Learn more about InstaForex Company at http://instaforex.com
IFX Gertrude
 
Posts: 5198
Joined: Wed Nov 07, 2012 6:25 am

Re: Instaforex Analysis

Postby IFX Gertrude » Mon Nov 06, 2023 3:04 am

EURUSD Day I Rising toward resistance level?

Image

The EUR/USD chart currently demonstrates bullish momentum, suggesting the potential for an upward move towards the 1st resistance. The 1st support at 1.0674, associated with the 23.60% Fibonacci Retracement level, may attract buying interest as a significant level. On the resistance side, the 1st resistance at 1.0765, linked to the 38.20% Fibonacci Retracement level, could pose as a level of selling pressure due to its overlap resistance nature. The 2nd resistance at 1.0858, related to the 50% Fibonacci Retracement level, further reinforces its significance as a potential obstacle to upward price movement.

Analysis are provided by InstaForex.

Read More https://ifxpr.com/3suXEAm
Best regards, PR Manager

Learn more about InstaForex Company at http://instaforex.com
IFX Gertrude
 
Posts: 5198
Joined: Wed Nov 07, 2012 6:25 am

PreviousNext

Return to Forex Brokers


cron