Instaforex Analysis

Forex broker related topics and discussions

Re: Instaforex Analysis

Postby IFX Gertrude » Wed Aug 02, 2023 1:02 am

Forecast for GBP/USD on August 2, 2023

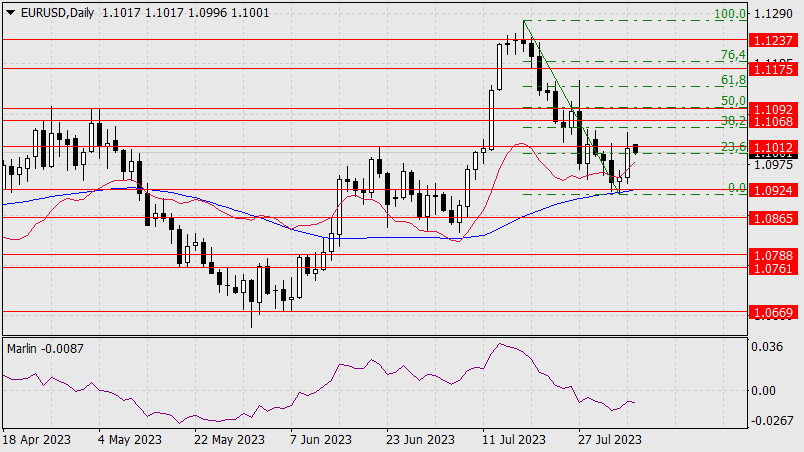
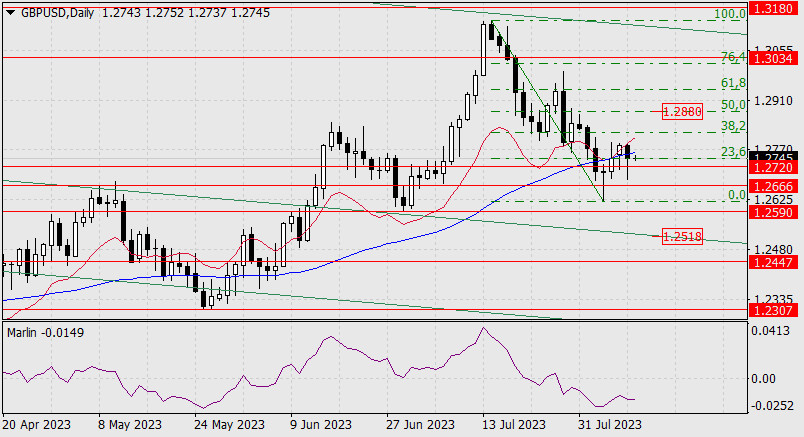
GBP/USD Pound's decline slowed, which led to the MACD line rising above the target level of 1.2720. The balance line also turned upwards.

Image

If sellers remain inactive today or tomorrow, a correction may occur to one of the Fibonacci levels: 1.2893, 1.2940, 1.2988.

So, for further decline to develop, the pair needs to overcome not only yesterday's low, which coincides with the MACD line, but also the target level of 1.2720.

Image

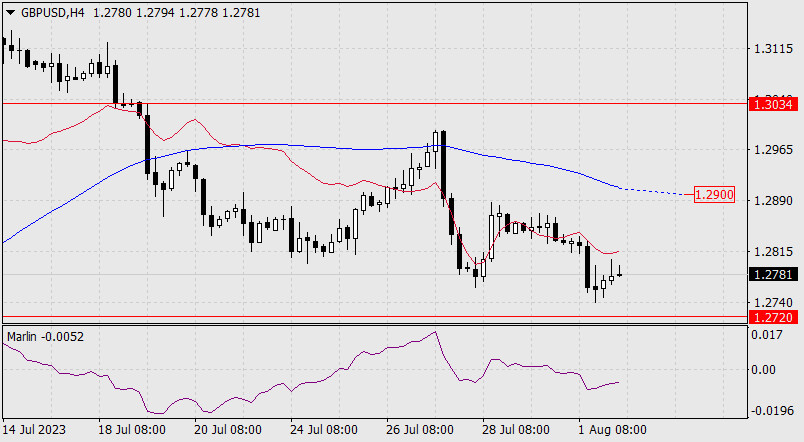
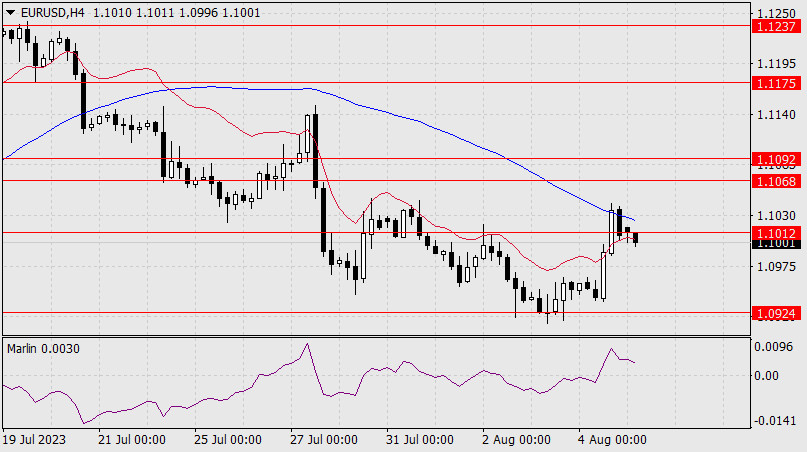
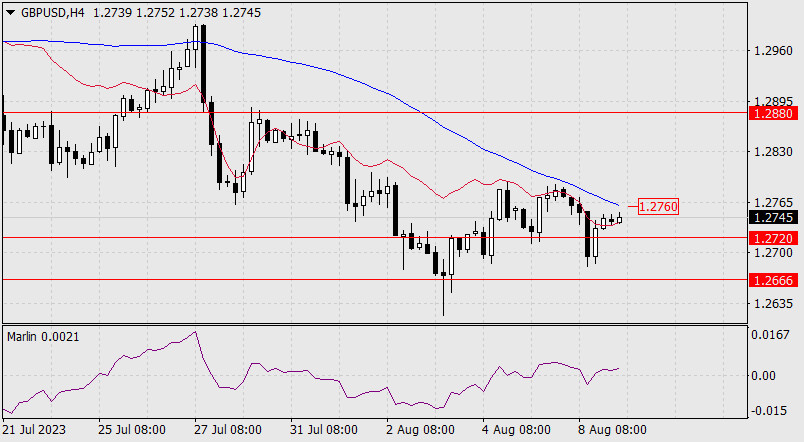
On the four-hour chart, the pair trades below the balance line. The Marlin oscillator slipped into negative territory, while the MACD line gave another landmark for an upward correction - 1.2900.

Not far from this lies the 38.2% retracement level - 1.2893.

Despite the bearish trend, the pair has all the opportunities to rise above 1.2720.

Analysis are provided by InstaForex.

Read More https://ifxpr.com/3QpZXyi
Best regards, PR Manager

Learn more about InstaForex Company at http://instaforex.com
IFX Gertrude
 
Posts: 5198
Joined: Wed Nov 07, 2012 6:25 am

Re: Instaforex Analysis

Postby IFX Gertrude » Thu Aug 03, 2023 1:39 am

NZD/USD, H4 | Will the Kiwi finally find support?

Image

The NZD/USD pair is displaying a bearish trend, suggesting a potential fall towards the first support at 0.6065 which is an overlap support that aligns close to the -27.20% Fibonacci expansion level. If price continues to fall further, the second support level is at 0.5994 which is swing-low support. To the upside, the first resistance at 0.6132 is an overlap resistance while the second resistance at 0.6221 is a swing-high resistance.

Analysis are provided by InstaForex.

Read More https://ifxpr.com/45dsDio
Best regards, PR Manager

Learn more about InstaForex Company at http://instaforex.com
IFX Gertrude
 
Posts: 5198
Joined: Wed Nov 07, 2012 6:25 am

Re: Instaforex Analysis

Postby IFX Gertrude » Fri Aug 04, 2023 12:22 am

USDCAD, H4 | Potential falling to 1st support?

Image

The USD/CAD pair is exhibiting a bearish trend, suggesting potential movement towards the 1st support level at 1.3270, a key point due to its status as a pullback support and the 50% Fibonacci retracement level. If broken, the 2nd support at 1.3253, a multi-swing low support, could act as a floor. If the trend reverses and the price rises, the 1st resistance level at 1.3377, a swing high resistance, could pose a challenge. A breakthrough here might face the 2nd resistance at 1.3447, an overlap resistance that could hamper bullish momentum.

Analysis are provided by InstaForex.

Read More https://ifxpr.com/3OF6G6i
Best regards, PR Manager

Learn more about InstaForex Company at http://instaforex.com
IFX Gertrude
 
Posts: 5198
Joined: Wed Nov 07, 2012 6:25 am

Re: Instaforex Analysis

Postby IFX Gertrude » Mon Aug 07, 2023 1:34 am

Forecast for EUR/USD on August 7, 2023

EUR/USD:
Friday's US employment data for July came out positive. Nonfarm payrolls increased 187,000 in July, average hourly earnings rose 0.4%, and the unemployment rate declined from 3.6% to 3.5%, even after June's increase of 209,000 got revised lower to 185,000 while the labor force participation rate remained unchanged at 62.6%.

Image

The price closed the day with a 58-pip gain, failing to reach both the target level of 1.1068 or the Fibonacci correction level of 38.2%. Trading volume was high, so the euro may develop upward movement. The signal line of the Marlin oscillator has turned upwards, and the border of the bullish territory is nearby.

Image

On the four-hour chart, the upward movement ended at the MACD line, afterwards the price returned below the resistance level of 1.1012. The Marlin oscillator is in the positive territory, indicating that the euro is likely to take a breather before it grows further.

Analysis are provided by InstaForex.

Read More https://ifxpr.com/44V8wWd
Best regards, PR Manager

Learn more about InstaForex Company at http://instaforex.com
IFX Gertrude
 
Posts: 5198
Joined: Wed Nov 07, 2012 6:25 am

Re: Instaforex Analysis

Postby IFX Gertrude » Tue Aug 08, 2023 12:40 am

EURUSD, H4 | Overall Neutral Momentum?

Image

The EUR/USD chart currently shows a neutral overall momentum, lacking a clear directional trend. The price of the currency pair has the potential to fluctuate between the 1st resistance and the 1st support level. The 1st support level at 1.0959 is considered a pullback support, offering a buying opportunity during market retracements, and it gains significance from its alignment with a 61.80% Fibonacci retracement level.

Additionally, the 2nd support level at 1.0917, identified as an overlap support, may also attract buyers' interest and provide further support during price declines. Conversely, the 1st resistance at 1.1040 acts as an overlap resistance, coinciding with a 50% Fibonacci retracement level, potentially limiting upward movement and attracting selling pressure. An intermediate resistance level at 1.1003 adds to the potential resistance points in the price movement. Moreover, the observed chart pattern is a symmetrical triangle, indicating consolidation before a possible breakout or breakdown. A break above the upper trendline suggests a bullish breakout, while a break below the lower trendline indicates a bearish breakdown.

Analysis are provided by InstaForex.

Read More https://ifxpr.com/3DNQ5ak
Best regards, PR Manager

Learn more about InstaForex Company at http://instaforex.com
IFX Gertrude
 
Posts: 5198
Joined: Wed Nov 07, 2012 6:25 am

Re: Instaforex Analysis

Postby IFX Gertrude » Wed Aug 09, 2023 1:15 am

Forecast for GBP/USD on August 9, 2023

GBP/USD Over the past two days, we observed that the British pound falsely settled above the MACD indicator line (and above the 23.6% Fibonacci level) on Monday. Then it made a false breakout to the downside on Tuesday, narrowly missing the target support level at 1.2666.

Image

This morning, the price is returning above the 23.6% Fibonacci level. Surpassing yesterday's peak at 1.2784 opens up the target for further corrective growth towards 1.2880 (50.0%). If the price solidifies below 1.2720, it opens up the target at 1.2666. Afterwards, it can further fall towards 1.2590.

Image

On the four-hour chart, the price is trying to overcome the resistance of the MACD line. It's aided by the Marlin oscillator, which is already in the positive territory. The price only needs to settle above 1.2760. It has a 60% chance at growth.

Analysis are provided by InstaForex.

Read More https://ifxpr.com/3OvGf1F
Best regards, PR Manager

Learn more about InstaForex Company at http://instaforex.com
IFX Gertrude
 
Posts: 5198
Joined: Wed Nov 07, 2012 6:25 am

Re: Instaforex Analysis

Postby IFX Gertrude » Thu Aug 10, 2023 12:26 am

USDCHF, H4 | React off Resistance level?

Image

The USD/CHF chart currently exhibits a bearish momentum, indicating a continuing downward trend. In light of this bearish sentiment, there's a likelihood of the price extending its decline towards the 1st support level at 0.8718, which gains importance due to its alignment as an overlap support. Additionally, reinforcement to the support structure comes from a secondary support at 0.8678. Conversely, attention is directed towards the 1st resistance level at 0.8776, marked by its classification as a multi-swing high resistance, potentially obstructing upward movement. Furthermore, a 2nd resistance at 0.8824 is identified as a pullback resistance, intensifying its potential to hinder price advancement.

Analysis are provided by InstaForex.

Read More https://ifxpr.com/3DM8pAB
Best regards, PR Manager

Learn more about InstaForex Company at http://instaforex.com
IFX Gertrude
 
Posts: 5198
Joined: Wed Nov 07, 2012 6:25 am

Re: Instaforex Analysis

Postby IFX Gertrude » Fri Aug 11, 2023 4:09 am

USDJPY, H4 | React off Resistance level?

Image

The current USD/JPY chart reflects a bearish momentum, indicating an ongoing downward trend. In light of this momentum, there is a possibility that the price might react bearishly upon reaching the 1st resistance level, potentially leading to a decline towards the 1st support. The significance of the 1st support at 143.81 is highlighted as it serves as an overlap support and is further reinforced by a 38.20% Fibonacci Retracement. Similarly, the 2nd support at 142.78 is identified as an overlap support and aligns with a 61.80% Fibonacci Retracement. On the contrary, the 1st resistance level at 144.86 gains importance as a multi-swing high resistance. This level gains additional strength from its alignment with a 61.80% Fibonacci Projection and a 161.80% Fibonacci Extension, adding to its potential as a resistance level.

Analysis are provided by InstaForex.

Read More https://ifxpr.com/3Ow7Tvx
Best regards, PR Manager

Learn more about InstaForex Company at http://instaforex.com
IFX Gertrude
 
Posts: 5198
Joined: Wed Nov 07, 2012 6:25 am

Re: Instaforex Analysis

Postby IFX Gertrude » Mon Aug 14, 2023 12:03 am

USDCHF, Day | React off Resistance level?

Image

The USD/CHF chart is displaying a strong downward trend, indicating bearish momentum.

With this bearish view, there's a possibility of a negative price reaction near the first resistance level, potentially leading to a decline towards the first support level.

The significance of the initial support at 0.8558 is due to its role as a support level marked by multiple swing lows. Also, a secondary support at 0.8312 adds to the overall support structure.

Conversely, the primary resistance level at 0.8769 is notable for aligning with a resistance point observed in earlier data.

Furthermore, a secondary resistance at 0.8902 is recognized as a potential pullback point, potentially introducing resistance against upward movement.

Analysis are provided by InstaForex.

Read More https://ifxpr.com/3DWh6Zc
Best regards, PR Manager

Learn more about InstaForex Company at http://instaforex.com
IFX Gertrude
 
Posts: 5198
Joined: Wed Nov 07, 2012 6:25 am

Re: Instaforex Analysis

Postby IFX Gertrude » Tue Aug 15, 2023 12:18 am

Forecast of USD/JPY on August 15, 2023

USD/JPY The USD/JPY pair is approaching the target level of 145.90. The Marlin oscillator is gradually turning downwards on the daily chart, indicating a correction towards the nearest support level at 144.73. If the pair surpasses this mark, the next corrective target would be the MACD line at 143.97.

Image

If the price consolidates above 145.90, the pair might continue to rise to the nearest resistance of the global hyperchannel around the 147.90 mark. Beyond this level lies the 148.50 target. The bulls will probably aim for the 147.90-148.50 range next.

Image

The shorter timeframe shows us that the MACD line is approaching the support line of 144.73. This fact certainly supports the uptrend, reducing the risk of a deep correction. However, the Marlin oscillator, being a leading indicator, is not growing but gradually decreasing. We expect traders to struggle at the 144.73 level.

Analysis are provided by InstaForex.

Read More https://ifxpr.com/3KFslst
Best regards, PR Manager

Learn more about InstaForex Company at http://instaforex.com
IFX Gertrude
 
Posts: 5198
Joined: Wed Nov 07, 2012 6:25 am

PreviousNext

Return to Forex Brokers