Instaforex Analysis

Forex broker related topics and discussions

Re: Instaforex Analysis

Postby IFX Gertrude » Wed Jul 19, 2023 1:05 am

Forecast for EUR/USD on July 19, 2023

EUR/USD
Yesterday's US economic data did not push the dollar higher. Retail sales for June showed a 0.2% increase, while industrial production declined by 0.5%. The dollar was also hindered by surveys conducted among 109 economists, the majority of whom considered the July rate hike by the Federal Reserve as the last in the tightening cycle.

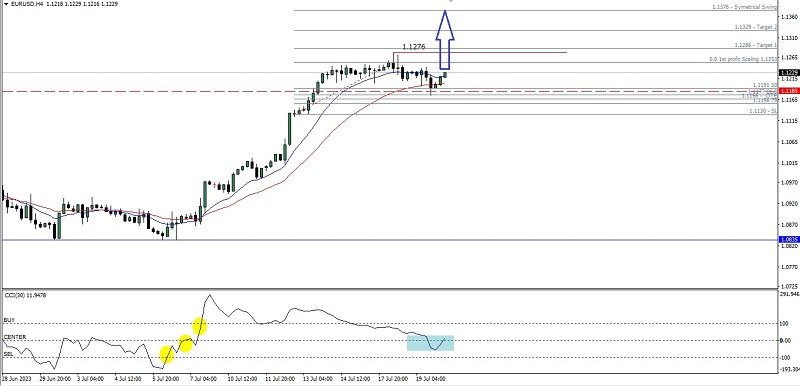
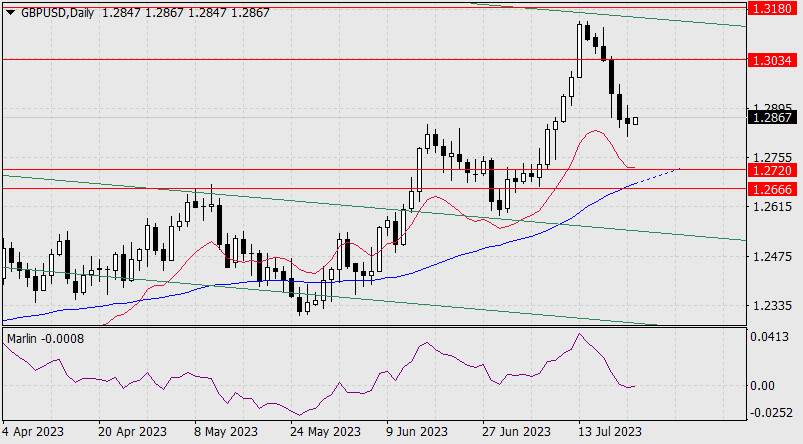
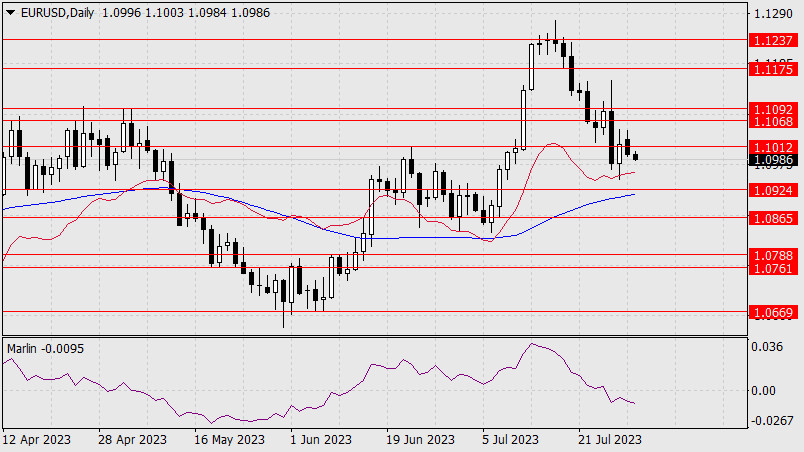
Today, the EU will release its inflation data, with a forecast of 5.5% YoY compared to 6.1% YoY in May. Good data may have an impact on European monetary policymakers. However, on the daily chart, the euro is consolidating below the resistance level of 1.1237, which, together with yesterday's attempt at growth, keeps the bulls' interest towards aiming for the 1.1320 level. The Marlin oscillator is steadily falling, which supports the notion of a downward movement.

Image

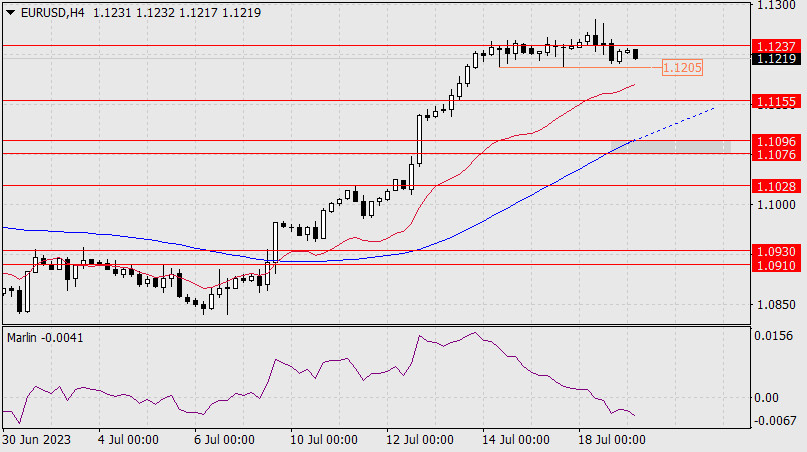
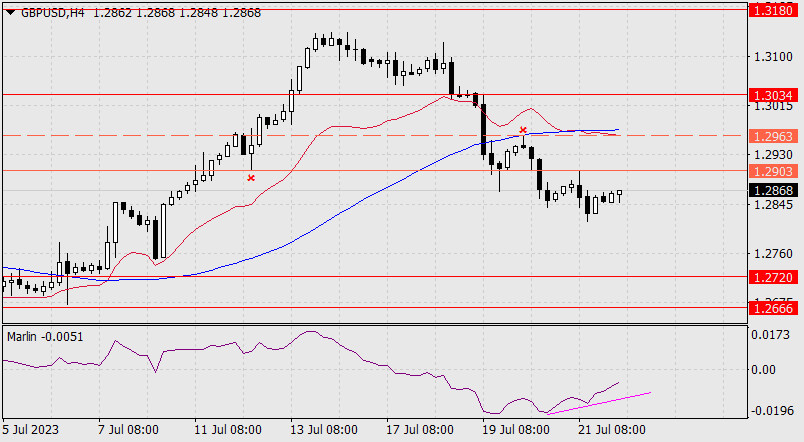
On the four-hour chart, the price is currently between the signal level of 1.1205 and the resistance level of 1.1237. Breaking through the signal level will allow the price to fall towards the target support level of 1.1155. The Marlin oscillator has moved into a downtrend territory, indicating the potential for short-term downward movement. The delay in the euro's fall has led to the MACD indicator line surpassing the target range of 1.1076/96 and heading towards 1.1155. This means that the focus is shifting from the support range to a higher level, from which it may reverse to the upside. Therefore, 1.1155 serves as a reference for the corrective decline.

Analysis are provided by InstaForex.

Read More https://ifxpr.com/3NWUV9B
Best regards, PR Manager

Learn more about InstaForex Company at http://instaforex.com
IFX Gertrude
 
Posts: 5198
Joined: Wed Nov 07, 2012 6:25 am

Re: Instaforex Analysis

Postby IFX Gertrude » Thu Jul 20, 2023 1:10 am

Technical Analysis of Intraday Price Movement of EUR/USD Main Currency Pairs, Thursday, July 20 2023

Image

If we look on its 4 hour chart, EUR/USD main currency pairs seems like Buyers still dominates where this things confirmed by EMA 12 & 26 which is still intersecting Golden Cross as well as indicator CCI which manages to break above its three levels and hold on to the level 0 which indicates that there is significant support based on these facts, in the near future Fiber has the potential to rally up to test the 1.1253 level. If this level is successfully broken up, then the 1.1276 level will be the main target to aim for and the 1.1329-1.1376 area level will be the next target to go for. However, all of these strengthening scenarios will cancel itself out if on the way the EUR/USD rally goes up towards the target levels, it is suddenly corrected downwards and breaks below the 1.1134 level because if this level is successfully broken down then all strengthening rally scenarios previously described will become invalid and cancel automatically.

Analysis are provided by InstaForex.

Read More https://ifxpr.com/3DmKXcS
Best regards, PR Manager

Learn more about InstaForex Company at http://instaforex.com
IFX Gertrude
 
Posts: 5198
Joined: Wed Nov 07, 2012 6:25 am

Re: Instaforex Analysis

Postby IFX Gertrude » Fri Jul 21, 2023 1:13 am

NZDUSD, H4 | Bounce off support level?

Image

The NZD/USD pair is in a bearish trend, breaking below an ascending support line and suggesting a potential continuation of the downward movement. The first support at 0.6189, aligned with the 61.8% Fibonacci retracement, could act as a price floor. If the price drops further, the second support at 0.6114, aligned with the 78.6% Fibonacci retracement, may provide strong resistance.

On the other hand, if the bearish momentum reverses, the price could face resistance at 0.6246, followed by a higher obstacle at 0.6305. These resistance levels have the potential to hinder the price's upward progress.

Analysis are provided by InstaForex.

Read More https://ifxpr.com/3Do9ApB
Best regards, PR Manager

Learn more about InstaForex Company at http://instaforex.com
IFX Gertrude
 
Posts: 5198
Joined: Wed Nov 07, 2012 6:25 am

Re: Instaforex Analysis

Postby IFX Gertrude » Mon Jul 24, 2023 12:46 am

Forecast for GBP/USD on July 24, 2023

GBP/USD:
On Friday, the British pound traded in a 43-pip range, slightly decreasing by the end of the day. The Marlin oscillator has entered the downward territory, strengthening the pound's potential to test the support level at 1.2666-1.2720.

Image

The MACD line has become significant within the mentioned range. The price will likely fall after breaking below Friday's low at 1.2815. On the four-hour chart, we can see that the price tested the nearest correction level at 1.2903 with the upper shadow on Friday. The price and oscillator convergence is gradually waning.

Image

If today's UK business activity gauge shows that the Manufacturing PMI is slowing down as expected, while the US Manufacturing PMI is getting stronger (forecast of 46.4 versus 46.3 in May), then the pound will likely fall towards the upper band of the target range at 1.2720.

Analysis are provided by InstaForex.

Read More https://ifxpr.com/44Oek3w
Best regards, PR Manager

Learn more about InstaForex Company at http://instaforex.com
IFX Gertrude
 
Posts: 5198
Joined: Wed Nov 07, 2012 6:25 am

Re: Instaforex Analysis

Postby IFX Gertrude » Tue Jul 25, 2023 1:15 am

Forex Analysis & Reviews: Forecast for AUD/USD on July 25, 2023

AUD/USD: The Australian Dollar, unlike other currencies, clearly indicates a potential decline in the US Dollar after the Federal Reserve's rate hike tomorrow. The signs include a price reversal at the approaching signal line of 0.6708 and a false break of the Marlin oscillator's signal line below the zero line.

Image

Currently, the Marlin oscillator is in positive territory. If the price breaks above the target range of 0.6783/98, there is potential for further growth towards the target level of 0.6940. On the other hand, if the price breaks below the signal level of 0.6708, it may aim to test the MACD line around 0.6643 with a perspective of declining to 0.6560.

Image

On the four-hour chart, the Marlin oscillator has moved into the upward territory, and the price shows an intention to enter the target range of 0.6783/98, which would also mean breaking above the MACD line. The FX market awaits the outcome of tomorrow's Fed meeting.

Analysis are provided by InstaForex


[url="https://ifxpr.com/471evKF"]Read More[/url]
Best regards, PR Manager

Learn more about InstaForex Company at http://instaforex.com
IFX Gertrude
 
Posts: 5198
Joined: Wed Nov 07, 2012 6:25 am

Re: Instaforex Analysis

Postby IFX Gertrude » Wed Jul 26, 2023 12:20 am

NZDUSD, H4 | React off Resistance level?

Image

The NZD/USD chart is currently trending bearish, with the price within a bearish Ichimoku cloud and below a major descending trend line, indicating potential further decline. The 1st support at 0.6166, a multi-swing low, and the 2nd at 0.6128, an overlap support and the 78.60% Fibonacci retracement, could halt the bearish run. Resistance levels are at 0.6221 and 0.6272, acting as overlap and pullback resistances respectively, potentially sparking selling pressure.

Analysis are provided by InstaForex.

Read More https://ifxpr.com/3pXi18l
Best regards, PR Manager

Learn more about InstaForex Company at http://instaforex.com
IFX Gertrude
 
Posts: 5198
Joined: Wed Nov 07, 2012 6:25 am

Re: Instaforex Analysis

Postby IFX Gertrude » Thu Jul 27, 2023 2:20 am

XAUUSD, H4 | React off Resistance level?

Image

XAU/USD exhibits a bullish momentum, potentially continuing towards the first resistance at 1985.73. The first support at 1967.08 is significant as an overlap support. The second support at 1953.30 is an overlap support, positioned at both the 38.20% Fibonacci retracement level and the 38.20% Fibonacci retracement level, indicating a Fibonacci confluence. Regarding resistance levels, the second resistance at 2006.41 is notable as a pullback resistance. An intermediate resistance at 1979.00 is recognized as a pullback resistance, positioned at both the 78.60% Fibonacci retracement level and the 61.80% Fibonacci projection level, indicating a Fibonacci confluence.

Analysis are provided by InstaForex.

Read More https://ifxpr.com/3QfDR1j
Best regards, PR Manager

Learn more about InstaForex Company at http://instaforex.com
IFX Gertrude
 
Posts: 5198
Joined: Wed Nov 07, 2012 6:25 am

Re: Instaforex Analysis

Postby IFX Gertrude » Fri Jul 28, 2023 1:34 am

XAUUSD, H4 | React off Resistance level?

Image

The XAU/USD pair is showing a bearish trend, potentially leading to a price drop from the 1st resistance level towards the 1st support at 1938.31, significant due to its pullback support and 50% Fibonacci retracement alignment. If the price breaches this level, the 2nd support at 1928.59, an overlap support and the 61.80% Fibonacci retracement level, is notable. Resistance levels are at 1954.07 (pullback) and 1968.24 (pullback), both likely hindrances for upward price movement.

Analysis are provided by InstaForex.

Read More https://ifxpr.com/3O6C0t8
Best regards, PR Manager

Learn more about InstaForex Company at http://instaforex.com
IFX Gertrude
 
Posts: 5198
Joined: Wed Nov 07, 2012 6:25 am

Re: Instaforex Analysis

Postby IFX Gertrude » Mon Jul 31, 2023 12:44 am

Forex Analysis & Reviews: Forecast for AUD/USD on July 31, 2023

AUD/USD
With a strong movement on Friday, the pair broke below the support of the MACD line on the daily scale. Although the Marlin oscillator slipped into negative territory, it reversed slightly, indicating a potential moderate correction in the pair. Nevertheless, if the quote surpasses Friday's low today, it will again break below the MACD line, sliding towards the level of 0.6560.

Image

A correction can be seen on the four-hour chart, with the pair trading between 0.6625 and 0.6718. The situation will remain uncertain until it exits this range.

Image

Alternatively, the pair could break above the upper boundary of the mentioned range and continue the correction towards the target range of 0.6783/98. The attempt of the Marlin oscillator to return to the positive territory will indicate the high probability of such a development.

Analysis are provided by InstaForex.

Read More https://ifxpr.com/47dim7G
Best regards, PR Manager

Learn more about InstaForex Company at http://instaforex.com
IFX Gertrude
 
Posts: 5198
Joined: Wed Nov 07, 2012 6:25 am

Re: Instaforex Analysis

Postby IFX Gertrude » Tue Aug 01, 2023 1:48 am

Forecast for EUR/USD on August 1, 2023

EUR/USD
Euro failed to approach the target range of 1.1068/92 yesterday, in part due to the large distance to cover and the technical resistance on lower timeframes. Key economic reports also came out rather weak, with Germany's retail sales for June showing a decrease of 0.8%. Meanwhile, the Chicago Business Activity Index for July increased from 41.5 to 42.8, collectively offsetting the eurozone's GDP growth for the 2nd quarter by 0.6% y/y (0.30% q/q).

Image

The political factor also intervened, as China decided to reduce the export of unmanned aerial vehicles to the US, citing national security reasons. Furthermore, the forecasts for key economic indicators in the US came out optimistic.

Currently, the price approaches the target level of 1.0924, along which the MACD line also converges. There may be a breakout around the speculative buying range of July 6-7, or a correction from the entire decline since July 18.

Image

On the four-hour timeframe, the balance indicator line capped yesterday's growth, pushing the price below 1.1012. The Marlin oscillator also fell under zero, showing a downward trend.

Analysis are provided by InstaForex.

Read More https://ifxpr.com/3KohBPk
Best regards, PR Manager

Learn more about InstaForex Company at http://instaforex.com
IFX Gertrude
 
Posts: 5198
Joined: Wed Nov 07, 2012 6:25 am

PreviousNext

Return to Forex Brokers