Instaforex Analysis

Forex broker related topics and discussions

Re: Instaforex Analysis

Postby IFX Gertrude » Wed Feb 14, 2024 12:44 am

Forex Analysis & Reviews: Forecast for EUR/USD on February 14, 2024

EUR/USD
Yesterday there was a strong shift away from risk; the S&P 500 -1.37%, copper -0.52%, but bond yields increased, and oil prices rose. On the one hand, this divergence fully corresponds to investors' expectations of a slowdown in the pace of Federal Reserve rate cuts due to yesterday's US inflation data – the core index held at 3.9% YoY against expectations of a decrease to 3.7% YoY, the US CPI decreased from 3.4% YoY to 3.1% YoY against expectations of 2.9% YoY, and investors' expectations for a rate cut shifted from May to June. On the other hand, earlier in the day, before the data was released, European stock markets and futures on the US stock market were falling, only accelerating with the release of the news. Perhaps the market will not return to the record high that was set by the S&P 500 on Monday, for a long time at that, and this is the beginning of a global crisis. Traditionally, we're waiting for a major company to announce bankruptcy to officially start the crisis. Last year, there were several major bankruptcies, but amid unbridled optimism, they went unnoticed. Now, markets are more attentive.
Image

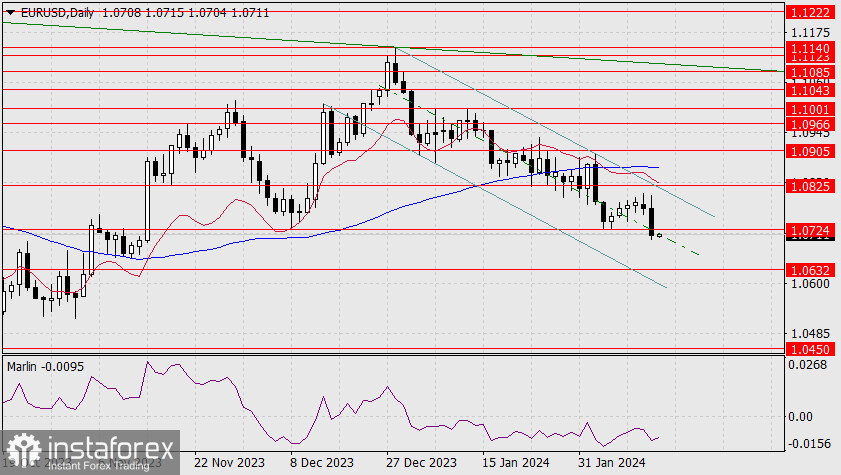
On the daily chart, the euro has crossed the midline of the descending price channel. The price has breached the support at 1.0724, so now it can aim for 1.0632. Surpassing this target would reveal a significantly lower one at 1.0450, the October 2023 low.
Image

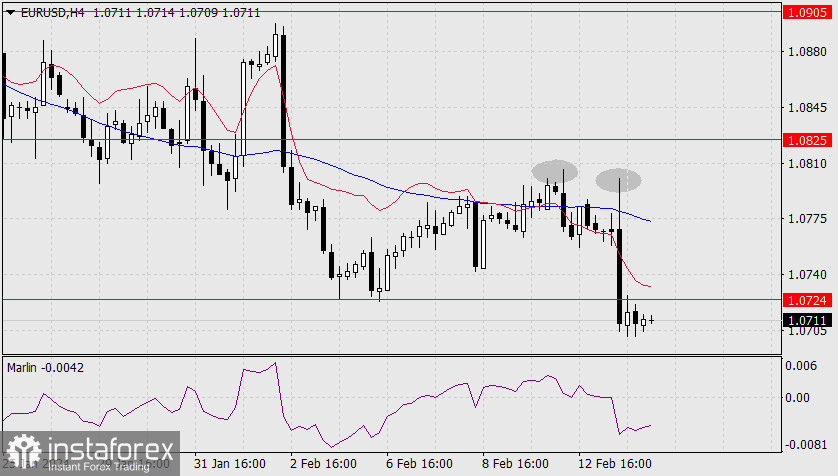
On the 4-hour chart, the price has settled below the target level of 1.0724. The Marlin oscillator has firmly settled in the downtrend territory. It is noteworthy that the decline occurred after a double false breakout above the MACD line (marked by ovals). This is a sign of the medium-term downward movement.

Analysis are provided by InstaForex.

Read More https://ifxpr.com/49qQWLW
Best regards, PR Manager

Learn more about InstaForex Company at http://instaforex.com
IFX Gertrude
 
Posts: 5198
Joined: Wed Nov 07, 2012 6:25 am

Re: Instaforex Analysis

Postby IFX Gertrude » Thu Feb 15, 2024 1:20 am

Forecast for EUR/USD on February 15, 2024

EUR/USD
The euro continues to closely follow the movements of the stock market. Yesterday, the S&P 500 index corrected from Tuesday's decline, showing a 0.96% increase. We outlined our main points in yesterday's review, so today, we are taking a wait-and-see position.

Image

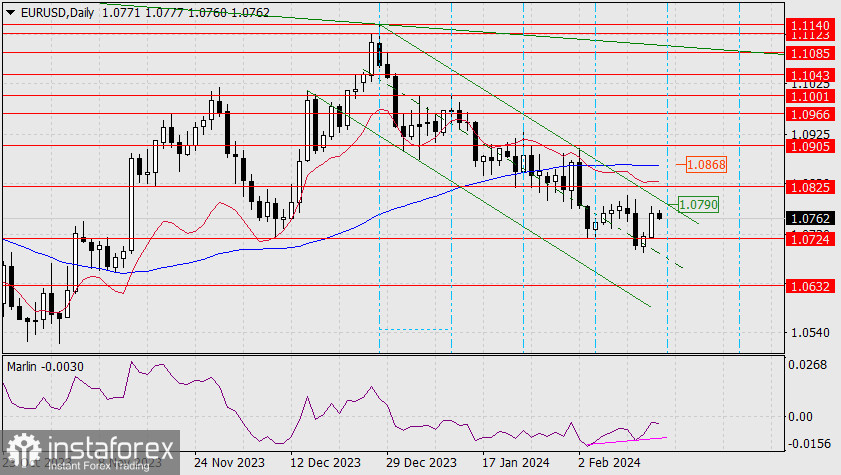
On the daily chart, the euro has shown moderate growth in the upper half of the descending price channel both yesterday and this morning. A small convergence has formed with the Marlin oscillator. Apparently, traders are not in a hurry to anticipate events, so the convergence will guide the euro into sideways movement, slightly above the support at 1.0724, where the price may gather strength to show a firm downward movement.

Image

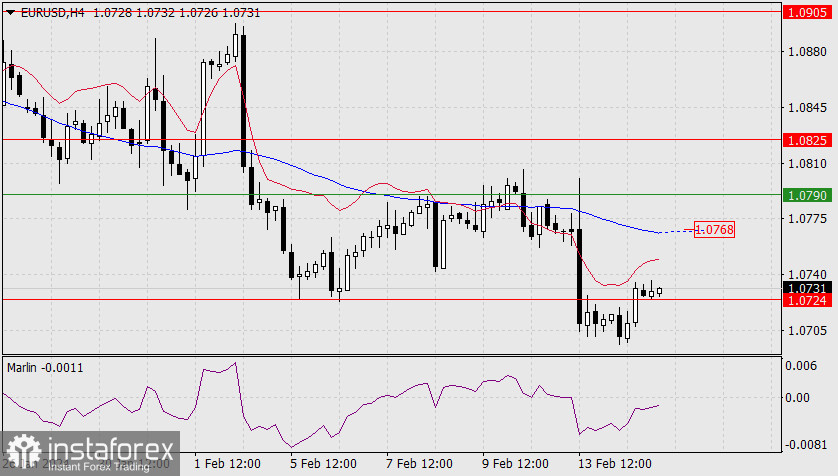
On the 4-hour chart, the price has already managed to consolidate above the level of 1.0724, but it is noticeably below the MACD indicator line (1.0768). Overcoming this line will allow the price to test the upper boundary of the daily price channel (1.0790). Only a break above the channel will postpone the euro's decline for an indefinite period.

Analysis are provided by InstaForex.

Read More https://ifxpr.com/3UIXeCs
Best regards, PR Manager

Learn more about InstaForex Company at http://instaforex.com
IFX Gertrude
 
Posts: 5198
Joined: Wed Nov 07, 2012 6:25 am

Re: Instaforex Analysis

Postby IFX Gertrude » Fri Feb 16, 2024 1:49 am

Forex Analysis & Reviews: Forecast for EUR/USD on February 16, 2024

EUR/USD
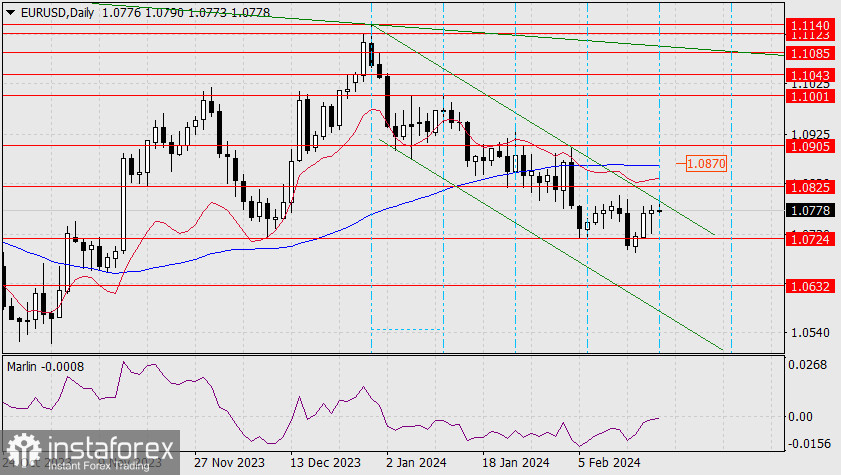
Yesterday, under the influence of the stock market (S&P 500 0.58%) and its own convergence, the euro rose by 44 pips. The upper boundary of the descending price channel at 1.0790 is nearby. A break above the channel will open the nearest target level at 1.0825. Then, assuming that the stock market will continue to rise, the euro may attempt to reach the MACD indicator line at 1.0868 on the daily chart.

Image

The stock market needs to rise by 0.39% to reach its record high set on February 12. If it manages to do so, it may rise by another 1.04% to reach the upper boundary of the global growing price channel since 2009. But we wouldn't count on the euro's growth until the S&P sets a new record high. If the euro breaks the support at 1.0724, the bears may try to bring the quote to the target level of 1.0632. We are waiting for progress.

Image

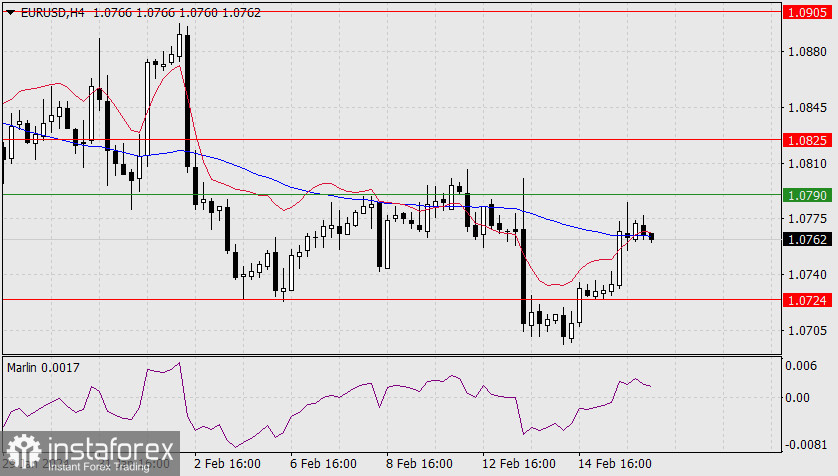
On the 4-hour chart, the price has risen above the balance and MACD indicator lines, and the Marlin oscillator has settled on its rising half. However, the main obstacle is the upper boundary of the price channel (1.0790), and it is quite difficult to overcome this while we're facing a downward trend. Perhaps the main events will unfold next week. And if you look at such a tool as cyclic lines on the daily chart, you can see a reversal moment on Monday.

Analysis are provided by InstaForex.

Read More https://ifxpr.com/3TaI5Zv
Best regards, PR Manager

Learn more about InstaForex Company at http://instaforex.com
IFX Gertrude
 
Posts: 5198
Joined: Wed Nov 07, 2012 6:25 am

Re: Instaforex Analysis

Postby IFX Gertrude » Mon Feb 19, 2024 1:25 am

Forex Analysis & Reviews: Forecast for EUR/USD on February 19, 2024

EUR/USD
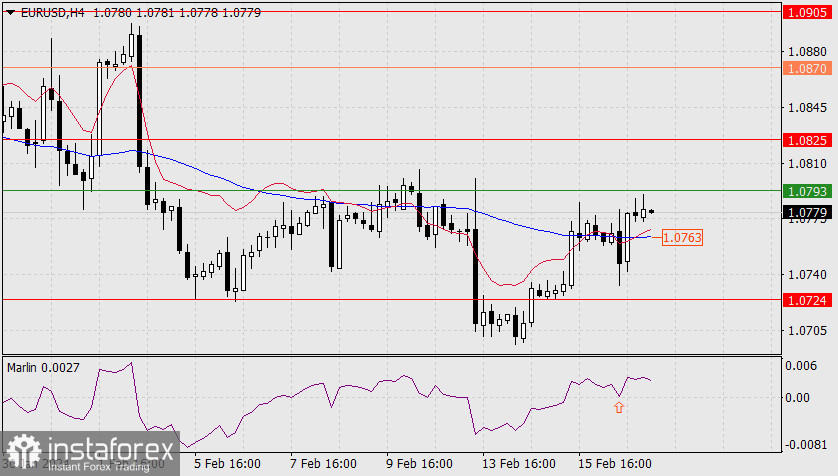
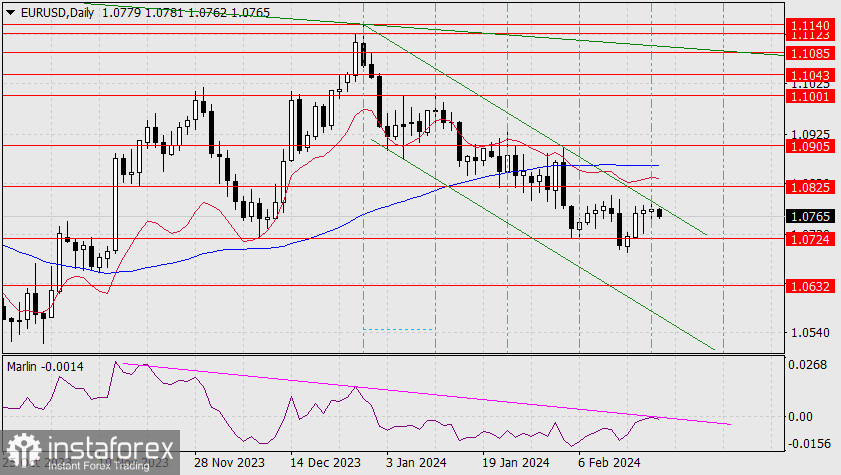
Last Friday, due to the decline in the stock market, the euro failed to develop a full-fledged upward movement, closing the day up by 5 pips. This morning, the euro is trying to rise without external influence, but technically, the price has reached the intersection point of the upper boundary of the descending price channel and the cyclical line, from which a bearish trend reversal is expected. Also, the signal line of the Marlin oscillator has reached the border of the uptrend territory, and a reversal may occur from this line.

Image

Thus, the main scenario is the euro will fall through the nearest support at 1.0724 to the target level of 1.0632. Possibly even lower, to the lower boundary of the price channel, around the target level of 1.0440 (the 2023 low). If the price breaks above the upper boundary of the price channel at 1.0793, the channel will be invalidated, and the price will continue to rise to the nearest target level of 1.0825 with the goal of attacking the MACD line around the 1.0870 mark.

Image

On the 4-hour chart, the price has settled above the balance and MACD indicator lines, and Marlin is growing in the positive territory after bouncing off the zero line. The growth seems deceptive, especially since the stock market has not yet come into play. If the price returns below the MACD line (1.0763), this may bring back the bearish scenario. Today, the US and Canadian markets are closed for a holiday.

Analysis are provided by InstaForex.


Read More https://ifxpr.com/3T3St4Y
Best regards, PR Manager

Learn more about InstaForex Company at http://instaforex.com
IFX Gertrude
 
Posts: 5198
Joined: Wed Nov 07, 2012 6:25 am

Re: Instaforex Analysis

Postby IFX Gertrude » Tue Feb 20, 2024 1:52 am

Forex Analysis & Reviews: Forecast for EUR/USD on February 20, 2024

EUR/USD
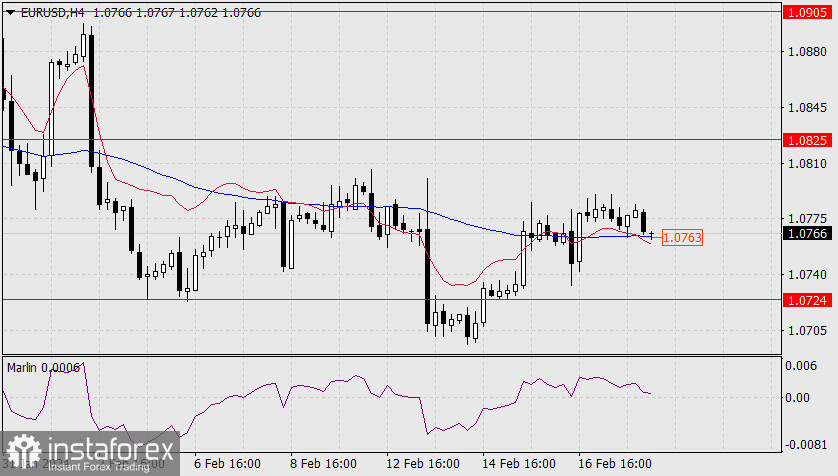
The euro is starting to form a bearish reversal exactly along the cyclical line with a period of 9 daily bars. The upper line of the descending price channel is still undeveloped, but this option is also acceptable during reversals.

Image

The signal line of the Marlin oscillator is also turning down without reaching the zero line, but at the same time it is sensitive to the upper resistance line. The final confirmation that the euro will fall is when the price breaches the support at 1.0724. After that, the target will be 1.0632.

Image

On the 4-hour chart, the first signal for a downward movement is when the price falls below the MACD line (1.0763). It is very likely that at this moment, the Marlin oscillator will enter the downtrend territory. This will be a good pattern for creating the momentum to reach the support at 1.0724.

Analysis are provided by InstaForex.

Read More https://ifxpr.com/3uEq1gJ
Best regards, PR Manager

Learn more about InstaForex Company at http://instaforex.com
IFX Gertrude
 
Posts: 5198
Joined: Wed Nov 07, 2012 6:25 am

Re: Instaforex Analysis

Postby IFX Gertrude » Wed Feb 21, 2024 1:13 am

Forex Analysis & Reviews: Forecast for GBP/USD on February 21, 2024

GBP/USD
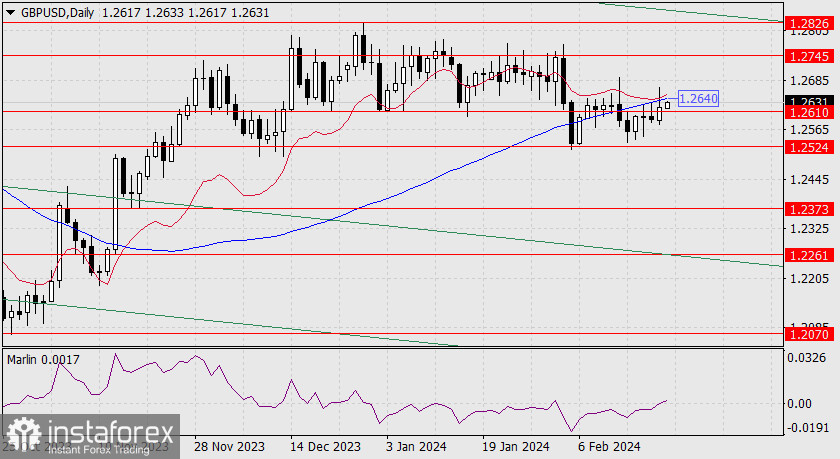
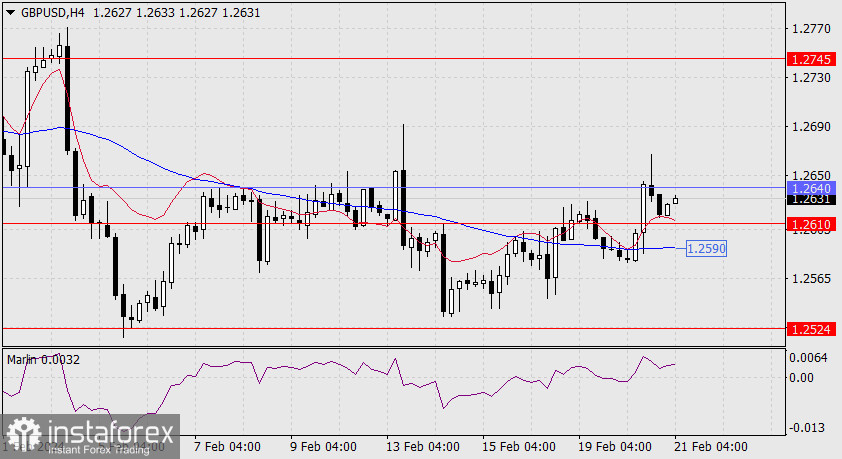
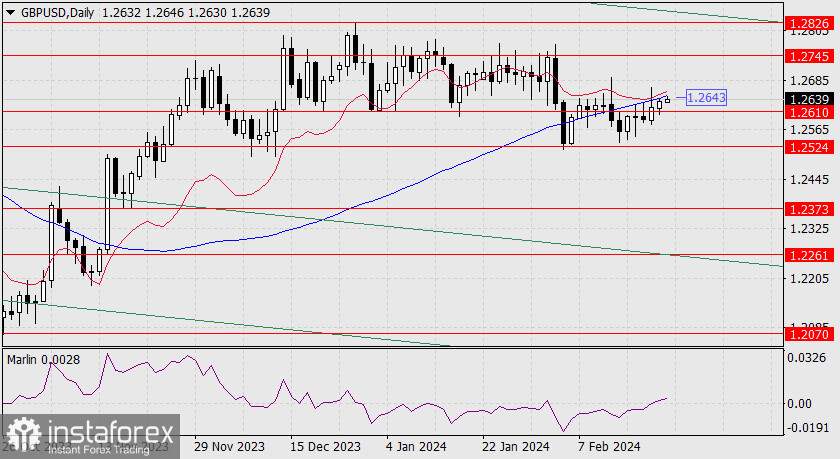
Yesterday, the price surpassed the resistance of the target level at 1.2610, as well as both indicator lines. Afterward, it retreated, and the pound closed the day with a 29-pip gain. The Marlin oscillator entered the growth territory.

Image

However, as long as the price doesn't settle above the MACD line (1.2640), there is a high probability of a reversal from the resistance levels it reached. Marlin can also turn down from the zero line. If the price consolidates below 1.2610, the target will be 1.2524. Consolidating above 1.2640 will allow the price to rise to the level of 1.2745 – the peak of August 30, 2023.

Image

The price has covered a distance of 50 pips from yesterday's high to its current quote, approaching the support at 1.2610. A break below will make it possible to attack the MACD line in the 4-hour chart (1.2590). Consolidating below it opens the target level at 1.2524.

Analysis are provided by InstaForex.

Read More https://ifxpr.com/3uIrVwN
Best regards, PR Manager

Learn more about InstaForex Company at http://instaforex.com
IFX Gertrude
 
Posts: 5198
Joined: Wed Nov 07, 2012 6:25 am

Re: Instaforex Analysis

Postby IFX Gertrude » Thu Feb 22, 2024 1:51 am

Forex Analysis & Reviews: Forecast for GBP/USD on February 22, 2024

GBP/USD
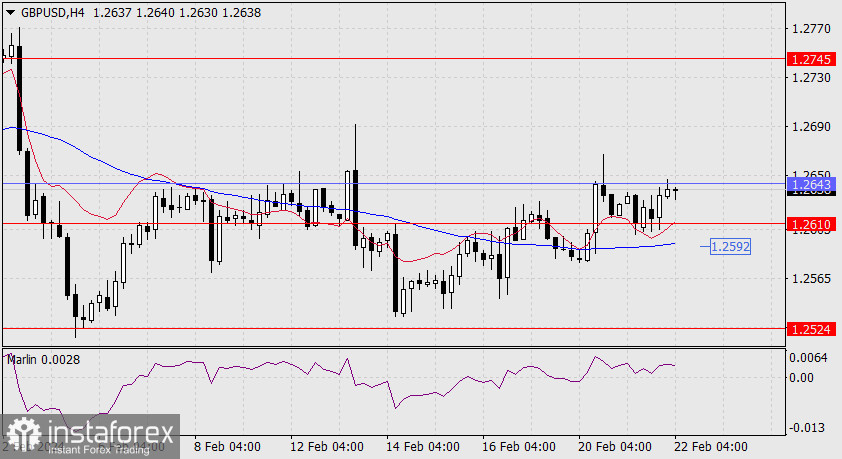
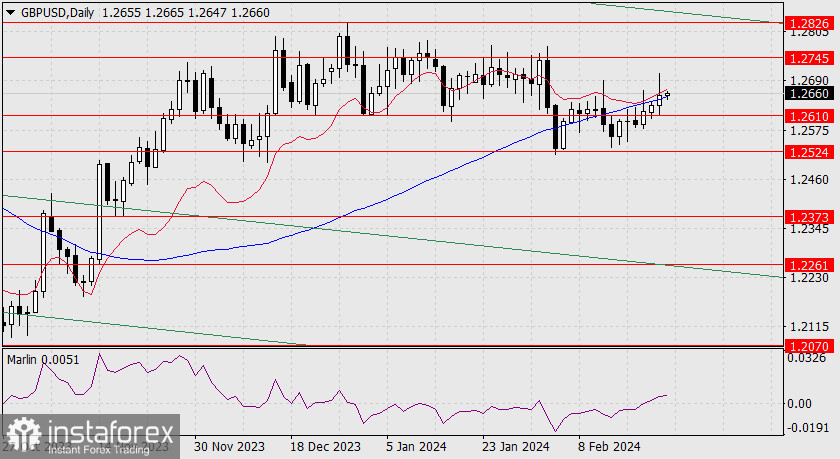
Yesterday, the British pound only rose by 15 pips, but it accomplished an important task for the bulls - it consolidated above the level of 1.2610. So now it is much easier to overcome the MACD line. It will succeed once the price overcomes the February 20th peak (1.2667). After that, the next target will be 1.2745.

Image

The Marlin oscillator is stable in the uptrend territory and it continues to rise further. A reversal below 1.2610 will be a sign of the bulls' weakness, despite all the positive signs that it received.

Image

On the 4-hour chart, we can see a consolidation above 1.2610 while the price is struggling with the MACD line on the daily timeframe. The Marlin oscillator moved up in the bullish territory. But once the price overcomes the support of the MACD line (1.2592), this will confirm a bearish breakthrough and it will mark the bears' victory in the current situation.

Analysis are provided by InstaForex.

Read More https://ifxpr.com/4bN5Ca4
Best regards, PR Manager

Learn more about InstaForex Company at http://instaforex.com
IFX Gertrude
 
Posts: 5198
Joined: Wed Nov 07, 2012 6:25 am

Re: Instaforex Analysis

Postby IFX Gertrude » Fri Feb 23, 2024 12:55 am

Forex Analysis & Reviews: Forecast for GBP/USD on February 23, 2024

GBP/USD
Yesterday, the composite PMI index for the UK increased to 53.30 in February from 52.90 in January of 2024. The British pound, also influenced by external markets, gained 22 pips. The intraday growth was 74 pips, but the price could not break out of the grids of the indicator lines in the daily timeframe.

Image

The signal line of the Marlin oscillator is growing in the positive territory, but visually it is getting weaker. In order to rise to the nearest target of 1.2745, the price must close today with a white candle to settle above the MACD line. To realize the opposite scenario, the quote must overcome the support of 1.2610. We are waiting for Monday.

Image

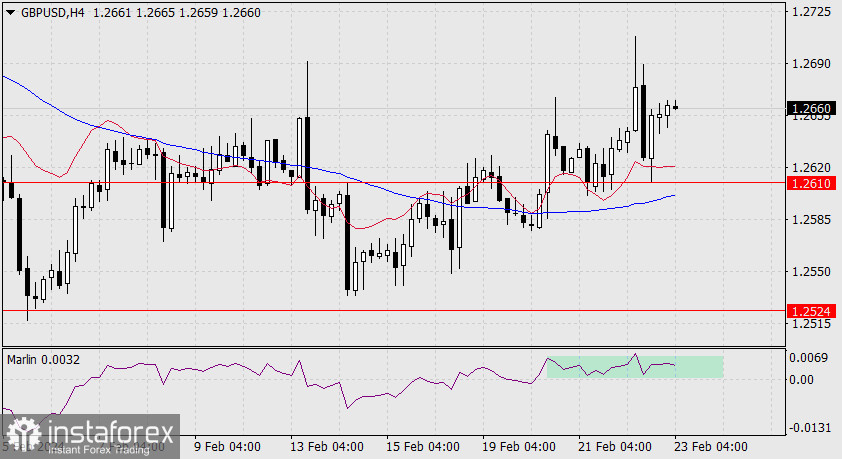
On the 4-hour chart, the price has settled and is rising above both indicator lines. However, the Marlin oscillator moves horizontally, in a sideways range. The uptrend is getting weaker, and it is better to wait for the start of next week.

Analysis are provided by InstaForex.

Read More https://ifxpr.com/49qQugL
Best regards, PR Manager

Learn more about InstaForex Company at http://instaforex.com
IFX Gertrude
 
Posts: 5198
Joined: Wed Nov 07, 2012 6:25 am

Re: Instaforex Analysis

Postby IFX Gertrude » Mon Feb 26, 2024 12:30 am

FOREX ANALYSIS & REVIEWS: FORECAST FOR AUD/USD ON FEBRUARY 26, 2024

AUD/USD
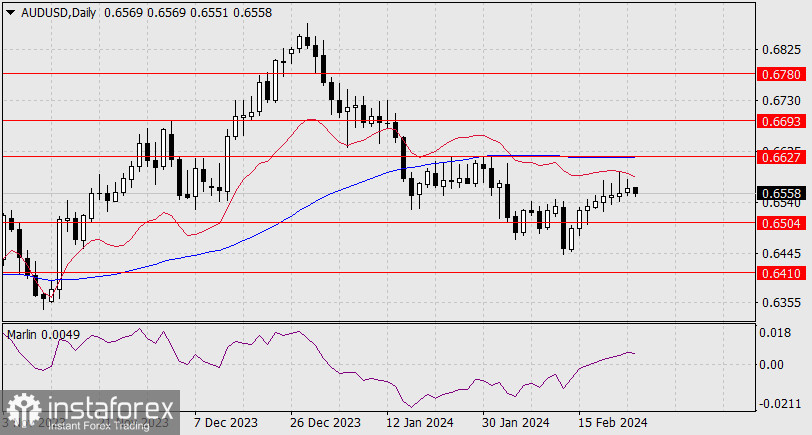
A reversal started in AUD/USD after the test of the balance indicator line on the daily chart. The Marlin oscillator moving towards the positive area also reflects this scenario. Most likely, the pair will decline when the price drops below the support level of 0.6504 and head towards 0.6410.

Image

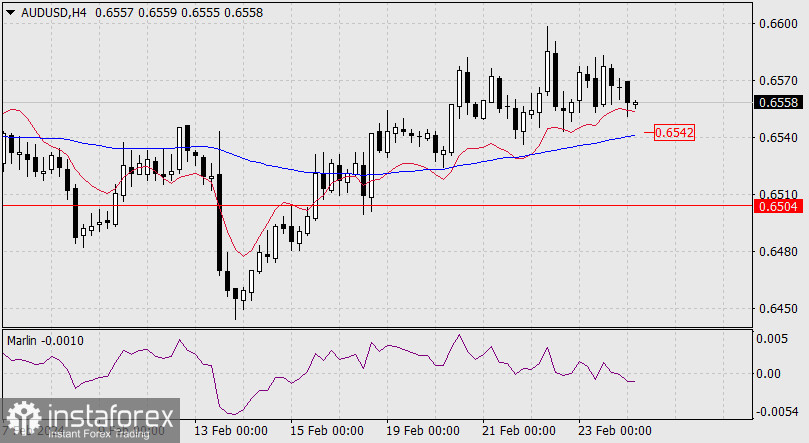
On the four-hour chart, the fall below the MACD line and 0.6542 indicates an impending downward movement. The Marlin oscillator also turned downward.

Image

Today, data on new home sales in the US will be released, with an expected growth of 2.41%. If the data turns out to be weaker than expected, stock indices will decline and, along with them, AUD/USD.

Analysis are provided by InstaForex.

Read More https://ifxpr.com/48xMIAW
Best regards, PR Manager

Learn more about InstaForex Company at http://instaforex.com
IFX Gertrude
 
Posts: 5198
Joined: Wed Nov 07, 2012 6:25 am

Re: Instaforex Analysis

Postby IFX Gertrude » Tue Feb 27, 2024 1:31 am

FOREX ANALYSIS & REVIEWS: FORECAST FOR EUR/USD ON FEBRUARY 27, 2024

EUR/USD
S&P500 decreased by 0.38%, while the dollar index declined by 0.20%, thanks to a slight increase in government bond yields. Investors also expressed some confusion over the lack of agreements in Congress on the budget, which could lead to another partial government shutdown (starting from March 1). If the shutdown occurs, it will not necessarily lead to an automatic decline in dollar. Most likely, it will strengthen in the medium term as a safe-haven currency amid the decline in stock markets.

Image

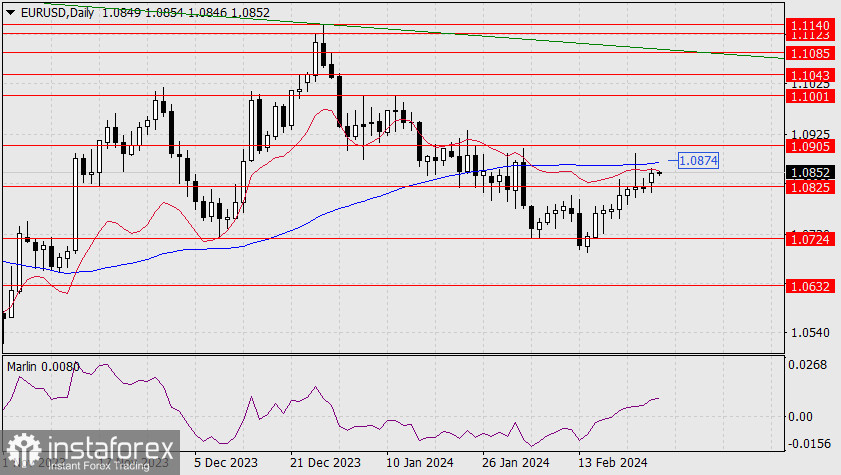
On the daily chart, yesterday's rise in euro halted because of the balance line. The signal line of the Marlin oscillator also turned downward slightly. If the price settles below 1.0825, the pair will move towards 1.0724. EUR/USD faces obstacles not only from the indicator lines but also from the target level of 1.0905. It needs to successfully surpass the level to continue the movement towards the target level of 1.1001 (peak on January 11).

Image

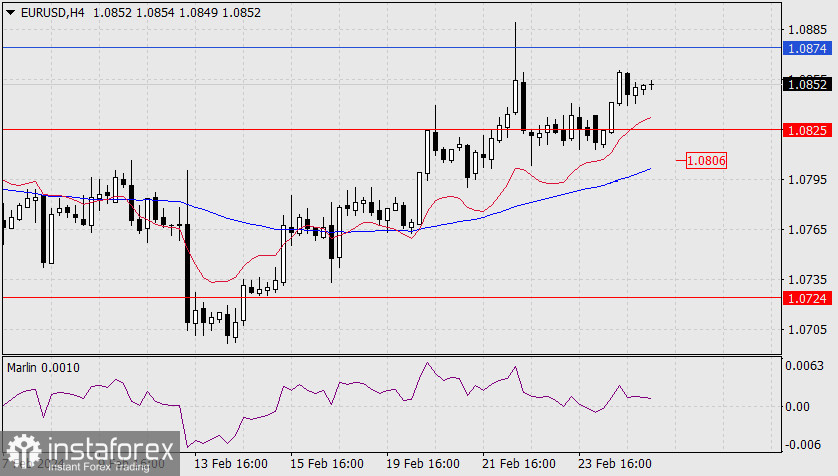
On the four-hour chart, the Marlin oscillator continues to experience pressure and may soon shift downward. However, the price remains above the indicator lines, so the pair may not decline yet. A downward move will occur only when the price settles below the support at 1.0825 and falls under the MACD line support at 1.0806, which coincides with the peak from February 12.

Analysis are provided by InstaForex.

Read More https://ifxpr.com/3wDlJGU
Best regards, PR Manager

Learn more about InstaForex Company at http://instaforex.com
IFX Gertrude
 
Posts: 5198
Joined: Wed Nov 07, 2012 6:25 am

PreviousNext

Return to Forex Brokers