'' Hawkmoon wrote: there are a few pairs still displaying strong directional bias out there at the moment & among them is AUD/USD.
this pair is one of a few i am focusing on & there are two close S&R zones that i am looking to take more entery's from.
Hi Hawkmoon
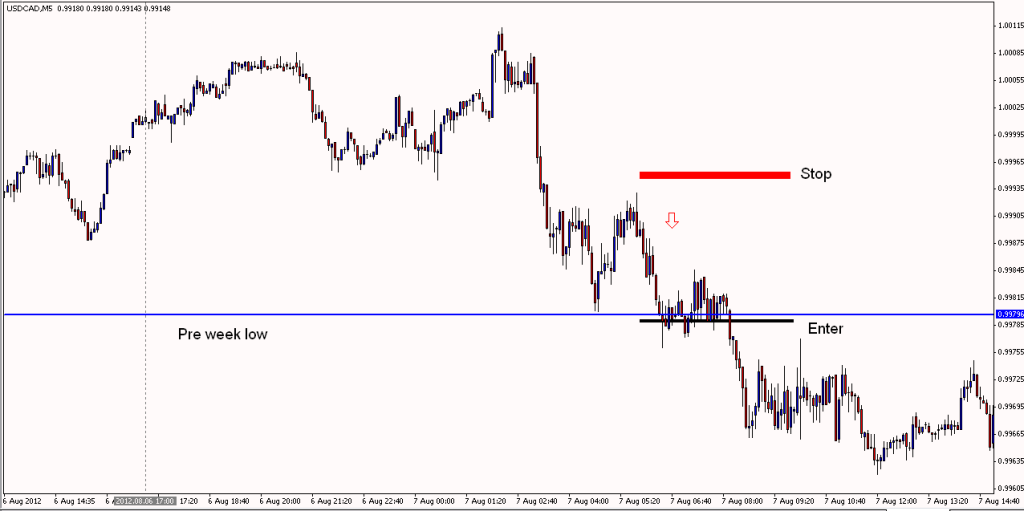
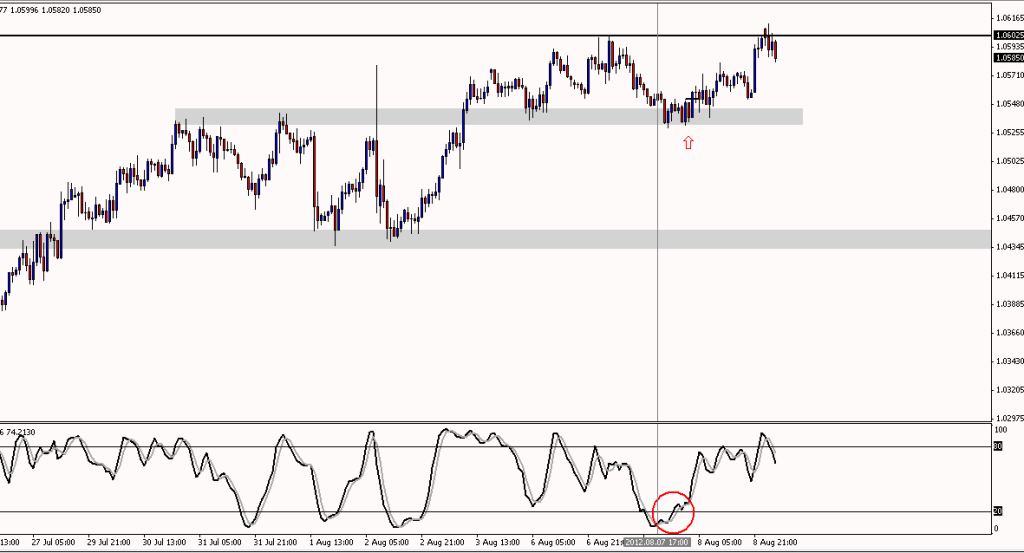
It's good to know I had the exact same levels marked out on my charts and I'm sure many others following this strategy did as well. I took the 1 hour hook entry at the first support zone yesterday at London open. Unfortunately I was stopped out at breakeven during today's early Asian session. I would be interested to know at what level you entered this trade (if you did). I entered on the break of that 5 min 1-2-3 after the 1 hour hook ( black line on 5 min chart) with first target 1.06.

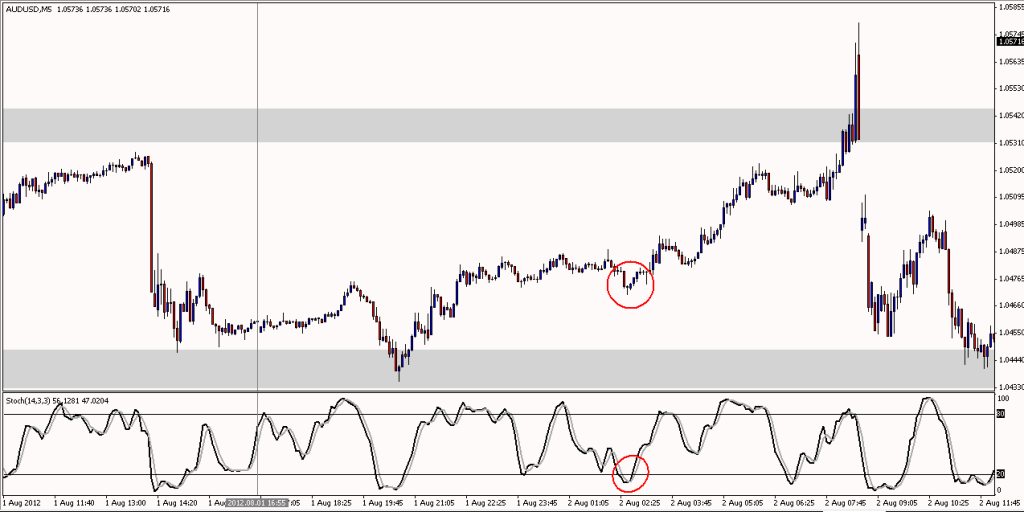
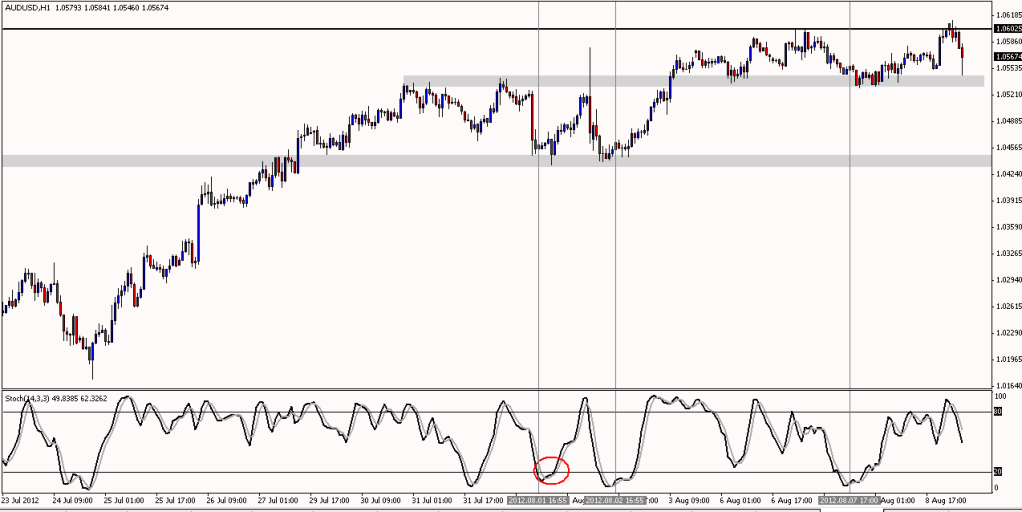
Another question for anyone utilizing these 1 hour hooks, often they will occur during early Asian trade such as on the 2 August. What do you guys think about taking higher low 5 min hooks or momentum breaks as entries higher up after price has reached and moved away from the zone (see chart below). I realize Ideal entry would be closer to the support zone but often if the ADR left/next resistance zone is sufficient the risk to reward is often appealing and these 5 min hooks would appear to be in line with Carll's original 5 min hook strategy.
Thanks
West