
19th March 2014
EURUSD
Summary
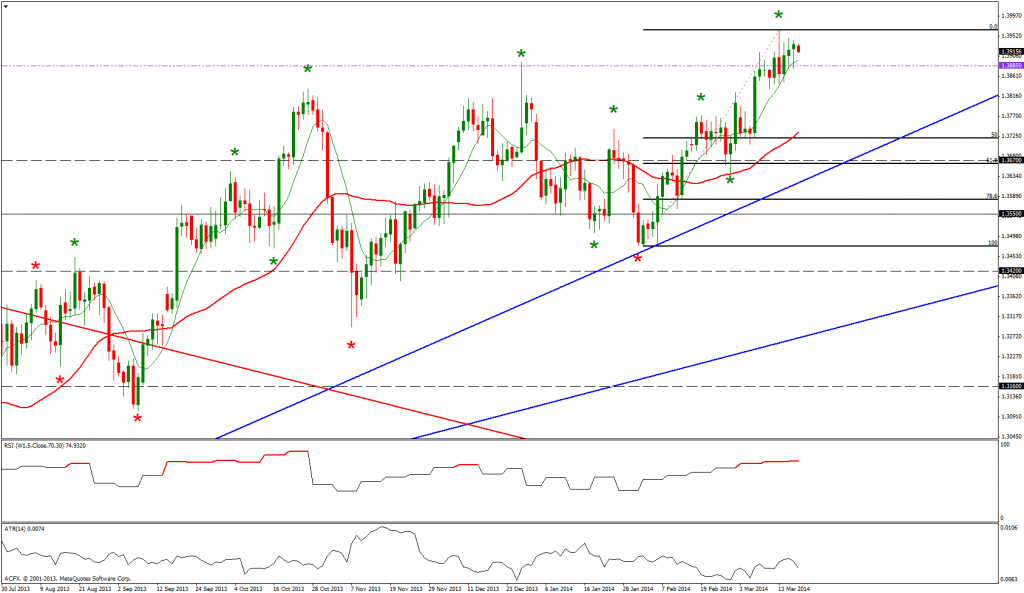
Tuesday EURUSD once again tested the 8 period moving averages before popping and closing higher on the day.
Market overview
EURUSD continues to trade in a daily uptrend following the breach of the 1.3741 level being the 24th January swing. This price action has put the daily time frame in gear with the positive weekly trend.
Focus on today
This morning EURUSD has opened negativley as it trades at the highs of the previous days range and just above the 1.3895 price level which corresponds to the 27th December isolated high.
I am this morning monitoring the price action for a potential for a test of the 1.4000 level.
Alternatively if EURUSD fails to resume its upward momentum there is a possibility the price action test support and trades back up to the 8 period moving averages.
GBPUSD
Summary
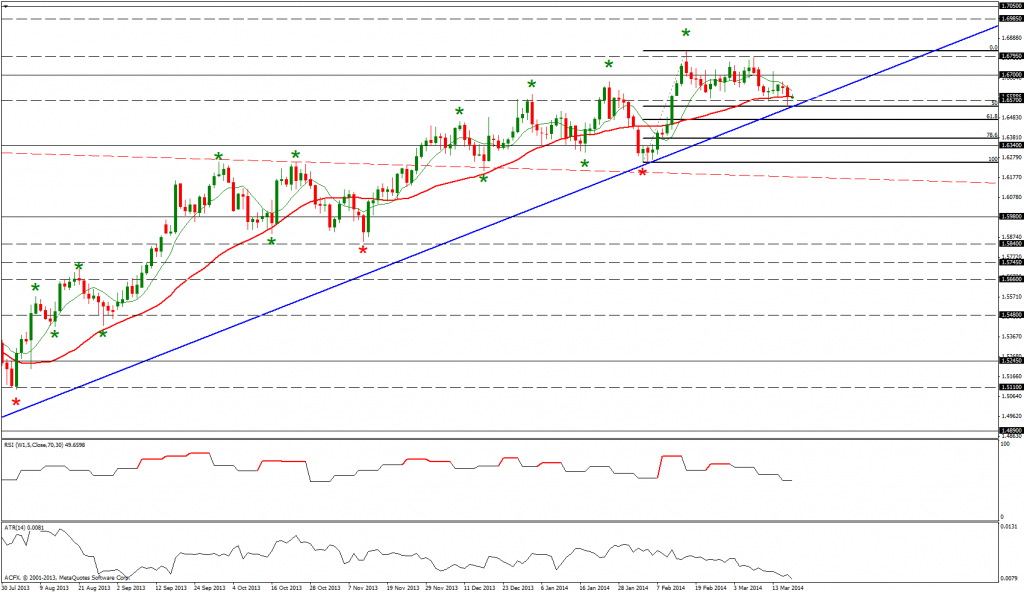
Tuesday GBPUSD breached the 34 period moving averages and the 1.6570 support level before ending the days business down on the day but above these key support levels.
Market overview
GBPUSD has traded above the 1.6668 being the prior isolated pivot high. This price activity has effectively changed the daily trend to up and puts it in line with the bullish weekly outlook. However the breach the 1.6639 level being the recent daily pivot low has added a question mark to the overall health of the uptrend.
Focus on today
This morning GBPUSD has opened quietly as the price action trades within the range of the previous days candle and beneath the 34 period moving averages.
I am today monitoring the price action for a possible test of the 1.6570 level.
Alternatively if GBPUSD cannot sustain lower prices could see the price action once again test the 1.6700.
USDJPY
Summary
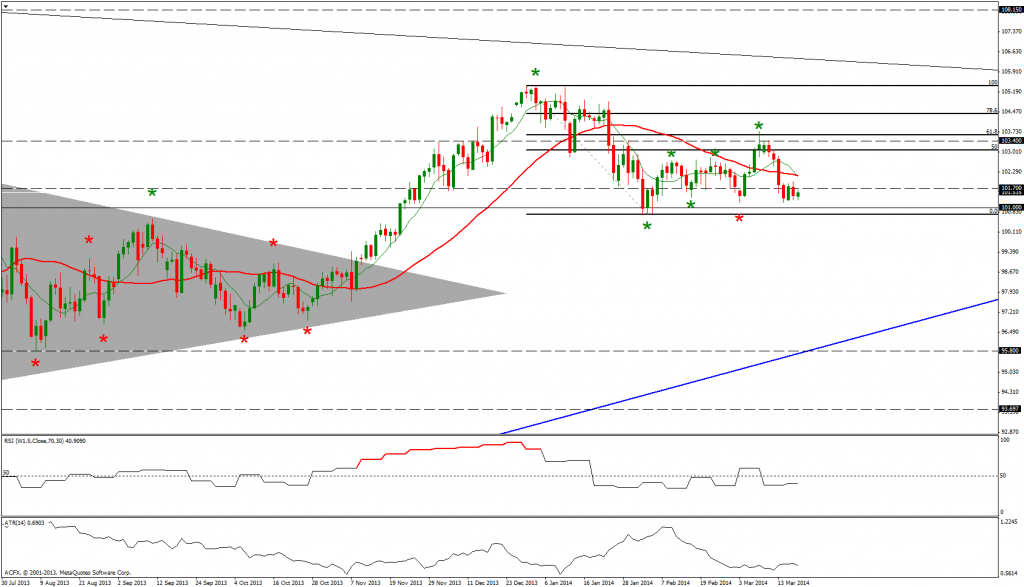
Tuesday USDJPY traded lower as it once again attempted to test the 101 support area.
Market overview
The breach of the 102.83 level being the swing high of the 21st February has effectively changed the daily trend to up and therefore putting this time frame into gear with the bullish weekly time frame. However a breach of the 101.19 level being the 4th March swing low would technically change the daily trend to down.
Focus on today
This morning USDJPY has opened positively as the price action trades within the range of the previous 4 day’s candles.
Today I am monitoring a potential test of the 101 level.
Alternatively a failure to sustain lower prices could see USDJPY trade up to the 34 period moving averages.
USDCHF
Summary
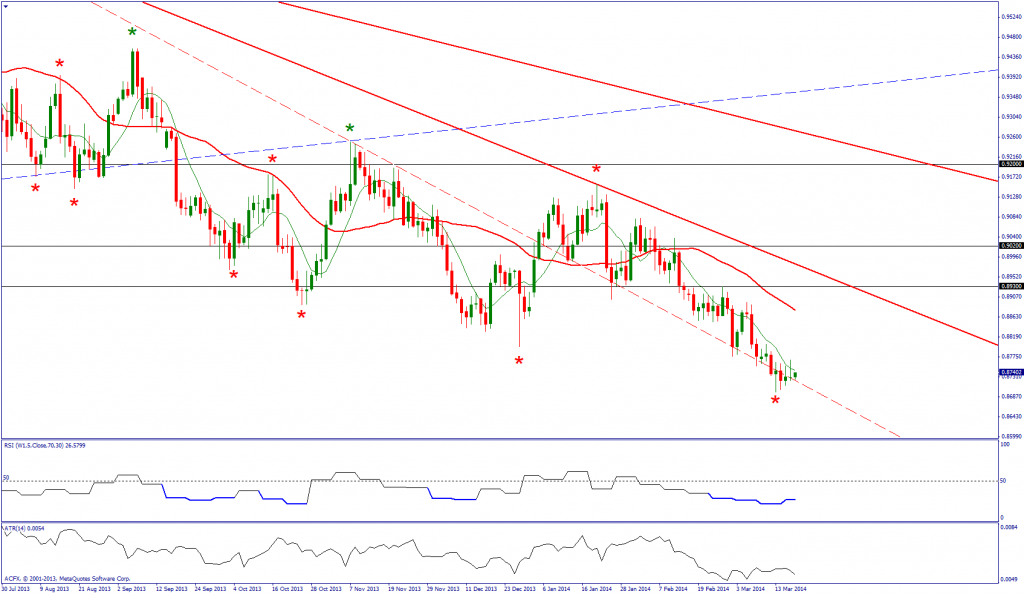
Tuesday USDCHF once again tested the 8 period moving averages however there was a rejection of higher prices and the price action eventually closed near to its open.
Market overview
USDCHF continues to trade in a negative daily and weekly swing bias.
Focus on today
This morning USDCHF has opened quietly as the price action trades within a 4 day range.
Today I am monitoring the price action for a re-test of the 8 period moving averages.
Alternatively a failure to sustain higher prices could see USDCHF test the 0.8875 level.
GOLD
Summary
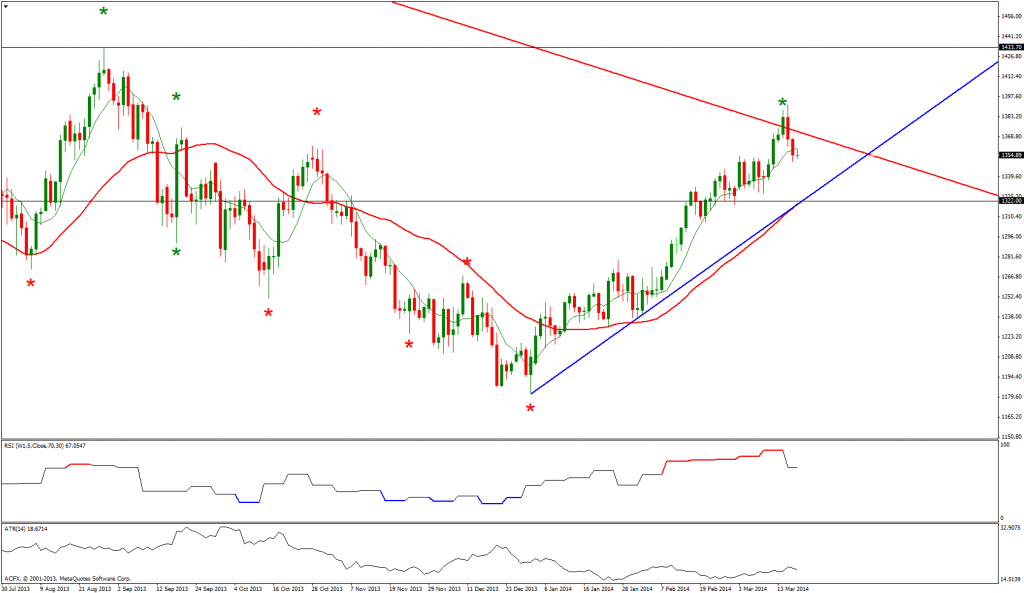
Tuesday Gold continued to correctly to the downside and ultimatley closed beneath its 8 period moving averages.
Market overview
Gold continues to trade in a daily uptrend following the breach of the 1267.99 level being the swing high of the 10th December. The weekly time frame continues to point down however we have witnessed a large multi month double bottom forming which could indicate a large upside trend reversal is a possibility. The break above the large downward sloping trend line adds impetus to the current positive bias. However the subsequent corrections lower needs to be monitored with support coming in at the 1320.00 level.
Focus on today
This morning Gold has opened negatively as the price action trades beneath the 8 period moving average and within the range of yesterday’s candle.
Today I am monitoring the price action for a test of the 8 period moving averages.
Alternatively a failure to sustain higher prices could see Gold trade into the direction of the 1320.00 support area.
OIL
Summary
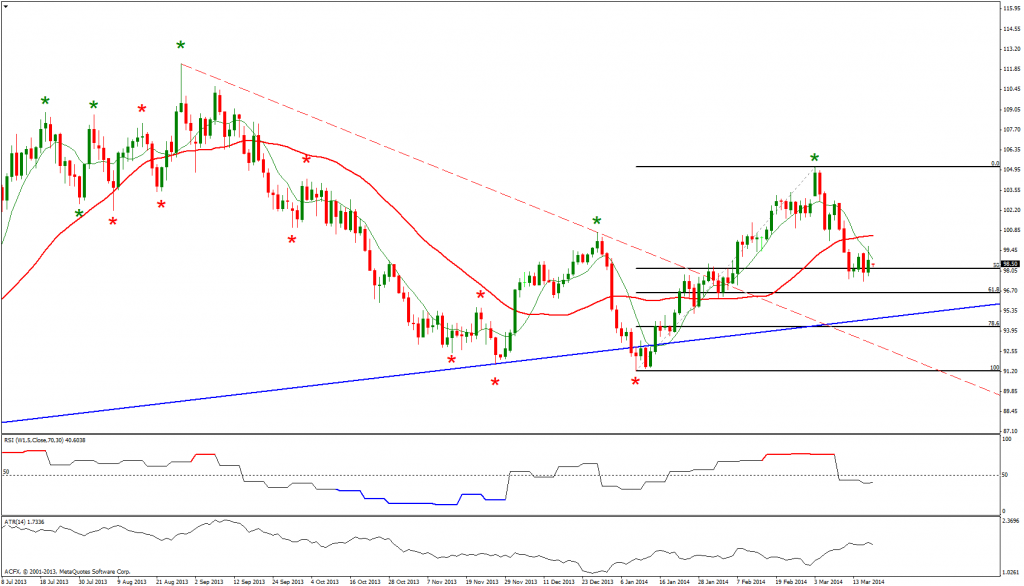
Tuesday Oil continue to trade in a narrow range as it tested the 8 period moving averages.
Market overview
Oil continues to trade in a daily uptrend following the breach of the 100.72 level being the swing high of the 24th December. The daily and weekly times both have a positive bias. The recent price activity has see Oil trade down to an area of Fibonacci support which could potentially offer a buying opportunity.
Focus on today
This morning Oil has opened quietly with the price action trading within the previous day’s range.
Today I am monitoring the price action for a breach of the 97.53 level being last week’s low.
Alternatively a failure to sustain lower prices could see Oil trade back up to the 8 period moving averages.