
Daily Technical Analysis for EURUSD as at 23rd September 2013
DAILY OVERVIEW
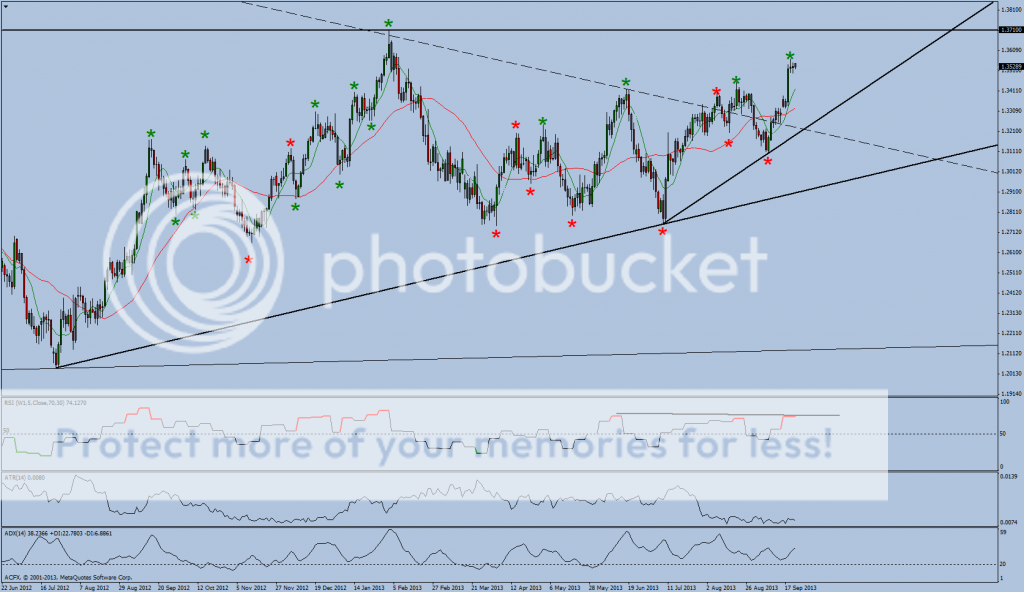
Trend : Long
Ambush Zone : -
Target 1 : -
Target 2 : -
Stop : -
Comments
EURUSD continues to trade within a tight trading range and at the highs of the large spike up. Furthermore there has not to date been a broad correction down to key support value areas such as the prior pivot high, moving average or trend line support. We are therefore monitoring the price for signs of possible break out or break downs from this level during the opening of the London session.
Further positivity for EURUSD will be in line with the change of the daily trend to up, the bullish weekly time frame the moving averages crossing positively and the break of the multiyear downward sloping trend line.
As posted previously we are currently monitoring the possibility of a move to 1.3710 being a previous weekly pivot high. However as the price action is extended from the averages there is potential for EURUSD to experience a corrective down to sideways movement. As the weekly RSI has yet to show signs of confirming this move the possibility of some kind of correction should not be ruled out.
Scenario 1
As the dominant daily trend is up retracements into support could be viewed as buying opportunities. However due to the strength of the move, the possibility of EURUSD continuing to break higher until it reaches the 1.3700 area should not be discounted with these moves probably following minor intraday corrections which could be identified off lower time frame charts.
Scenario 2
Alternatively as EURUSD has experienced a strong move higher, bargain hunters may view areas such as the previous swing high, broken trend line resistance and trend line support as areas to add positions. If this scenario plays out there is potential for shorts to be taken with a view of hitting these support targets. However it must be stressed that fighting such a dominant up trend can be a danger to your wealth.
Daily Technical Analysis for GBPUSD as at 23rd September 2013
DAILY OVERVIEW
Trend : Long
Ambush Zone : -
Target 1 : -
Target 2 : -
Stop : -

Comments
GBPUSD has traded down around 180 pips from the highs. This correction is to be expected after such a stellar up move .The move down does appear large. However in relative terms when compared to the proceeding uptrend is actually minor.
The preferred retracement levels for bargain hunters would probably be to key support levels such as the 8 period moving averages, trend line support or previous pivot high. Of these support levels only the 8 period moving averages has come under threat with the price action approaching but not reaching this level.
This morning’s price action is trading within a tight opening range and is encompassed by Friday’s price range. We are monitoring the possibility of a London session upside breakout.
A continued up move should put in focus the possibility of GBPUSD threatening to breach a multiyear down trend line and the 1.6400 area which coincides with a prior weekly pivot high. With the RSI and the moving averages confirming the up move and weekly time frame being in gear with the daily time frame shorting such a strong up trend can be dangerous. However with GBPUSD has yet to experience a good retracement and there is a possibility of further corrective down to sideways price action.
Scenario 1
As the dominant daily trend is up retracements into support could be viewed as buying opportunities. These retracements would be ideally taken off an obvious corrective pull back to the 8 period moving averages, trend line support or previous pivot high. However there is a possibility that pull backs are limited and GBPUSD continues to break higher. In this case pullbacks and break outs could potentially be identified off lower time frames.
Scenario 2
Alternatively as the price action is extended from the averages short scalping opportunities could potentially become available with targets being the value areas where longs will add positions such as the 8 period moving averages, trend line support or previous pivot high.
Daily Technical Analysis for USDCHF as at 23rd September 2013
DAILY OVERVIEW
Trend : Down
Ambush Zone : -
Target 1 : -
Target 2 : -
Stop : -

Comments
USDCHF has continued to trade lower albeit at a much slower pace. The market is now trading within a very tight range near to the lows of this down move. We are monitoring the London open for a possible indication of which way the market will break.
To recap on the bigger picture the price action breached trend line support, horizontal support and more importantly the prior swing low which effectively changes the trend to down. The RSI is in gear with this downtrend and this is further confirmed by the averages and weekly time frame. The next support level we are monitoring is the 0.9020 area.
Scenario 1
As the dominant daily trend is down corrective pullbacks could possibly offer selling opportunities with retracements back to the averages, the prior pivot low and broken support being value areas where shorts could potentially be added. However there is a possibility of USDCHF continuing to break lower following relatively minor corrective pullbacks which can be identified off intraday charts.
Scenario 2
Alternatively one could potentially take scalp longs up to the previously mentioned value areas.
Daily Technical Analysis for USDJPY as at 23rd September 2013
DAILY OVERVIEW
Trend : Long
Ambush Zone : -
Target 1 : -
Target 2 : -
Stop : -

Comments
USDJPY experienced a minor 70 pip downward correction following the strong bounce off the point of intersection of the converging triangle trend lines.
Across the markets the USD is showing signs of weakness, especially against the majors such as GBPUSD and EURUSD. In the case of EURUSD and USDCHF this weakness in the USD has effectively changed the trends.
However, USDJPY has stubbornly put up a resistance and maintained an uptrend. With the RSI confirming the move and the averages and weekly time frame pointing positive, we are monitoring the strength of this bounce. If the price action can hold above the triangle and trade through last Monday’s opening downside gap there is potential that USDJPY will retest the 100 level.
If USDJPY however can trade beneath the converging triangle pattern a move and breach of the prior swing low comes into focus. A breach of the prior swing low will effectively change the swing trend to negative. This scenario is currently being highlighted by downside pressure being exerted by Fibonacci resistance.
Scenario 1
As the dominant daily trend is up retracements into support could be viewed as buying opportunities
Scenario 2
Alternatively a move beneath the converging triangle opens up a possibility of shorting USDJPY down to the prior swing low.
Daily Technical Analysis for Gold as at 23rd September 2013
DAILY OVERVIEW
Trend : Long
Ambush Zone : -
Target 1 : -
Target 2 : -
Stop : -

Comments
The bounce off Fibonacci and the 1320 support area has thus far failed to follow through with the price action trading back down deep into the Fibonacci area. The move down however has not retested the 1320 level.
In terms of the bigger picture the daily trend is positive and the up move is in line with the hidden weekly divergence in the RSI. However the weekly time frame does continue to have a bearish outlook and the daily averages are layered negatively.
We are currently monitoring a potential move to the prior swing pivot high. However a failure to follow through could see Gold breach the prior swing low and effectively changing the trend to negative.
Scenario 1
As the dominant daily trend is up corrective sideways to down movements could potentially be viewed as buying opportunities.
Scenario 2
Alternatively the breach of the 1320 support area could see Gold trade down to the prior pivot low.
Daily Technical Analysis for Oil (WTI) as at 23rd September 2013
DAILY OVERVIEW
Trend : Long
Ambush Zone : -
Target 1 : -
Target 2 : -
Stop : -

Comments
Oil on Friday broke the bottom off the 104.80 to 110.70 range. The downside correction would appear to be gathering momentum with the averages also turning negative however a further move south will need to overcome support offered by the Fibonacci support area and the positive hidden divergence of the weekly RSI.
As the swing bias remains positive we are monitoring the bounce off Fibonacci support and a potential move to the prior swing high.
A failure to follow through with a strong up move could however see Oil trade down the previous pivot low which would effectively change the trend to short.
Scenario 1
As the dominant daily trend is up retracements to support areas could possibly be viewed as buying opportunities.
Scenario 2
Alternatively a breach of current support could see Oil trade down to the previous swing low.