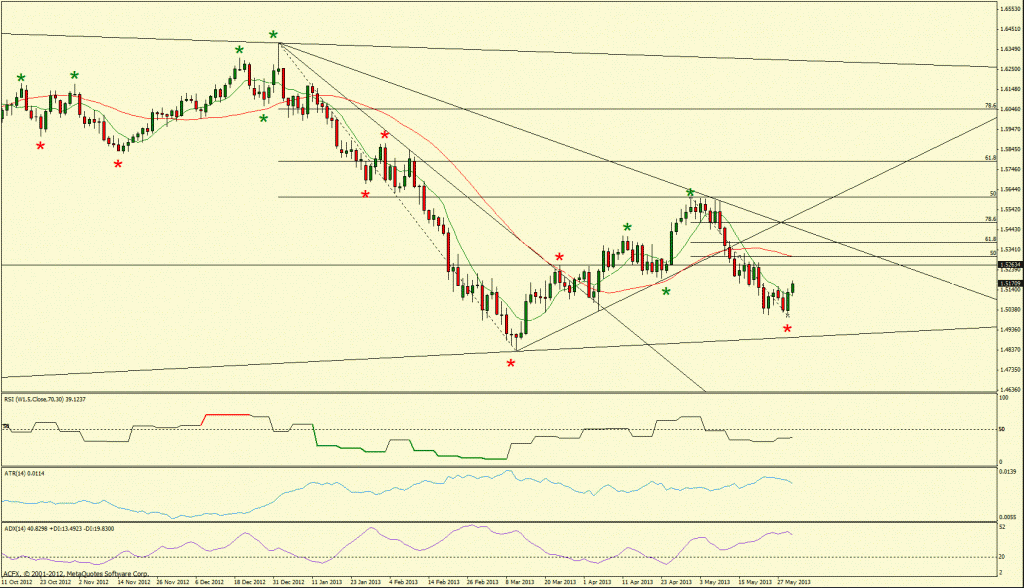
Daily Technical Analysis for EURUSD as at 22nd May 2013DAILY OVERVIEWTrend : Short
Ambush Zone : -
Target 1 : -
Target 2 : -
Stop : -
 Comments
As posted previously EURUSD is bouncing at trend line support. We are monitoring the price action to see if there is a potential move up to Fibonacci resistance.
Alternatively as EURUSD is now trading at the 8 period moving averages there is a possibility of a rejection of this level followed by a move to the 4th April Swing Low.
DefinitionsTrend : Current trend as defined by technical Swing Analysis
HH : Higher High
HL : Higher Low
LL : Lower Low
LH : Lower High
CofT : Change of Trend
Daily Technical Analysis for GBPUSD as at 22nd May 2013DAILY OVERVIEWTrend : Short
Ambush Zone : -
Target 1 : -
Target 2 : -
Stop : -
 Comments
As posted previously GBPUSD is basing just under the 1.5270 support area. We are monitoring a potential move to Fibonacci resistance.
Alternatively as the price action has traded back to the 8 period moving averages there is possibility that there is a rejection of this level followed by a move to the 1.5030 area which is a pivot low for the 4th April.
DefinitionsTrend : Current trend as defined by technical Swing Analysis.
HH : Higher High
HL : Higher Low
LL : Lower Low
LH : Lower High
CofT : Change of Trend
Daily Technical Analysis for USDCHF as at 22nd May 2013DAILY OVERVIEWTrend : Long
Ambush Zone : -
Target 1 : -
Target 2 : -
Stop : -
 Comments
As posted previously USDCHF has once again traded up to and rejected the 161.80 extension level. Furthermore a pronounced negative RSI divergence is forming.
We are monitoring the potential for a further break of the 161.8 level. A move above this level has the potential to follow through to the 200 Fibonacci extension level with further targets being 0.9970 which corresponds to a prior Swing High and then the significant USDCHF 1.0000 level.
Alternatively a failure to break above the 161.8 level could possibly lead to a deeper pullback into Fibonacci support.
DefinitionsTrend : Current trend as defined by technical Swing Analysis
HH : Higher High
HL : Higher Low
LL : Lower Low
LH : Lower High
CofT : Change of Trend
Daily Technical Analysis for USDJPY as at 22nd May 2013DAILY OVERVIEWTrend : Long
Ambush Zone : -
Target 1 : -
Target 2 : -
Stop : -
 Comments
As posted previously, USDJPY continues to trade at its highs without making any significant progress over the past few sessions. The RSI is showing a weekly negative divergence.
We have identified 110 as the next potential swing target and the 104 area as a possible Fibonacci expansion target.
Alternatively as the price action is extended, there is potential that USDJPY trades down to sideways as this currency pair corrects and allows the averages to catch up with the last move. Initially support for a possible correction being found at the 8 period moving averages.
DefinitionsTrend : Current trend as defined by technical Swing Analysis
HH : Higher High
HL : Higher Low
LL : Lower Low
LH : Lower High
CofT : Change of Trend
Daily Technical Analysis for Gold as at 22nd May 2013DAILY OVERVIEWTrend : Short
Ambush Zone : 1452.60 – 1525.85
Target 1 : 1321.75
Target 2 : 1308.08
Stop : 1590.20
 Comments
As posted previously Gold has traded back to the 8 period moving averages.
We continue to monitor the price action at these levels for potential move to Target 1.
DefinitionsTrend : Current trend as defined by technical Swing Analysis
HH : Higher High
HL : Higher Low
LL : Lower Low
LH : Lower High
CofT : Change of Trend
Daily Technical Analysis for Oil (WTI) as at 22nd May 2013DAILY OVERVIEWTrend : Long
Ambush Zone : -
Target 1 : -
Target 2 : -
Stop : -
 Comments
After closing above the weekly and monthly triangle resistance Oil has experienced a minor pullback. We are monitoring the possibility for the upward momentum to continue with the 138.2% Fibonacci Expansion level in the area of 103 being a potential target. However Oil will first need to initially breach the significant 100 level.
Alternatively if Oil cannot move higher from these levels could lead to the possibility that we see a further pull back to the 8 period moving averages.
DefinitionsTrend : Current trend as defined by technical Swing Analysis
HH : Higher High
HL : Higher Low
LL : Lower Low
LH : Lower High
CofT : Change of Trend
Daily Technical Analysis for EURUSD as at 22nd May 2013DAILY OVERVIEWTrend : Short
Ambush Zone : -
Target 1 : -
Target 2 : -
Stop : -
CommentsAs posted previously EURUSD is bouncing at trend line support. We are monitoring the price action to see if there is a potential move up to Fibonacci resistance.
Alternatively as EURUSD is now trading at the 8 period moving averages there is a possibility of a rejection of this level followed by a move to the 4th April Swing Low.
DefinitionsTrend : Current trend as defined by technical Swing Analysis
HH : Higher High
HL : Higher Low
LL : Lower Low
LH : Lower High
CofT : Change of Trend
Daily Technical Analysis for GBPUSD as at 22nd May 2013DAILY OVERVIEWTrend : Short
Ambush Zone : -
Target 1 : -
Target 2 : -
Stop : -
CommentsAs posted previously GBPUSD is basing just under the 1.5270 support area. We are monitoring a potential move to Fibonacci resistance.
Alternatively as the price action has traded back to the 8 period moving averages there is possibility that there is a rejection of this level followed by a move to the 1.5030 area which is a pivot low for the 4th April.
DefinitionsTrend : Current trend as defined by technical Swing Analysis.
HH : Higher High
HL : Higher Low
LL : Lower Low
LH : Lower High
CofT : Change of Trend
Daily Technical Analysis for USDCHF as at 22nd May 2013DAILY OVERVIEWTrend : Long
Ambush Zone : -
Target 1 : -
Target 2 : -
Stop : -
CommentsAs posted previously USDCHF has once again traded up to and rejected the 161.80 extension level. Furthermore a pronounced negative RSI divergence is forming.
We are monitoring the potential for a further break of the 161.8 level. A move above this level has the potential to follow through to the 200 Fibonacci extension level with further targets being 0.9970 which corresponds to a prior Swing High and then the significant USDCHF 1.0000 level.
Alternatively a failure to break above the 161.8 level could possibly lead to a deeper pullback into Fibonacci support.
DefinitionsTrend : Current trend as defined by technical Swing Analysis
HH : Higher High
HL : Higher Low
LL : Lower Low
LH : Lower High
CofT : Change of Trend
Daily Technical Analysis for USDJPY as at 22nd May 2013DAILY OVERVIEWTrend : Long
Ambush Zone : -
Target 1 : -
Target 2 : -
Stop : -
CommentsAs posted previously, USDJPY continues to trade at its highs without making any significant progress over the past few sessions. The RSI is showing a weekly negative divergence.
We have identified 110 as the next potential swing target and the 104 area as a possible Fibonacci expansion target.
Alternatively as the price action is extended, there is potential that USDJPY trades down to sideways as this currency pair corrects and allows the averages to catch up with the last move. Initially support for a possible correction being found at the 8 period moving averages.
DefinitionsTrend : Current trend as defined by technical Swing Analysis
HH : Higher High
HL : Higher Low
LL : Lower Low
LH : Lower High
CofT : Change of Trend
Daily Technical Analysis for Gold as at 22nd May 2013DAILY OVERVIEWTrend : Short
Ambush Zone : 1452.60 – 1525.85
Target 1 : 1321.75
Target 2 : 1308.08
Stop : 1590.20
CommentsAs posted previously Gold has traded back to the 8 period moving averages.
We continue to monitor the price action at these levels for potential move to Target 1.
DefinitionsTrend : Current trend as defined by technical Swing Analysis
HH : Higher High
HL : Higher Low
LL : Lower Low
LH : Lower High
CofT : Change of Trend
Daily Technical Analysis for Oil (WTI) as at 22nd May 2013DAILY OVERVIEWTrend : Long
Ambush Zone : -
Target 1 : -
Target 2 : -
Stop : -
CommentsAfter closing above the weekly and monthly triangle resistance Oil has experienced a minor pullback. We are monitoring the possibility for the upward momentum to continue with the 138.2% Fibonacci Expansion level in the area of 103 being a potential target. However Oil will first need to initially breach the significant 100 level.
Alternatively if Oil cannot move higher from these levels could lead to the possibility that we see a further pull back to the 8 period moving averages.
DefinitionsTrend : Current trend as defined by technical Swing Analysis
HH : Higher High
HL : Higher Low
LL : Lower Low
LH : Lower High
CofT : Change of Trend