Daily Market Review by FXCC June 26 2012
Daily Market Review by FXCC June 26 2012
EU in total turmoil and chaos... Moody's downgrades 28 Spanish Banks
Markets traded with a negative bias on Monday: equities sold off in Europe and North America (-2% on the DAX, -1.6% on the S&P 500, -0.9% on the TSX) on a succession of ominous news reports out of Europe. Spain announced that it would seek bailout funds from the Eurogroup, and later Cyprus announced that it would seek bailout funds from the Eurogroup… the hits kept on coming throughout the day. While the Eurogroup has officially welcomed both requests, it will need to come up with plans to meet both countries’ needs in the short term, even as the EU Summit planned for the 28th and 29th is supposed to focus on larger matters such as coordinated stimulus throughout the Eurozone, the relaxing of timetables for fiscal consolidation in different European countries, etc.
The euro traded lower, with EURUSD closing at 1.25, while CAD strengthened during the second half of the day as the near-month WTI contract rebounded from an intraday low of US$78 per barrel to US$79.20 (still lower on the day – it had opened above US$80 per barrel). The TSX was buoyed by strength in the gold mining sub-sector (+1.8%) while the oil and gas sector followed crude prices lower. Government bonds in Canada, the US and Germany all appreciated today, and the generic German 2-year is back to a single digit yield of 0.07%. The market mood was summed up by a release that read "As demands for action weigh on EU leaders, markets begin to lose confidence that this week’s EU summit will yield anything more than promises and small steps. In this environment the markets are shedding risk. "
Read More
https://support.fxcc.com/email/technical/26062012/
UPCOMING EVENTS :
2012-06-26 08:30 GMT | UK - Public Sector Net Borrowing (May)
2012-06-26 08:30 GMT | UK - Inflation Report Hearings
2012-06-26 14:00 GMT | US - Consumer Confidence (Jun)
2012-06-26 14:00 GMT | US - Richmond Fed Manufacturing Index (Jun)
FOREX NEWS :
2012-06-26 03:57 GMT | USD/JPY selling off ahead of tax voting
2012-06-26 03:40 GMT | US new home sector to remain under pressure - RBC
2012-06-26 02:02 GMT | China CB Leading Economic Index: 1.1
2012-06-26 01:50 GMT | Risk currencies on correction mode after Monday's USD buying
EURUSD
DAILY WEEKLY MONTHLY

1.2615 | 1.2580 | 1.2542
1.2469 | 1.2434 | 1.2396
SUMMARY : Down
TREND : Down trend
MA10 : Bearish
MA20 : Bearish
STOCHASTIC : Overbought
MARKET ANALYSIS - Intraday Analysis
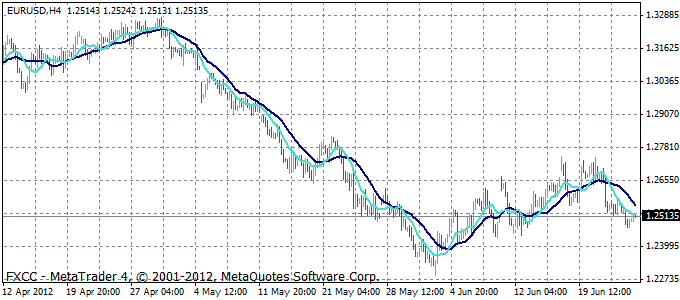
Crucial support is evident at 1.2440, and a sustained breach of the same may see the euro test its previous lows of 1.2286 and 1.2142 in the coming days. RSI-14 is currently trading at 0.37 with a negative bias on the weekly chart. We can expect the euro to trade lower following its overall downtrend. Meanwhile, resistances are evident at 1.2647 (8-period EMA on daily chart) then 1.2740.
----------------
GBPUSD :
DAILY WEEKLY MONTHLY

1.5643 | 1.5617 | 1.5591
1.5539 | 1.5513 | 1.5487
SUMMARY : Down
TREND : Down trend
MA10 : Bearish
MA20 : Bullish
STOCHASTIC : Overbought
MARKET ANALYSIS - Intraday Analysis
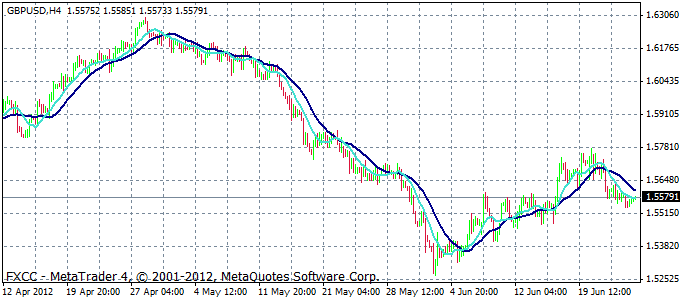
We can expect the pair to continue its downward rally and test the support of 1.5510, or 23.6% retracement level for the aforementioned range. If the pair breaches this support, then the next support is at 1.5360; the resistances are at 1.5660 (8-period EMA on weekly chart) and then 1.5755.
-----------
USDJPY :
DAILY WEEKLY MONTHLY

81.475 81.025 80.340
79.210 78.760 78.075
SUMMARY : Neutral
TREND : Up trend
MA10 : Bearish
MA20 : Bullish
STOCHASTIC : Oversold
MARKET ANALYSIS - Intraday Analysis
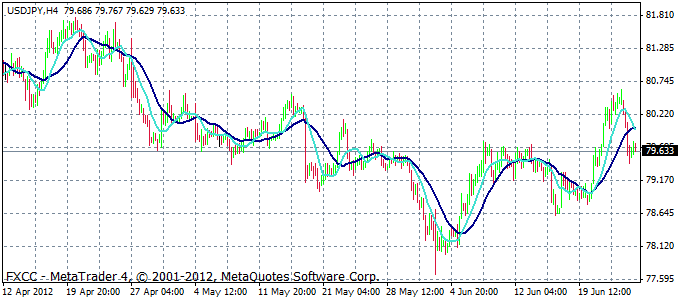
The pair is trading above the 38.2% Fibonacci retracement level in the downward rally ranging from 84.17 to 77.62). We can expect the pair to retest the support levels of 79.70-79.40, and the yen may start inching up from these levels. The RSI-14 is currently at 0.51 and is tending towards the upside. This week, we recommend buying at support levels of 79.80-79.75. The supports are evident at 79.70-79.40 and resistances are at 80.91 and 81.60, representing 50% and 61.8% retracement level for the 84.17-77.62 range, respectively. Short term signals are bearish but as we move to the longer view, indicators are totally confused.
Source: FX Central Clearing Ltd, (http://www.fxcc.com)
EU in total turmoil and chaos... Moody's downgrades 28 Spanish Banks
Markets traded with a negative bias on Monday: equities sold off in Europe and North America (-2% on the DAX, -1.6% on the S&P 500, -0.9% on the TSX) on a succession of ominous news reports out of Europe. Spain announced that it would seek bailout funds from the Eurogroup, and later Cyprus announced that it would seek bailout funds from the Eurogroup… the hits kept on coming throughout the day. While the Eurogroup has officially welcomed both requests, it will need to come up with plans to meet both countries’ needs in the short term, even as the EU Summit planned for the 28th and 29th is supposed to focus on larger matters such as coordinated stimulus throughout the Eurozone, the relaxing of timetables for fiscal consolidation in different European countries, etc.
The euro traded lower, with EURUSD closing at 1.25, while CAD strengthened during the second half of the day as the near-month WTI contract rebounded from an intraday low of US$78 per barrel to US$79.20 (still lower on the day – it had opened above US$80 per barrel). The TSX was buoyed by strength in the gold mining sub-sector (+1.8%) while the oil and gas sector followed crude prices lower. Government bonds in Canada, the US and Germany all appreciated today, and the generic German 2-year is back to a single digit yield of 0.07%. The market mood was summed up by a release that read "As demands for action weigh on EU leaders, markets begin to lose confidence that this week’s EU summit will yield anything more than promises and small steps. In this environment the markets are shedding risk. "
Read More
https://support.fxcc.com/email/technical/26062012/
UPCOMING EVENTS :
2012-06-26 08:30 GMT | UK - Public Sector Net Borrowing (May)
2012-06-26 08:30 GMT | UK - Inflation Report Hearings
2012-06-26 14:00 GMT | US - Consumer Confidence (Jun)
2012-06-26 14:00 GMT | US - Richmond Fed Manufacturing Index (Jun)
FOREX NEWS :
2012-06-26 03:57 GMT | USD/JPY selling off ahead of tax voting
2012-06-26 03:40 GMT | US new home sector to remain under pressure - RBC
2012-06-26 02:02 GMT | China CB Leading Economic Index: 1.1
2012-06-26 01:50 GMT | Risk currencies on correction mode after Monday's USD buying
EURUSD
DAILY WEEKLY MONTHLY

1.2615 | 1.2580 | 1.2542
1.2469 | 1.2434 | 1.2396
SUMMARY : Down
TREND : Down trend
MA10 : Bearish
MA20 : Bearish
STOCHASTIC : Overbought
MARKET ANALYSIS - Intraday Analysis
Crucial support is evident at 1.2440, and a sustained breach of the same may see the euro test its previous lows of 1.2286 and 1.2142 in the coming days. RSI-14 is currently trading at 0.37 with a negative bias on the weekly chart. We can expect the euro to trade lower following its overall downtrend. Meanwhile, resistances are evident at 1.2647 (8-period EMA on daily chart) then 1.2740.
----------------
GBPUSD :
DAILY WEEKLY MONTHLY

1.5643 | 1.5617 | 1.5591
1.5539 | 1.5513 | 1.5487
SUMMARY : Down
TREND : Down trend
MA10 : Bearish
MA20 : Bullish
STOCHASTIC : Overbought
MARKET ANALYSIS - Intraday Analysis
We can expect the pair to continue its downward rally and test the support of 1.5510, or 23.6% retracement level for the aforementioned range. If the pair breaches this support, then the next support is at 1.5360; the resistances are at 1.5660 (8-period EMA on weekly chart) and then 1.5755.
-----------
USDJPY :
DAILY WEEKLY MONTHLY

81.475 81.025 80.340
79.210 78.760 78.075
SUMMARY : Neutral
TREND : Up trend
MA10 : Bearish
MA20 : Bullish
STOCHASTIC : Oversold
MARKET ANALYSIS - Intraday Analysis
The pair is trading above the 38.2% Fibonacci retracement level in the downward rally ranging from 84.17 to 77.62). We can expect the pair to retest the support levels of 79.70-79.40, and the yen may start inching up from these levels. The RSI-14 is currently at 0.51 and is tending towards the upside. This week, we recommend buying at support levels of 79.80-79.75. The supports are evident at 79.70-79.40 and resistances are at 80.91 and 81.60, representing 50% and 61.8% retracement level for the 84.17-77.62 range, respectively. Short term signals are bearish but as we move to the longer view, indicators are totally confused.
Source: FX Central Clearing Ltd, (http://www.fxcc.com)