
ECB's Draghi's vow to save the monetary union sends markets climbing.
Concerns are also growing about global growth. The IMF said in a report today that China's slowing economy faces significant downside risks and relies too much on investment. While the economy “seems to be undergoing a soft landing”. US stocks advanced ahead of a report that may show demand for new homes rose in June and amid concern Spain may need a full bailout as Europe's debt crisis worsens. Broadcom Corp rose 2.6% after it forecast third- quarter sales that may beat analysts' estimates. And as European Central Bank President Mario Draghi said policy makers will do everything in their power to ensure a survival of the Euro.
Apple Inc. fell 4.7% in Germany after reporting profit and sales that missed analysts' projections. Netflix Inc. dropped 17% after it raised doubts about whether it can meet its user-growth targets this year. Japanese stocks fell, with the Topix Index posting its biggest four-day drop since August, as the Yen traded near an 11-year high against the euro amid concern Europe's debt crisis is worsening. The MSCI Asia Pacific Index dropped 1% today as Greece's creditors met to assess how far the debt-stricken nation has strayed from bailout terms Weakness in the euro became more evident throughout the day, as investors lost confidence in any results from the EU Summit and their grand plan, markets want action to help correct today's problems, not plans for the future, when their maybe no EU or euro.
Read More
https://support.fxcc.com/email/technical/27072012/
UPCOMING EVENTS :
2012-07-27 12:00 GMT | Germany - Consumer Price Index (Jul)
2012-07-27 12:30 GMT | US - Gross Domestic Product Annualized (Q2)
2012-07-27 12:30 GMT | US - Personal Consumption Expenditures Prices (Q2)
2012-07-27 13:55 GMT | US - Reuters/Michigan Consumer Sentiment Index (Jul)
FOREX NEWS :
2012-07-27 04:22 GMT | EUR/USD, hangover sub-1.2300
2012-07-27 02:47 GMT | GBP/JPY rally interrupted by 21 EMA
2012-07-27 02:07 GMT | Moving to period of EUR/USD weakness, rising global risk premia - Nomura
2012-07-27 01:40 GMT | US Q2 GDP weakness should be confirmed - Standard Chartered
----------
EURUSD : 1.22932 / 1.22935
DAILY WEEKLY MONTHLY
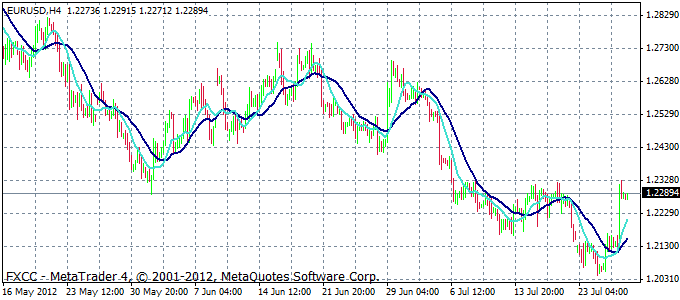
1.2577 | 1.2453 | 1.2366
1.2155 | 1.2031 | 1.1944
SUMMARY : Neutral
TREND : Up trend
MA10 : Bullish
MA20 : Bullish
STOCHASTIC : Oversold
MARKET ANALYSIS - Intraday Analysis
Technicals are bearish, but candlesticks suggest momentum is turning. The close at 1.2288 opens up a test to 1.2455; however the risk reward remains poor. The anticipated reversal has materialized in the EURUSD and we can now focus on how far the rally is likely to extend, the 1.23 level is an important psychological number. Supports are seen at 1.2200, 1.2118 and then at 1.2100 and, resistance levels are seen at 1.2334 and then at 1.2401. Yesterdays movements have indicators and oscillators behind, this is a good sit it out situation.
---------------
GBPUSD : 1.56847 / 1.56850
DAILY WEEKLY MONTHLY
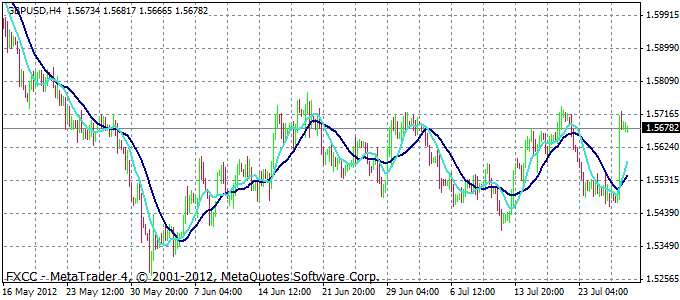
1.6034 | 1.5879 | 1.5781
1.5528 | 1.5373 | 1.5275
SUMMARY : Up
TREND : Up trend
MA10 : Bullish
MA20 : Bullish
STOCHASTIC : Neutral
MARKET ANALYSIS - Intraday Analysis
Technicals are well mixed, between short term, near term and long term. Support is expected at the July 12th low at 1.5394, with resistance at the 200 day MA 1.5746. The outlook shows a downward movement towards the 1.5550 zone of support. A rise above 1.5700 may lead to a test of the 1.5730 resistance level. Supports are seen at 1.5600, 1.5500 and then at 1.5458 and resistance levels are seen at 1.5738 and then at the 200-DMA line at 1.5747.
-------------
USDJPY : 78.231 / 78.233
DAILY WEEKLY MONTHLY
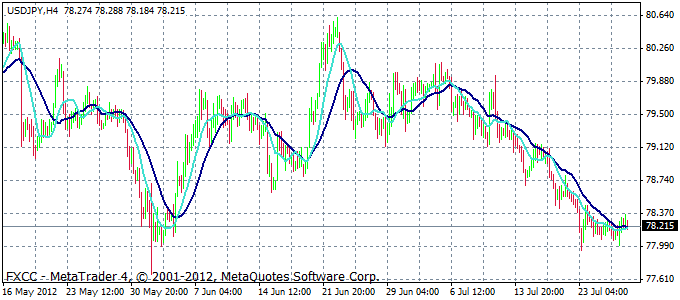
79.170 | 78.785 | 78.445
78.105 | 77.770 | 77.315
SUMMARY : Down
TREND : Down trend
MA10 : Bearish
MA20 : Bearish
STOCHASTIC : Oversold
MARKET ANALYSIS - Intraday Analysis
Technicals continue to read bearish and suggest further downward movement, despite consolidation in the past two sessions. Trading is in the narrow range of 78.243 and 78.054 at the time of writing. The pair is likely to fluctuate within the resistance level of 78.404 and the support level of 77.942. After the break of 79.00 the short-term bias is to the downside towards the 77.65 level. In the long term, however, we expect a bullish scenario: a test of the 83.00 resistance level. Supports are seen at 77.94/65 and then at 77.36 and resistance levels are seen at 78.28 and then at 78.54.
Source: FX Central Clearing Ltd, (Forex Rate | Forex News | ECN Forex Broker | FXCC)