Instaforex Analysis

Forex broker related topics and discussions

Re: Instaforex Analysis

Postby IFX Gertrude » Wed Feb 15, 2023 1:55 am

Forex Analysis & Reviews: Technical Analysis of Daily Price Movement of USD Currency Index, Wednesday February 15 2023.

Image

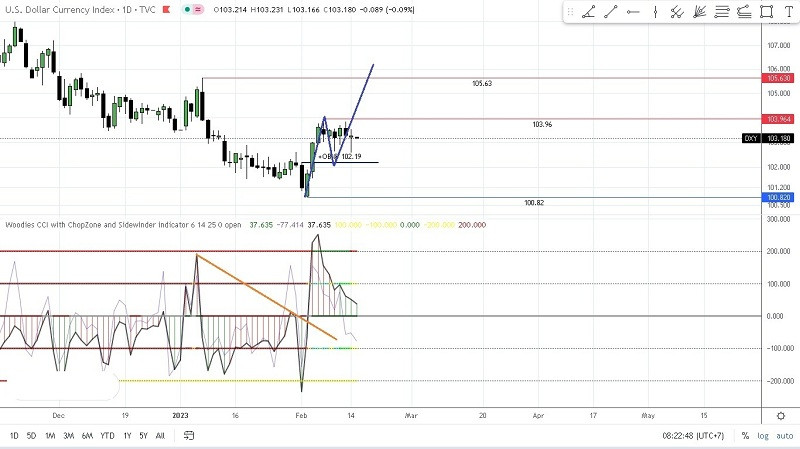
On the daily chart of the USD Dollar Index, it can be seen that there was a trendline break (TLB) condition on the CCI (14) indicator which was previously in a bear condition where the Chop Zone (CZ) indicator (levels 100 & -100) was red but after that TLB and CCI move above level 0, so CZ changes color to cyan blue and now the CCI histogram (14) has turned green, followed by Sidewinder color (levels 200 & -200) changes color to yellow (volatile/Trending) and green (very volatile / trending) so that in the future USDX has the potential to be Bullish appreciated going up to the 103.96 level as the first target and the 105.63 level as the second target but before that it seems that USDX will be corrected down to test the 102.19 level and as long as this level is strong enough to hold back the pace correction and does not exceed the level of 100.82, USDX has the potential to strengthen again where this can be seen at CCI 914) is trying to form Zero Line Reject (ZLR) pattern.

*The market analysis posted here is meant to increase your awareness, but not to give instructions to make a trade.

Analysis are provided by InstaForex.

Read More https://ifxpr.com/3RYEPhg
Best regards, PR Manager

Learn more about InstaForex Company at http://instaforex.com
IFX Gertrude
 
Posts: 5198
Joined: Wed Nov 07, 2012 6:25 am

Re: Instaforex Analysis

Postby IFX Gertrude » Thu Feb 16, 2023 1:47 am

Forex Analysis & Reviews: Forecast for GBP/USD on February 16, 2023

Pound fell by 140 pips as sellers became active yesterday due to the weaker-than-expected inflation data. It indicated that core CPI fell from 12.9% y/y to 12.6% y/y in January.

Image

There was a price reversal on the daily (D1) timeframe, both from the MACD line and the Marlin oscillator. This means that traders have to take the target level of 1.1900 in order to open the way towards 1.1737.

Image

On the four-hour (H4) timeframe, the price has consolidated under the balance and MACD lines, while the Marlin oscillator consolidated in the area of the downward trend. This indicates that there will be a further downward move in GBP/USD.

*The market analysis posted here is meant to increase your awareness, but not to give instructions to make a trade.

Analysis are provided by InstaForex.

Read More https://ifxpr.com/3xsi7VC
Best regards, PR Manager

Learn more about InstaForex Company at http://instaforex.com
IFX Gertrude
 
Posts: 5198
Joined: Wed Nov 07, 2012 6:25 am

Re: Instaforex Analysis

Postby IFX Gertrude » Fri Feb 17, 2023 9:01 am

Forex Analysis & Reviews: USDCAD Potential for Bullish Rise to 61.8% Fibonacci line

Image

Description :
Looking at the H4 chart, my overall bias for USDCAD is bullish as the current price is above the Ichimoku Cloud. Looking for a pullback buy entry at 1.34295 where the 38.2% Fibonacci line is. We are looking to take profit at 1.35352 where the 61.8% Fibonacci line is, Stop loss will be placed at 1.33638, where the recent swing low is.

Trading Recommendation
Entry: 1.34295
Reason for Entry: 38.2%
Fibonacci line
Take Profit: 1.35352
Reason for Take Profit:
61.8% Fibonacci line
Stop Loss: 1.33638
Reason for Stop Loss:
the recent swing low

*The market analysis posted here is meant to increase your awareness, but not to give instructions to make a trade.

Analysis are provided by InstaForex.

Read More https://ifxpr.com/3YFh0Og
Best regards, PR Manager

Learn more about InstaForex Company at http://instaforex.com
IFX Gertrude
 
Posts: 5198
Joined: Wed Nov 07, 2012 6:25 am

Re: Instaforex Analysis

Postby IFX Gertrude » Mon Feb 20, 2023 1:35 am

Forex Analysis & Reviews: Forecast for EUR/USD on February 20, 2023

The 60-pip decline of EUR/USD last Friday could not be extended. This is because the pair closed with a small white candle, and this morning went back to the range it was trading at last February 16. Although indicator readings have not changed over the past two days, it seems that euro is preparing to overcome the support level of 1.0660.

Image

If that happens, the way towards the target level of 1.0470 will be easier. Market players should look out for the exit of the signal line of the Marlin oscillator, which is marked on the daily (D1) chart with a gray rectangle.

Image

On the four-hour (H4) chart, Friday's growth was stopped by the resistance of the balance and MACD lines. The signal line of the oscillator is also turning down, and although there was a similar pattern of simultaneous reversal of the price and the oscillator from last Thursday, the signal this time may turn out to be more significant.

*The market analysis posted here is meant to increase your awareness, but not to give instructions to make a trade.

Analysis are provided by InstaForex.

Read More https://ifxpr.com/3IDIDS0
Best regards, PR Manager

Learn more about InstaForex Company at http://instaforex.com
IFX Gertrude
 
Posts: 5198
Joined: Wed Nov 07, 2012 6:25 am

Re: Instaforex Analysis

Postby IFX Gertrude » Tue Feb 21, 2023 12:13 am

Forex Analysis & Reviews: Forecast for GBP/USD on February 21, 2023

GBP/USD closed on Monday at Friday's closing levels. Then, this morning, there is a slightly bearish sentiment, which turned the Marlin oscillator in the daily (D1) timeframe down, pushing it towards a negative territory.

Image

It seems that hitting the target level of 1.1900 is becoming more and more plausible. If that happens, the pair will head towards 1.1737, which is the top last September 13, 2022. A price movement below the balance and MACD lines will keep the trend bearish.

But on the four-hour (H4) chart, the pair continues a sideways movement, right between the balance and MACD lines.

Image

The signal line of the Marlin oscillator is reversing from zero, indicating that it is going to test the MACD line (1.1989), which is also the low last February 15. If it succeeds, the pair will decline further to the target support level of 1.1900.

This information is provided to retail and professional clients as part of marketing communication. It does not contain and should not be construed as containing investment advice or investment recommendation or an offer or solicitation to engage in any transaction or strategy in financial instruments. Past performance is not a guarantee or prediction of future performance. Instant Trading EU Ltd. makes no representation and assumes no liability as to the accuracy or completeness of the information provided, or any loss arising from any investment based on analysis, forecast or other information provided by an employee of the Company or otherwise. Full disclaimer is available here.

Risk Warning: CFDs are complex instruments and come with a high risk of losing money rapidly due to leverage. 77.95% of retail investor accounts lose money when trading CFDs with this provider. You should consider whether you understand how CFDs work and whether you can afford to take the high risk of losing your money.

Analysis are provided by InstaForex.

Read More https://ifxpr.com/3IBldvJ
Best regards, PR Manager

Learn more about InstaForex Company at http://instaforex.com
IFX Gertrude
 
Posts: 5198
Joined: Wed Nov 07, 2012 6:25 am

Re: Instaforex Analysis

Postby IFX Gertrude » Wed Feb 22, 2023 2:15 am

Forex Analysis & Reviews: Forecast for EUR/USD on February 22, 2023

This information is provided to retail and professional clients as part of marketing communication. It does not contain and should not be construed as containing investment advice or investment recommendation or an offer or solicitation to engage in any transaction or strategy in financial instruments. Past performance is not a guarantee or prediction of future performance. Instant Trading EU Ltd. makes no representation and assumes no liability as to the accuracy or completeness of the information provided, or any loss arising from any investment based on analysis, forecast or other information provided by an employee of the Company or otherwise. Full disclaimer is available here.


EUR/USD fell by 35 pips on Tuesday, breaking through the support level of 1.0660. However, the decline is short-lived as the pair is already trying to get back above 1.0660 during today's Asian session. This is already the second unsuccessful attempt to go under the support level. The first one was on February 17. Under the new circumstances, the pair may now make an attempt to rise to the target range of 1.0758/87.

Image

If the Marlin oscillator continues to move sideways or go down, the pair will not be able to climb up. After all, a consolidation has been going on since February 6, and a breakout is most likely to occur downward. If that happens, the pair will decline below 1.0595 and go further towards 1.0470.

Image

On the four-hour (H4) timeframe, the pair is under the indicator lines and the Marlin oscillator is moving sideways. Wait for a consolidation above or below 1.0660 and watch for further developments.

Risk Warning: CFDs are complex instruments and come with a high risk of losing money rapidly due to leverage. 77.95% of retail investor accounts lose money when trading CFDs with this provider. You should consider whether you understand how CFDs work and whether you can afford to take the high risk of losing your money.

Analysis are provided by InstaForex.

Read More https://ifxpr.com/3YTyer5
Best regards, PR Manager

Learn more about InstaForex Company at http://instaforex.com
IFX Gertrude
 
Posts: 5198
Joined: Wed Nov 07, 2012 6:25 am

Re: Instaforex Analysis

Postby IFX Gertrude » Thu Feb 23, 2023 1:26 am

Forex Analysis & Reviews: Technical Analysis of Daily Price Movement of AUD/JPY Cross Currency Pairs, Thursday February 23 2023 Kamis 23 Februari 2023.

This information is provided to retail and professional clients as part of marketing communication. It does not contain and should not be construed as containing investment advice or investment recommendation or an offer or solicitation to engage in any transaction or strategy in financial instruments. Past performance is not a guarantee or prediction of future performance. Instant Trading EU Ltd. makes no representation and assumes no liability as to the accuracy or completeness of the information provided, or any loss arising from any investment based on analysis, forecast or other information provided by an employee of the Company or otherwise. Full disclaimer is available here.

Image

Although this time on the daily chart AUD/JPY cross currency pairs is moving in a channel that dips downwards which means that the main bias is still bearish but currently AUD/JPY is experiencing a correction rallying upwards which is marked by the appearance of the Bearish Continuation Ascending Broadening Wedge pattern even though the Bullish 123 pattern has appeared which is followed by the appearance of several Ross Hooks (RH) , while the level that will be tested in the near future is the 92.98 level. If this level is successfully penetrated and as long as it does not return to its initial bias and goes below the 90.74 level, AUD/JPY in the next few days has the potential to test the 93.58 level as its first target and the 94.37 area level. -95.22 as the second target if the momentum and volatility are enough to support.

Risk Warning: CFDs are complex instruments and come with a high risk of losing money rapidly due to leverage. 77.95% of retail investor accounts lose money when trading CFDs with this provider. You should consider whether you understand how CFDs work and whether you can afford to take the high risk of losing your money.

Analysis are provided by InstaForex.

Read More https://ifxpr.com/3kudEi2
Best regards, PR Manager

Learn more about InstaForex Company at http://instaforex.com
IFX Gertrude
 
Posts: 5198
Joined: Wed Nov 07, 2012 6:25 am

Re: Instaforex Analysis

Postby IFX Gertrude » Fri Feb 24, 2023 2:09 am

Forex Analysis & Reviews: Forecast for EUR/USD on February 24, 2023

This information is provided to retail and professional clients as part of marketing communication. It does not contain and should not be construed as containing investment advice or investment recommendation or an offer or solicitation to engage in any transaction or strategy in financial instruments. Past performance is not a guarantee or prediction of future performance. Instant Trading EU Ltd. makes no representation and assumes no liability as to the accuracy or completeness of the information provided, or any loss arising from any investment based on analysis, forecast or other information provided by an employee of the Company or otherwise. Full disclaimer is available here.

On Thursday, the euro showed some volatility, not being able to break away from the target level of 1.0595. This morning, the quote is also fluctuating near that level, but the Marlin oscillator started reversing upward, so it might correct to the resistance at 1.0660. If the price finds the strength to settle under 1.0595, then next week we can expect a hike to the target level of 1.0443/70.

Image

On the four-hour chart, the nearest resistance to the corrective growth is the MACD indicator line (1.0622). Once it overcomes this line, we can expect further price growth. The Marlin oscillator, which has come out of its own descending channel upwards, counts on the bulls' potential success.

Image

There is a traditional nuance - a false exit of the examined line beyond the boundary of the geometrical construction, so we're waiting for the development of events with the formation of confirming signs, both for bulls and bears.

Risk Warning: CFDs are complex instruments and come with a high risk of losing money rapidly due to leverage. 77.95% of retail investor accounts lose money when trading CFDs with this provider. You should consider whether you understand how CFDs work and whether you can afford to take the high risk of losing your money.

Analysis are provided by InstaForex.

Read More https://ifxpr.com/3IPFChC
Best regards, PR Manager

Learn more about InstaForex Company at http://instaforex.com
IFX Gertrude
 
Posts: 5198
Joined: Wed Nov 07, 2012 6:25 am

Re: Instaforex Analysis

Postby IFX Gertrude » Mon Feb 27, 2023 2:28 am

Forex Analysis & Reviews: Forecast for USD/JPY on February 27, 2023

This information is provided to retail and professional clients as part of marketing communication. It does not contain and should not be construed as containing investment advice or investment recommendation or an offer or solicitation to engage in any transaction or strategy in financial instruments. Past performance is not a guarantee or prediction of future performance. Instant Trading EU Ltd. makes no representation and assumes no liability as to the accuracy or completeness of the information provided, or any loss arising from any investment based on analysis, forecast or other information provided by an employee of the Company or otherwise. Full disclaimer is available here.

On Friday, the yen showed its intention to break through the 137.70 target. Overcoming the resistance of this embedded price channel line will allow the pair to try and hit 138.90, 140.90 as well as other target levels.

Image

However, this brilliant plan is hindered by the Marlin oscillator, which is very reluctant to continue rising on the daily chart. The prospect of its growth is great, but the potential for a reversal to the downside is also great. It is very likely that before the price climbs above 137.70, the correctional decline to 133.90 will follow.

Image

On the four-hour chart, so far, the situation supports the growth scenario - the price is above the indicator lines, and after the reversal from the MACD line, the Marlin oscillator is in a position to rise. We're waiting for the completion of the growing branch of the 133.90-137.70 range.

Risk Warning: CFDs are complex instruments and come with a high risk of losing money rapidly due to leverage. 77.95% of retail investor accounts lose money when trading CFDs with this provider. You should consider whether you understand how CFDs work and whether you can afford to take the high risk of losing your money.

Analysis are provided by InstaForex.


Read More https://ifxpr.com/3IXaJrS
Best regards, PR Manager

Learn more about InstaForex Company at http://instaforex.com
IFX Gertrude
 
Posts: 5198
Joined: Wed Nov 07, 2012 6:25 am

Re: Instaforex Analysis

Postby IFX Gertrude » Tue Feb 28, 2023 1:15 am

Forex Analysis & Reviews: Forecast for GBP/USD on February 28, 2023

Yesterday, the pound made a big gain ahead of the currency market (122 points). The price overcame the signal level of 1.2030 and now it is aiming for the target level of 1.2155. On the daily chart, the signal line of the Marlin oscillator turned out to have made a false plunge under the graphical linear support (turquoise line).

Image

The oscillator's move into positive territory has now dramatically increased the odds. An important sign of the price reversal in the medium-term growth will be its consolidation above 1.2155, the final sign - over the MACD line (1.2315). But this, of course, is an alternative scenario. In current conditions, I don't expect the pound to climb above 1.2155. If such growth happens, it is very likely to be false.

Image

On the four-hour chart, so far, the situation supports the growth scenario - the price is above the indicator lines, and after the reversal from the MACD line, the Marlin oscillator is in a position to rise. We're waiting for the completion of the growing branch of the 133.90-137.70 range.

On the four-hour chart, the price has consolidated above both indicator lines, the Marlin has settled in the uptrend zone. We are waiting for the end of the pound's bullish correction. The opposite signal, confirming the reversal in the medium-term decline, will be the price moving below the MACD line (1.1980).

Analysis are provided by InstaForex.

Read More https://ifxpr.com/3ItWedm
Best regards, PR Manager

Learn more about InstaForex Company at http://instaforex.com
IFX Gertrude
 
Posts: 5198
Joined: Wed Nov 07, 2012 6:25 am

PreviousNext

Return to Forex Brokers