Instaforex Analysis

Forex broker related topics and discussions

Re: Instaforex Analysis

Postby IFX Gertrude » Thu Oct 27, 2022 2:21 am

Forex Analysis & Reviews: Gold still attractive for buyers

Image

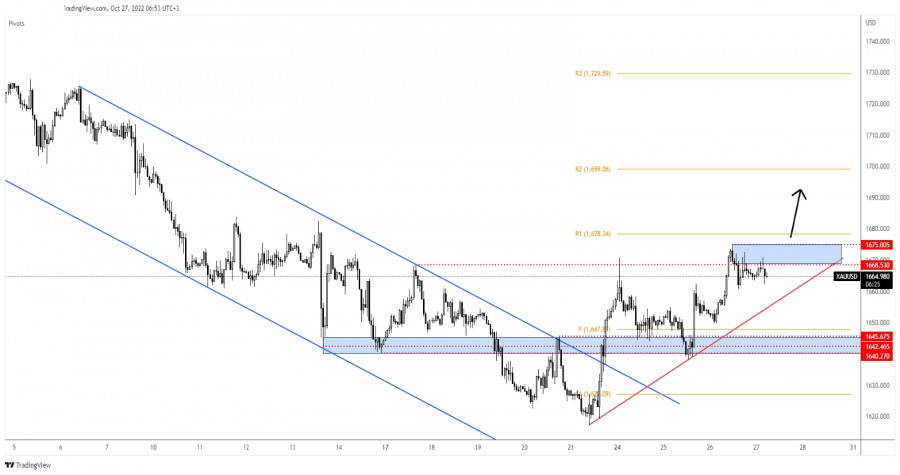
The price of gold dropped in the short term after reaching the 1,675 level. Now, it is traded at 1,664 at the time of writing. XAU/USD slipped lower as the DXY tried to rebound. Still, Gold could try to develop a new bullish momentum as the Dollar Index is under downside pressure.

Today, the fundamentals will drive the price, so you have to be careful. The ECB is expected to increase the Main Refinancing Rate from 1.25% to 2.00%. The Monetary Policy Statement and the ECB Press Conference could really shake the markets.

Also, the US Advance GDP is expected to register a 2.3% growth, Advance GDP Price Index may report a 5.3% growth, Unemployment Claims could be reported at 219K, Durable Goods Orders could register a 0.6% growth, while Core Durable Goods Orders may report a 0.2% growth.

As you can see on the H1 chart, XAU/USD found resistance at 1,668. The bias remains bullish as long as it stays above the uptrend line. Technically, after its strong growth, a temporary drop was natural.

Staying near the 1,668 resistance may signal an imminent breakout. Temporary consolidation could bring more bullish energy and attract more buyers.

XAU/USD Forecast!

Staying above the minor uptrend line and making a valid breakout above 1,675 could confirm further growth. A new higher high is seen as a buying opportunity. The 1,700 psychological level and the R2 (1,699) represent upside targets.

*The market analysis posted here is meant to increase your awareness, but not to give instructions to make a trade.

Analysis are provided by InstaForex.

Read More https://ifxpr.com/3U54Sn7
Best regards, PR Manager

Learn more about InstaForex Company at http://instaforex.com
IFX Gertrude
 
Posts: 5198
Joined: Wed Nov 07, 2012 6:25 am

Re: Instaforex Analysis

Postby IFX Gertrude » Thu Oct 27, 2022 2:41 am

Forex Analysis & Reviews: Forecast for EUR/USD on October 27, 2022

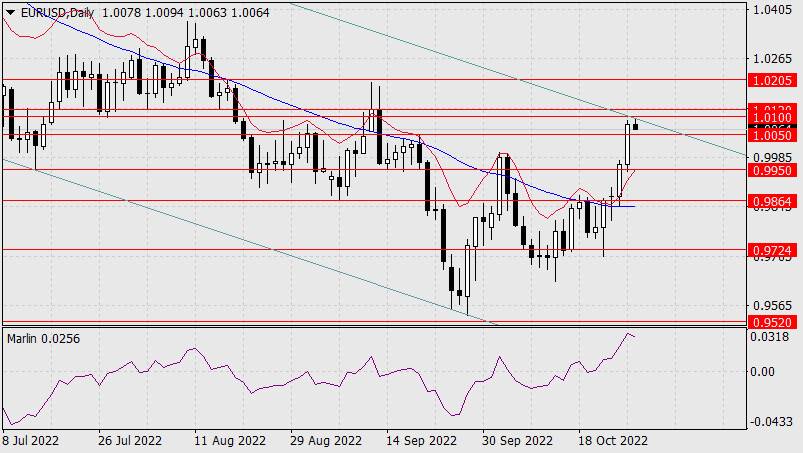
The euro is not letting up and yesterday it grew by another 113 points to the target range of 1.0100/20. And once again, the market is asking the question - will there be a reversal today due to the "soft" statement of the European Central Bank after the rate hike by 0.75% and the expected growth of US GDP for the 3rd quarter by 2.4%, which will mean the end of the recession?

Image

From a purely technical point of view, the probability of a reversal is 60%, since the price is at the upper border of the downward price channel of the weekly timeframe. The Marlin Oscillator is also not averse to turning down. Of course, the price's exit above the target range of 1.0100/20 will allow the price to reach the target of 1.0205 - to renew the high on September 12th.

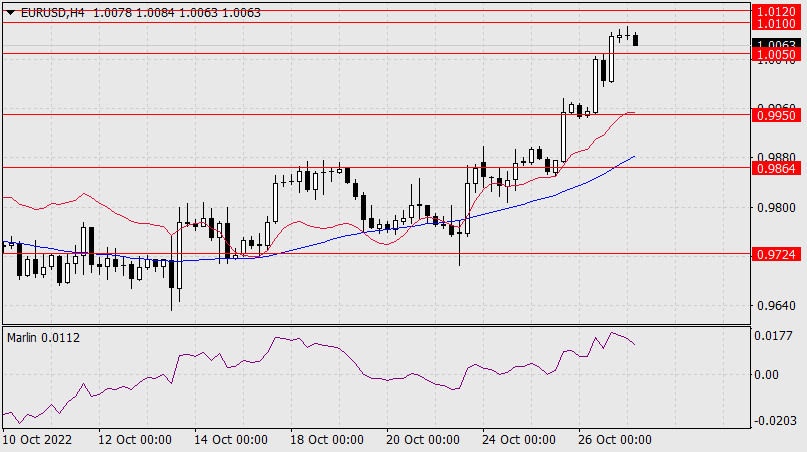
Additional information, unfortunately, is not visible on the four-hour chart. The price is quite able to reach the 1.0100/20 range, but the indicators do not suggest what will happen next. Without a doubt, today's events (the ECB meeting and the release of the US GDP) are such important events that they can move the single currency's quote in any direction. We are waiting for the development of events. In general, the fundamental pressure on the euro remains and the ongoing growth is still a correction.

Image

Analysis are provided by InstaForex.

Read More https://ifxpr.com/3NcUyad
Best regards, PR Manager

Learn more about InstaForex Company at http://instaforex.com
IFX Gertrude
 
Posts: 5198
Joined: Wed Nov 07, 2012 6:25 am

Re: Instaforex Analysis

Postby IFX Gertrude » Fri Oct 28, 2022 5:21 am

Forex Analysis & Reviews: Technical Analysis of GBP/USD for October 28, 2022

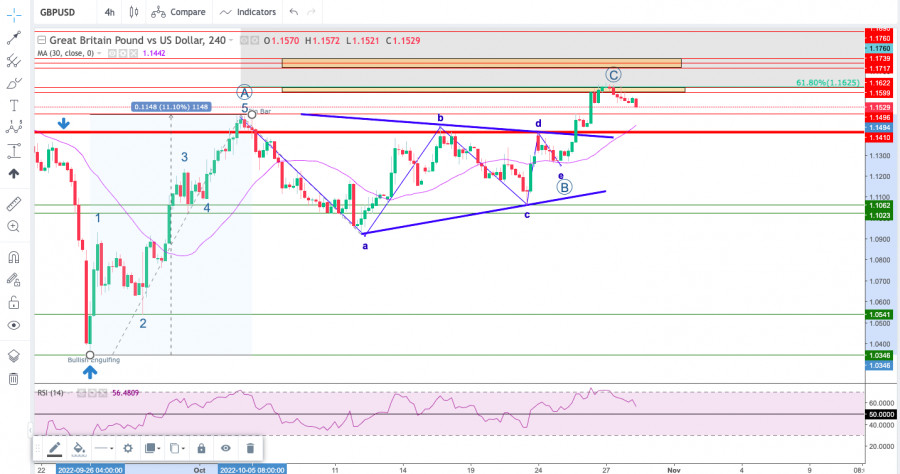
Technical Market Outlook: The GBP/USD pair has hit the projected target level at 1.1625 (61% Fibonacci extension of the wave A) and is approaching the intraday technical support seen at 1.1496. The local high was even made at the level of 1.1644 before the Pin Bar candlestick pattern forced bulls to pull-back towards the technical support. The market is ready to extend the breakout towards the projected target level located at 1.1717 (supply zone) or higher. The intraday technical support is seen at 1.1496 and 1.1544. The momentum is strong and positive, which supports the short-term bullish outlook for GBP. Only a sudden and strong breakout below the 30 periods moving average would change the imminent outlook to bearish.

Image

Weekly Pivot Points:
WR3 - 1.15209
WR2 - 1.14338
WR1 - 1.13938
Weekly Pivot - 1.13467
WS1 - 1.13067
WS2 - 1.12596
WS3 - 1.11725

Trading Outlook:
The bears are still in charge of Cable and the next long-term target for them is the parity level. The level of 1.0351 has not been tested since 1985, so the down trend is strong, however, the market is extremely oversold on longer time frames already. In order to terminate the down trend, bulls need to break above the level of 1.2275 (swing high from August 10th).

*The market analysis posted here is meant to increase your awareness, but not to give instructions to make a trade.

Analysis are provided by InstaForex.

https://ifxpr.com/3TLfxn6
Best regards, PR Manager

Learn more about InstaForex Company at http://instaforex.com
IFX Gertrude
 
Posts: 5198
Joined: Wed Nov 07, 2012 6:25 am

Re: Instaforex Analysis

Postby IFX Gertrude » Mon Oct 31, 2022 12:17 am

Forex Analysis & Reviews: Forecast for EUR/USD on October 31, 2022

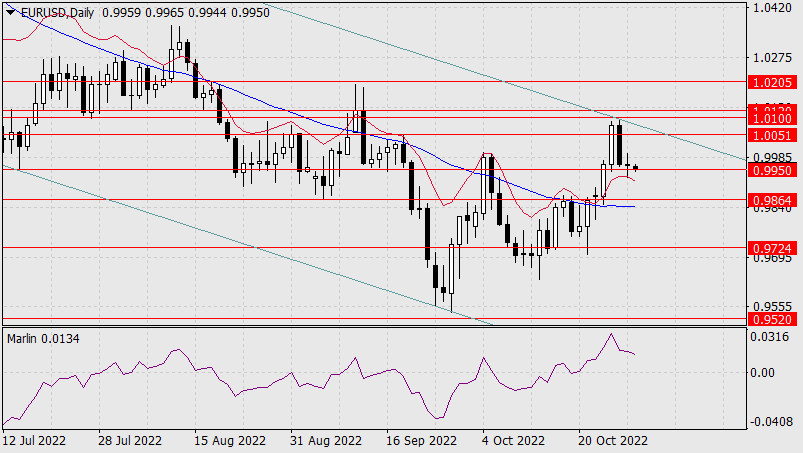
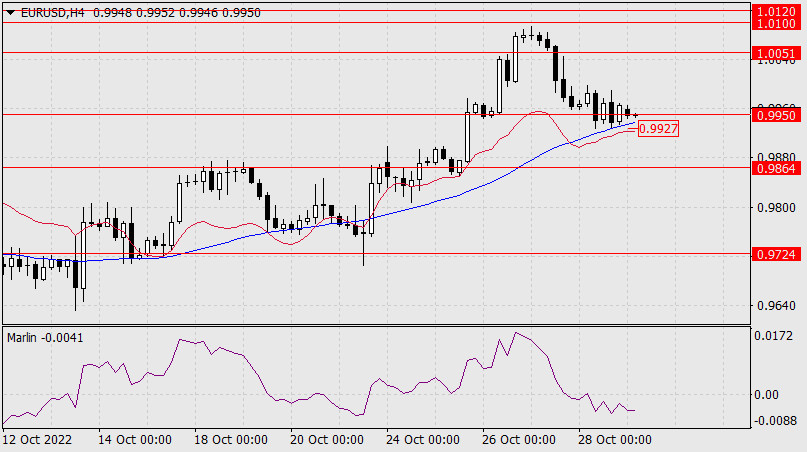
On Monday, the euro faces the 0.9959 support level.The target level of 0.9864 is at the bottom, and at the top is the resistance of 1.0051 (high on September 20) and the upper limit of the price channel. In general, the dollar feels strong on the market, but there is also an increased interest in risk in the market, which can pull the euro up (on Friday, the S&P 500 added 2.46%).

Image

On the other hand, Friday could also be the last day of such appetites, as the Federal Reserve is expected to raise the rate by 0.75% to 4.00% on Wednesday. Also, weak data on the eurozone may come out today. Retail sales in Germany for September are expected to be -0.3% m/m (decreasing at an annual pace from -4.3% to -4.9%), while euro area GDP for the 3rd quarter may be as low as 0.1%, which will reduce annual growth from 4.1% to 2.1%. The euro is more likely to decline from these positions. After consolidating under 0.9950, we are waiting for the price at 0.9864.

Image

On the four-hour chart, the price is consolidating at the support level and on the MACD indicator line. Overcoming supports will be a signal to decline. More precisely, the signal level is Friday's low at 0.9927. The Marlin Oscillator is falling in negative territory.

Analysis are provided by InstaForex.

Read More https://ifxpr.com/3DMvRyr
Best regards, PR Manager

Learn more about InstaForex Company at http://instaforex.com
IFX Gertrude
 
Posts: 5198
Joined: Wed Nov 07, 2012 6:25 am

Re: Instaforex Analysis

Postby IFX Gertrude » Tue Nov 01, 2022 1:30 am

Forex Analysis & Reviews: Forecast for EUR/USD on November 1, 2022

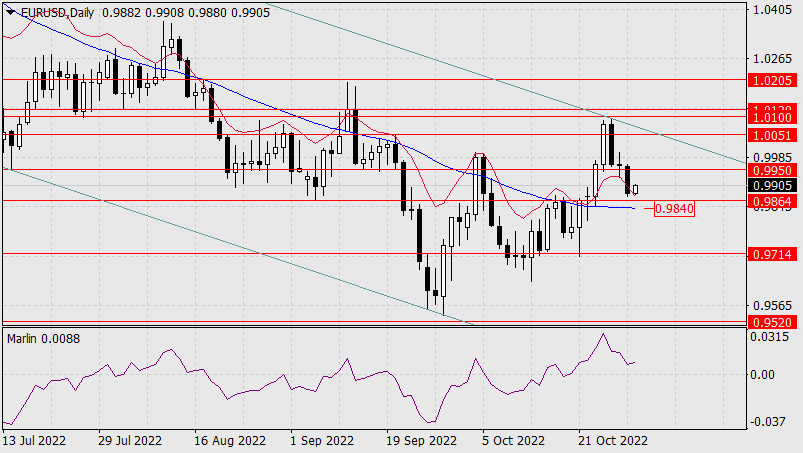
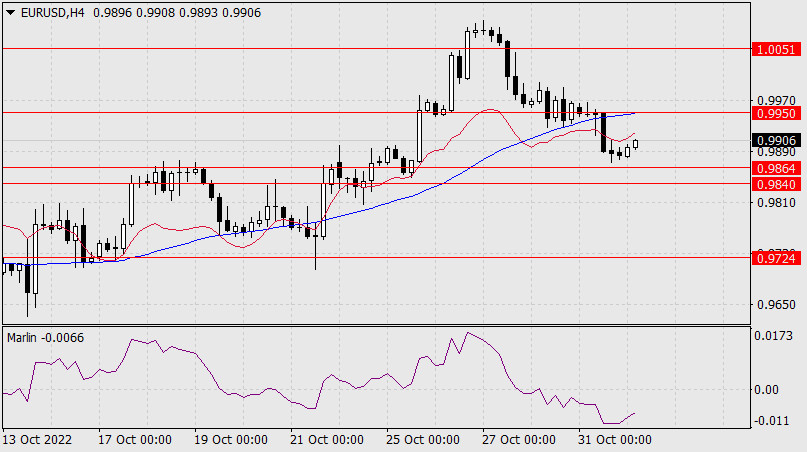
The euro undertook a downward breakout on Monday. Having made a path of 80 points, the euro has almost reached the target support of 0.9864. Apparently, the price lingered before the support to build up strength before it was overcome, as the support is strengthened by the MACD line (0.9840). Overcoming the formed range (0.9840/64) opens a further path to the target support at 0.9715 – to the April 2000 high.

Image

The Marlin Oscillator is approaching the zero line on the daily. It is likely that the price will overcome the support range and the zero line oscillator at the same time. Such synchronization will lead to a powerful downward movement. In terms of timing, such a breakthrough may take place tomorrow - on the day of the Federal Reserve meeting.

On the four-hour chart, the price consolidated under the indicator lines of balance (red) and MACD. The Marlin Oscillator is developing in the downward trend zone. Today, consolidation is likely before the breakout of the planned supports, or even the first attempt at such a breakout.

Image

*The market analysis posted here is meant to increase your awareness, but not to give instructions to make a trade.

Analysis are provided by InstaForex.

Read More https://ifxpr.com/3Wl7xuv
Best regards, PR Manager

Learn more about InstaForex Company at http://instaforex.com
IFX Gertrude
 
Posts: 5198
Joined: Wed Nov 07, 2012 6:25 am

Re: Instaforex Analysis

Postby IFX Gertrude » Wed Nov 02, 2022 2:10 am

Forex Analysis & Reviews: Elliott wave analysis of Litecoin for November 2, 2022

Image

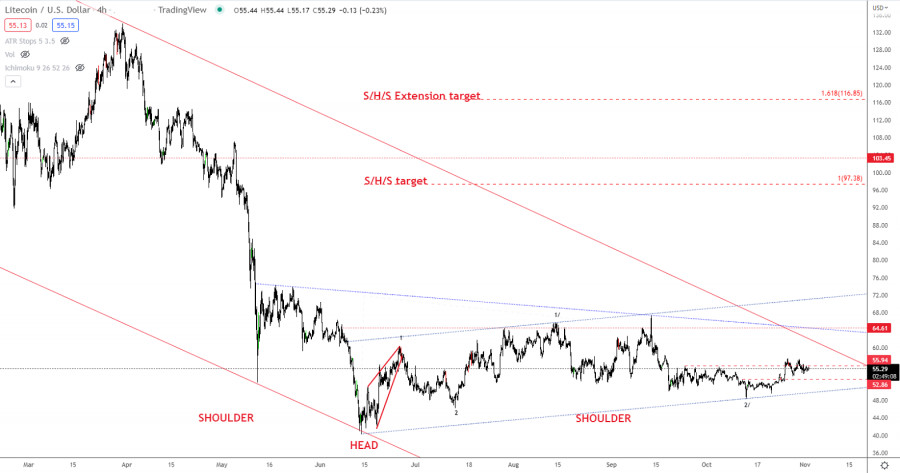
Litecoin is still fighting to break clear of resistance at 55.94. A break above minor resistance at 57.40 will confirm continuation higher towards the neckline resistance near 64.60. Only a break above here activates the formation for a rally towards the S/H/S target at 97.38 and possibly even closer to the extension target at 116.85. Only a break below support at 54.18 will delay the expected rally higher and call for a dip to 50.00 before turning higher again.

*The market analysis posted here is meant to increase your awareness, but not to give instructions to make a trade.

Analysis are provided by InstaForex.

https://ifxpr.com/3SVoSHQ
Best regards, PR Manager

Learn more about InstaForex Company at http://instaforex.com
IFX Gertrude
 
Posts: 5198
Joined: Wed Nov 07, 2012 6:25 am

Re: Instaforex Analysis

Postby IFX Gertrude » Thu Nov 03, 2022 2:23 am

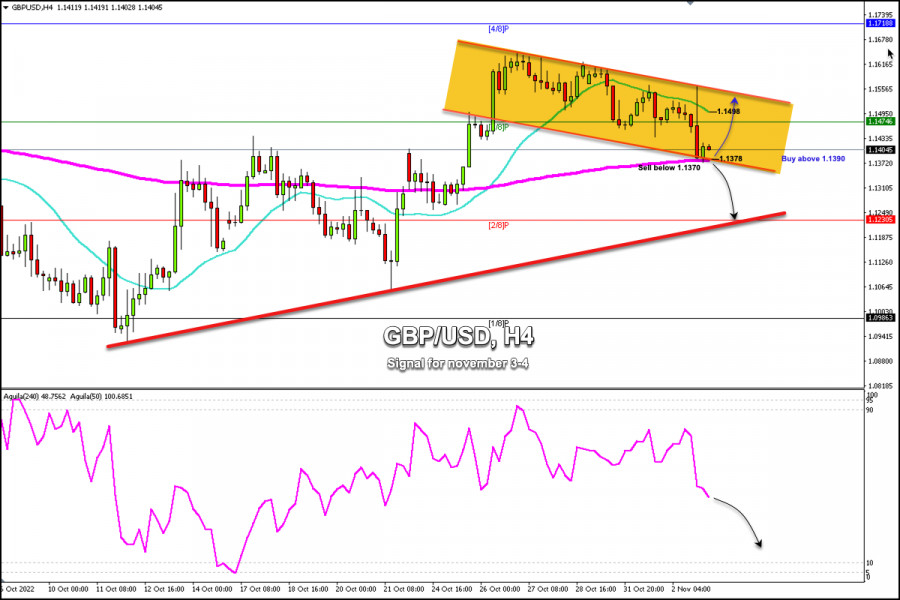
Forex Analysis & Reviews: Trading Signal for GBP/USD on November 3-4, 2022: buy above 1.1378 (200 EMA - bottom bearish channel)

Image

In the next few hours, we could expect a technical bounce above the 200 EMA around 1.1378. So, the price could reach 3/8 Murray at 1.1474 and even 1.1550 (top bearish channel).

Conversely, in case of a sharp break below the 200 EMA and a daily close on the 4-hour chart below 1.1370, the currency pair could continue the bearish bias and the price could reach 2/8 Murray around 1.1230.

The eagle indicator is giving a negative signal and any bounce towards the psychological level of 1.15 will be considered a signal to continue selling. Our trading plan for the next few hours is to buy above the 200 EMA and above the bottom of the downtrend channel around 1.1378 with targets at 1.1474 and 1.1530.

On the other hand, the signal to sell will be activated if there is a strong break below 1.1370 (200 EMA) with targets at 1.1230.

As long as the GBP/USD pair trades within the downtrend channel formed since Oct 26, any technical bounce back towards the 21 SMA located at 1.14 98 will be seen as an opportunity to sell.

*The market analysis posted here is meant to increase your awareness, but not to give instructions to make a trade.

Analysis are provided by InstaForex.

https://ifxpr.com/3DWI43t
Best regards, PR Manager

Learn more about InstaForex Company at http://instaforex.com
IFX Gertrude
 
Posts: 5198
Joined: Wed Nov 07, 2012 6:25 am

Re: Instaforex Analysis

Postby IFX Gertrude » Fri Nov 04, 2022 1:14 am

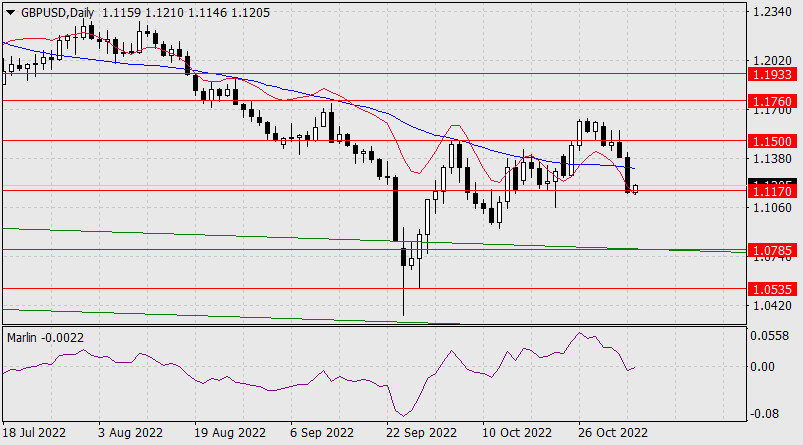
Forex Analysis & Reviews: Forecast for GBP/USD on November 4, 2022

The Bank of England raised the rate to the expected 0.75% and warned of two points: in the future, the pace of the rate hike will slow down, from the 3rd quarter the UK economy will enter a recession and it will last until mid-2024 with an increase in unemployment until the end of the 25th year to 6.4%. The pound fell by 230 points. Data on British GDP for the 3rd quarter will be released on November 11, the forecast of economists is -0.2%, obviously, the forecast coincides with the calculations of the central bank.

Image

The decline continued to the target level of 1.1170 on the daily chart. The signal line of the Marlin Oscillator went below the zero line into the area of the downtrend. After the price settles under 1.1170, we are waiting for the pound to fall further to 1.0785 - to the line of the price channel of the higher timeframe.

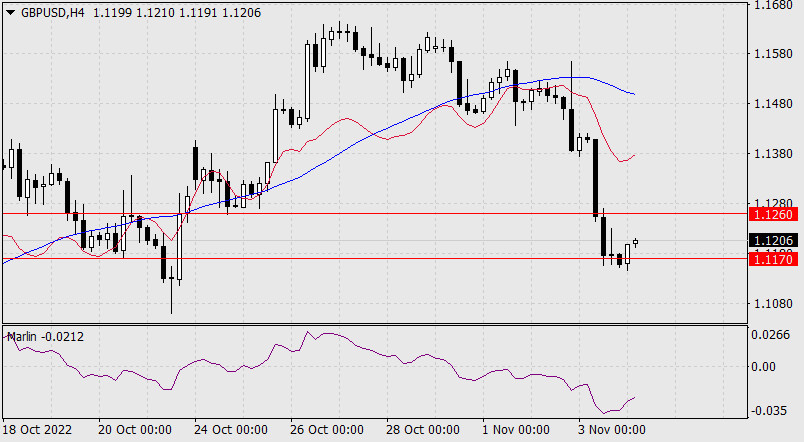
On the four-hour chart, the price, together with the Marlin Oscillator, is turning into a slight correction. Perhaps the correction will last until the first noticeable resistance at 1.1260 - the former local support for October. After the end of the correction, we are waiting for a further fall towards the specified target.

Image

*The market analysis posted here is meant to increase your awareness, but not to give instructions to make a trade.

Analysis are provided by InstaForex.

Read More https://ifxpr.com/3Nyw63c
Best regards, PR Manager

Learn more about InstaForex Company at http://instaforex.com
IFX Gertrude
 
Posts: 5198
Joined: Wed Nov 07, 2012 6:25 am

Re: Instaforex Analysis

Postby IFX Gertrude » Mon Nov 07, 2022 3:57 am

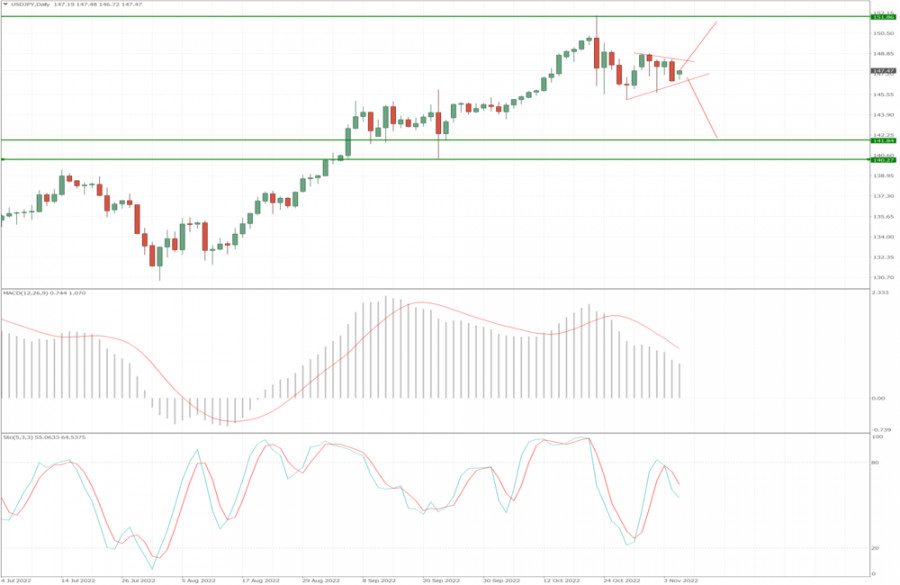
Forex Analysis & Reviews: USD/JPY analysis for November 07, 2022 - Triangle pattern in creation

Image

USD/JPY has been trading sideways at the price of 147.45. I see potential for the breakout play. Trading recommendation:

Due to the range condition, watch for potential breakout of the trading range to confirm further direction. In case of the upside breakout of the resistance at 148.80, watch for buying opportunities with the upside objective at 151.85.

In case of the downside breakout of the support at 145.65, watch for selling opportunities with the downside objective at 141.85 *The market analysis posted here is meant to increase your awareness, but not to give instructions to make a trade.

Analysis are provided by InstaForex.

Read More https://ifxpr.com/3NEOZl8
Best regards, PR Manager

Learn more about InstaForex Company at http://instaforex.com
IFX Gertrude
 
Posts: 5198
Joined: Wed Nov 07, 2012 6:25 am

Re: Instaforex Analysis

Postby IFX Gertrude » Tue Nov 08, 2022 1:51 am

Forex Analysis & Reviews: Forecast for AUD/USD on November 8, 2022

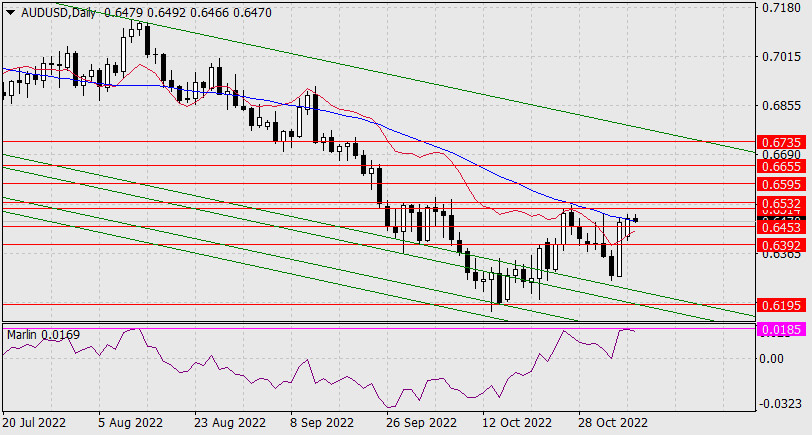
The Australian dollar managed to overcome the resistance of the MACD indicator line on the daily chart. Today it opened above this line. Now the price will try to master the target range of 0.6514/32. If it is overcome, then the next target will be the level of 0.6592.

Image

The daily Marlin Oscillator is in the neutral position, and it reached a reversal level on October 27 and August 12 (0.0185 on the indicator scale), which increases the psychological tension in connection with the upcoming US Congressional elections today.

Image

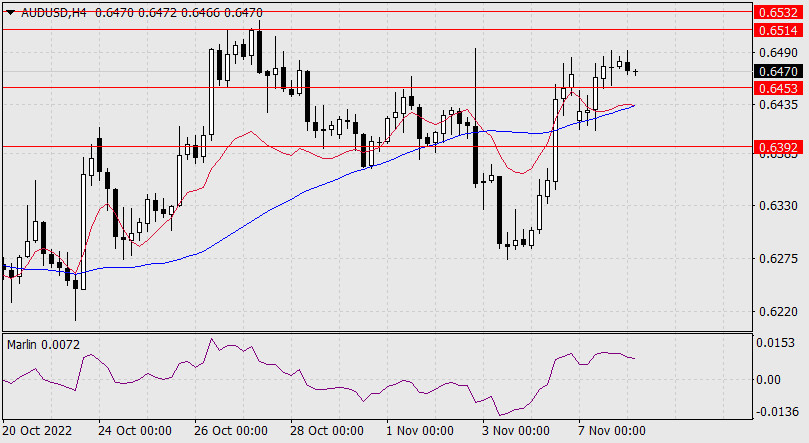
On the four-hour chart, the price is above the indicator lines, Marlin is in the positive area and shows the intention to develop a sideways movement. In general, the expectation is positive, that is, the market is preparing to meet the victory of the Republicans. But we are not in a hurry with such expectations, so we just follow the course of events.

*The market analysis posted here is meant to increase your awareness, but not to give instructions to make a trade.

Analysis are provided by InstaForex.

https://ifxpr.com/3hn3Nsy
Best regards, PR Manager

Learn more about InstaForex Company at http://instaforex.com
IFX Gertrude
 
Posts: 5198
Joined: Wed Nov 07, 2012 6:25 am

PreviousNext

Return to Forex Brokers