Instaforex Analysis

Forex broker related topics and discussions

Re: Instaforex Analysis

Postby IFX Bella » Wed Apr 24, 2024 8:35 am

Forex Analysis & Reviews: USD/JPY: Simple trading tips for novice traders on April 24th (US session)

Image

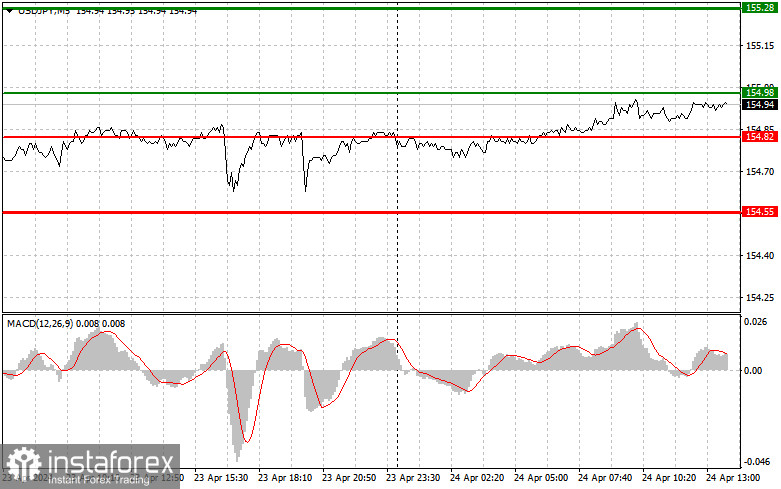
Trade analysis and advice on trading the Japanese yen In line with our usual trading approach, there were no tests of the levels I indicated in the first half of the day near the annual maximum, which prevented entry into the market. Traders betting on the rise of the dollar are increasingly adhering to a strategy of buying on declines from good and solid levels, as only some believe in breaking the annual maximum and significant growth after that. I advise you to do the same, especially since there are no forthcoming statistics capable of leading to breakthroughs in maximums. Data on changes in US durable goods orders is expected, and that's about it. So, trading within the channel and buying on downward slips will be the most relevant option. As for the intraday strategy, I will rely more on scenario #2.
Image

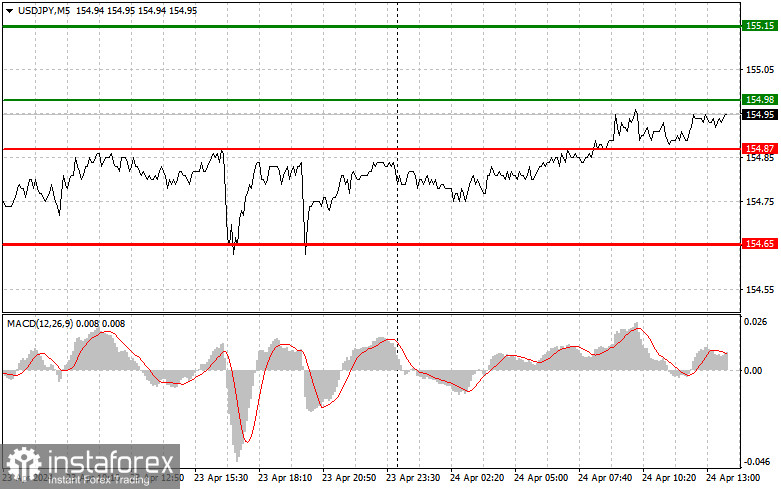
Buy Signal Scenario #1: Today, I plan to buy USD/JPY when the entry point reaches around 154.98 (green line on the chart), with the target of rising to the level of 155.15 (thicker green line on the chart). At around 155.15, I will exit purchases and open sales in the opposite direction (aiming for a movement of 30-35 pips in the opposite direction from the level). Counting on the pair's rise today will only work after very strong US statistics. Important! Before buying, make sure that the MACD indicator is above the zero mark and is just starting to rise from it. Scenario #2: I also plan to buy USD/JPY today in case of two consecutive tests of the price at 154.87 when the MACD indicator is in the oversold zone. This will limit the downward potential of the pair and lead to a reversal of the market upwards. Expect a rise to the opposite levels of 154.98 and 155.15. Sell Signal Scenario #1: I plan to sell USD/JPY today after updating the level of 154.87 (red line on the chart), which will lead to a rapid decline in the pair. The key target for sellers will be the level of 154.65, where I will exit sales and also immediately open purchases in the opposite direction (aiming for a movement of 20-25 points in the opposite direction from the level). Pressure on the pair will return in case of an unsuccessful breakout of the daily maximum. Important! Before selling, make sure that the MACD indicator is below the zero mark and is just starting to decrease from it. Scenario #2: I also plan to sell USD/JPY today in case of two consecutive tests of the price at 154.98 when the MACD indicator is in the overbought zone. This will limit the upward potential of the pair and lead to a reversal of the market downwards. Expect a decline to the opposite levels of 154.87 and 154.65.

Analysis are provided by InstaForex.


Read more: https://ifxpr.com/49Stirt
IFX Bella
 
Posts: 101
Joined: Sat Dec 08, 2012 12:39 am

Re: Instaforex Analysis

Postby IFX Bella » Thu Apr 25, 2024 7:12 am

Forex Analysis & Reviews: EUR/USD. April 25th. Bulls continue to advance and expect a weak US GDP report

Image

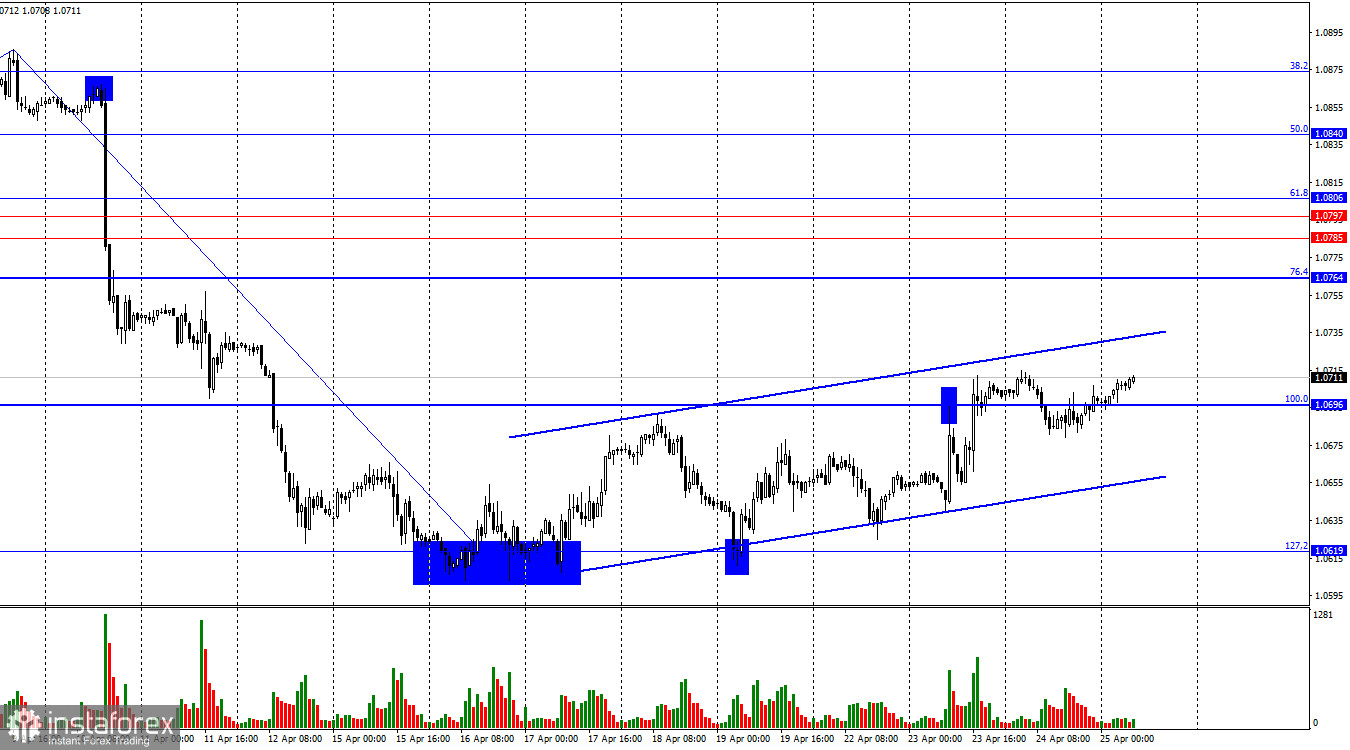
The EUR/USD pair made a new turnaround in favor of the European currency on Wednesday, consolidating above the corrective level of 100.0%-1.0696. Thus, the growth process may continue today towards the next Fibonacci level at 76.4% (1.0764). The ascending trend channel characterizes the current sentiment of traders as bullish, but I remind you that the bearish trend persists. Consolidation of the pair's rate below the corridor will favor the US currency and resume the decline of the euro.

The wave situation remains unchanged. The last completed downward wave broke the low of the previous wave (from April 2), while the new upward wave is still too weak to break the last peak from April 9. Thus, we are dealing with a bearish trend, and at the moment, there is no sign of its completion. For such a sign to appear, the new upward wave needs to break the peak of the previous wave (from April 9). Alternatively, the next downward wave should fail to break the last low from April 16. Until then, the bears will maintain the advantage. The information background on Wednesday needed to be more formal for traders. The report on durable goods orders in the US showed an increase of 2.6% in March against market expectations of +2.5%. Orders excluding transportation increased by 0.2% against forecasts of +0.3%. Orders excluding defense increased by 0.2% against market expectations of +0.2%. Thus, all three reports, which could prompt traders to trade more actively, had little impact on their sentiment. Today, we await the US GDP report for the first quarter, which may suffer the same fate as yesterday's publications.

Image

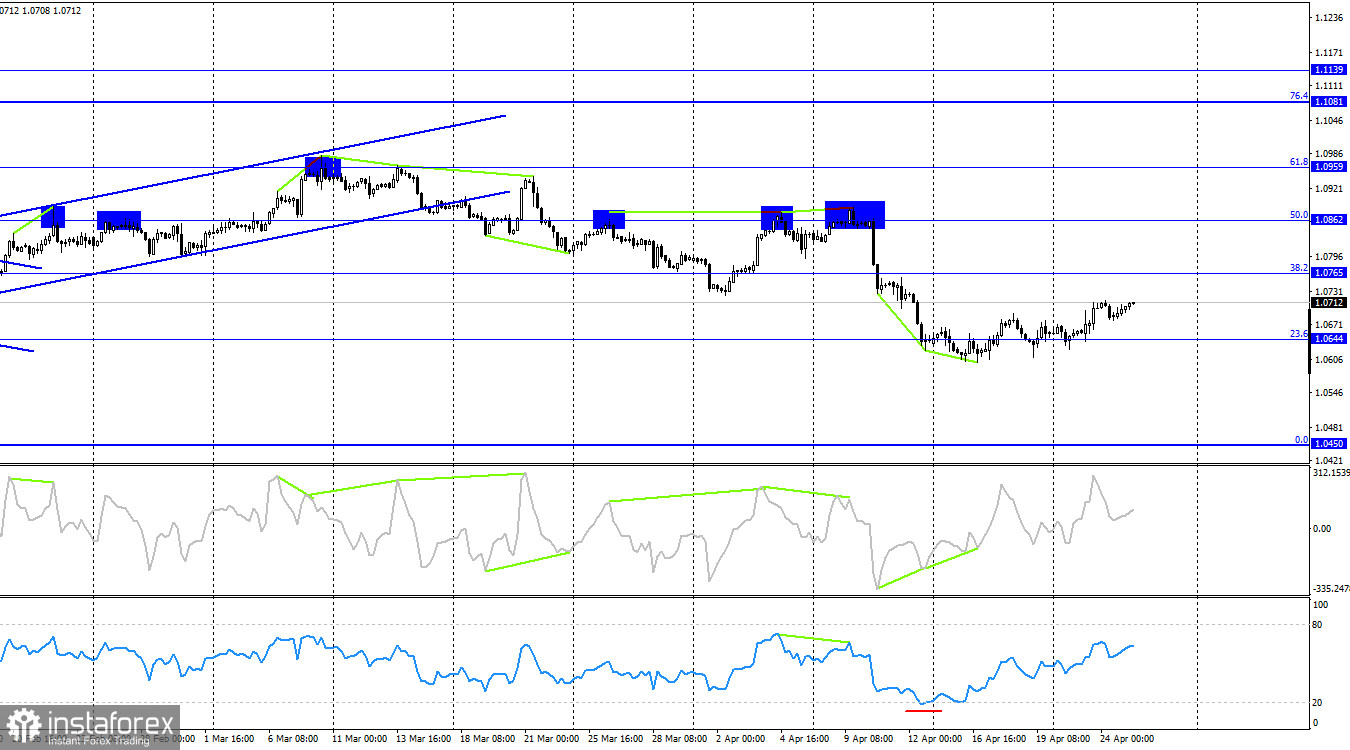
In the last reporting week, speculators opened 3493 long contracts and 23992 short contracts. The sentiment of the "non-commercial" group remains bullish but continues to weaken rapidly. The total number of long contracts held by speculators now stands at 179,000, while short contracts amount to 167,000. The situation will continue to change in favor of bears. In the second column, we see that the number of short positions increased from 92,000 to 167,000 over the last 3 months. Over the same period, the number of long positions decreased from 211,000 to 179,000. Bulls have dominated the market for too long, and now they need strong information to resume the bullish trend. However, the information background has only been supporting bears lately. The European currency could have lost much more ground in recent weeks.


Analysis are provided by InstaForex.


Read more: https://ifxpr.com/49QZifp
IFX Bella
 
Posts: 101
Joined: Sat Dec 08, 2012 12:39 am

Re: Instaforex Analysis

Postby IFX Bella » Fri Apr 26, 2024 8:37 am

Forex Analysis & Reviews: EUR/USD. April 26th. Bulls continue to advance after the GDP report

Image

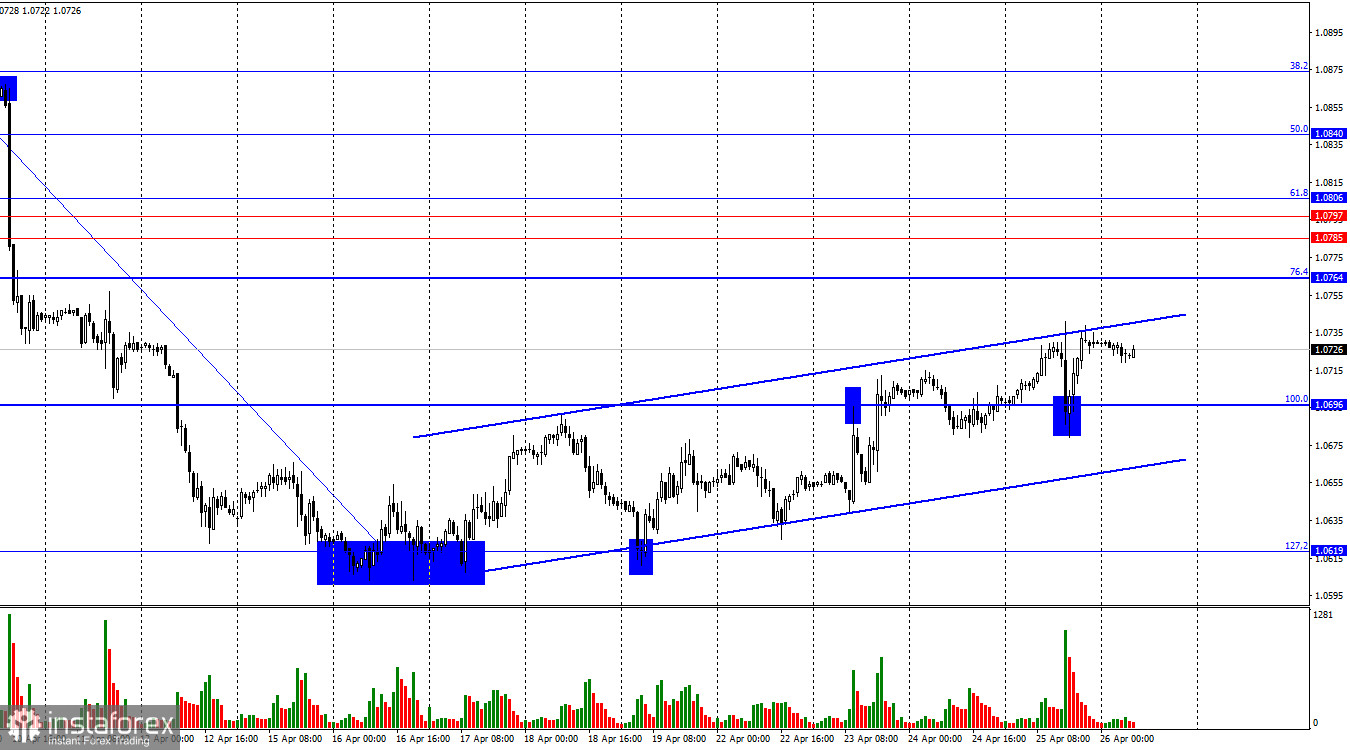
The EUR/USD pair on Thursday rebounded from the corrective level of 100.0%-1.0696 and resumed its upward movement towards the corrective level of 76.4%-1.0764. The ascending trend channel continues to characterize the current market sentiment as "bullish." Consolidation of quotes below the ascending corridor will change the market sentiment to "bearish" and may lead to a resumption of the pair's decline towards the level of 1.0619 and below.

The wave situation remains unchanged. The last completed downward wave broke the low of the previous wave (from April 2nd), and the new upward wave is still too weak to break the last peak from April 9th. Thus, we are dealing with a "bearish" trend, and at the moment, there is no sign of its completion. For such a sign to appear, the new upward wave needs to break the peak of the previous wave (from April 9th). If the next downward wave fails to break the last low from April 16th, this will also be a sign of a trend change to "bullish." Until then, the bears will maintain their advantage. The information background on Thursday was important and strong. Traders learned about the economic growth of the United States in the first quarter. It amounted to 1.6% quarter-on-quarter and 3.1% year-on-year. It is noteworthy that the quarterly GDP of the United States turned out to be significantly below traders' expectations, while the annual one was higher. Bears failed to benefit from this report, as the quarterly value is still slightly more important. The American economy continues to slow down for the second quarter in a row, and the pace of the slowdown is quite high. At this rate, by the end of the year, the US economy may show growth close to zero, as is currently happening in the UK and the EU. A reduction in the Federal Reserve rate will not happen anytime soon, so the US economy may continue to slow down.

Image

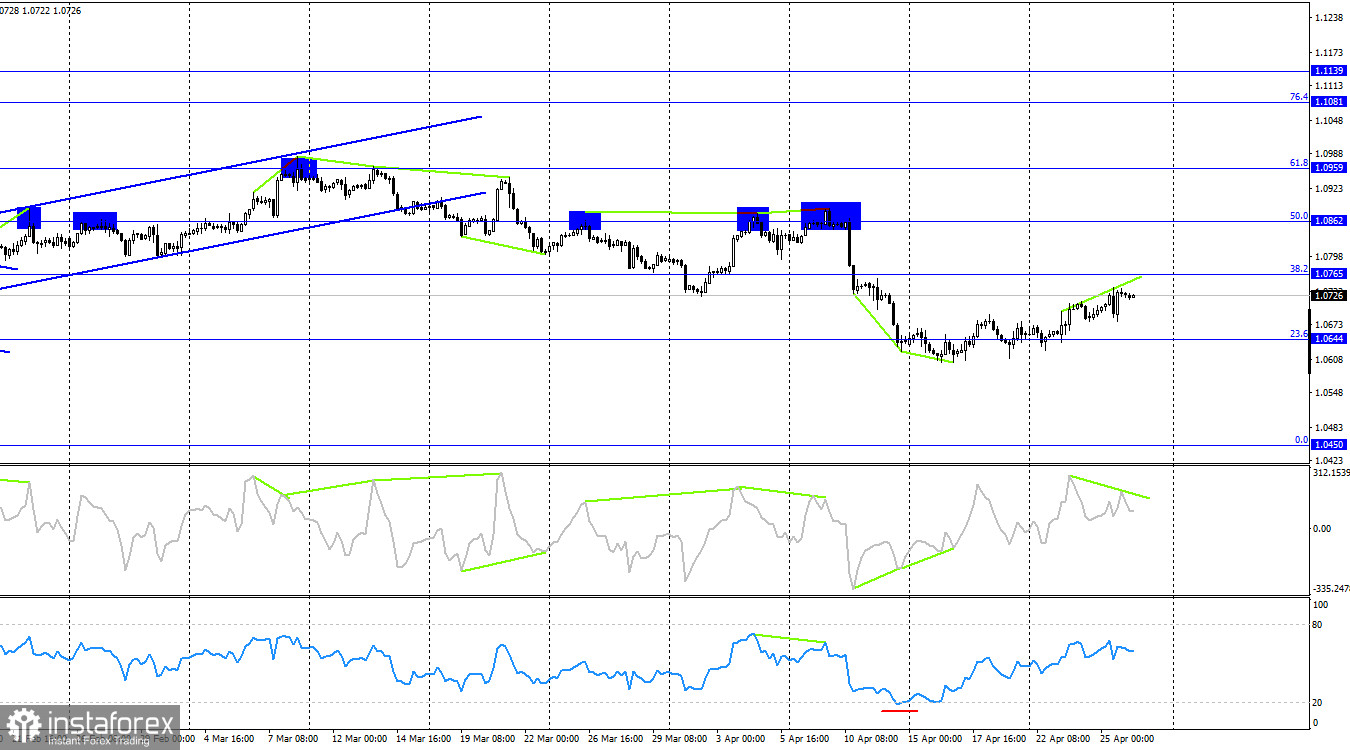
In the last reporting week, speculators opened 3493 long contracts and 23992 short contracts. The sentiment of the "Non-commercial" group remains "bullish" but continues to weaken rapidly. The total number of Long contracts held by speculators now stands at 179 thousand, while Short contracts amount to 167 thousand. The situation will continue to change in favor of bears. In the second column, we see that the number of Short positions has increased from 92 thousand to 167 thousand over the past 3 months. During the same period, the number of Long positions decreased from 211 thousand to 179 thousand.


Analysis are provided by InstaForex.

Read more: https://ifxpr.com/4dcIhzc
IFX Bella
 
Posts: 101
Joined: Sat Dec 08, 2012 12:39 am

Re: Instaforex Analysis

Postby IFX Bella » Mon Apr 29, 2024 8:44 am

Forex Analysis & Reviews: GBP/USD: trading plan for the US session on April 29th (analysis of morning deals). The pound continues to be bought at every opportunity

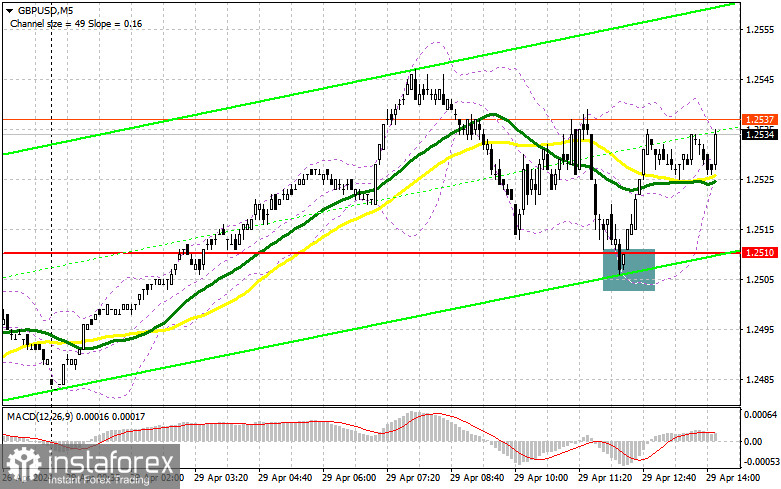
Image


In my morning forecast, I paid attention to the 1.2510 level and planned to make decisions on entering the market from it. Let's look at the 5-minute chart and figure out what happened there. The decline and the formation of a false breakdown there after an unsuccessful attempt to gain a foothold below 1.2510 allowed us to get a buy signal, which resulted in a 30-point increase in the pair. In the afternoon, the technical picture was not revised.

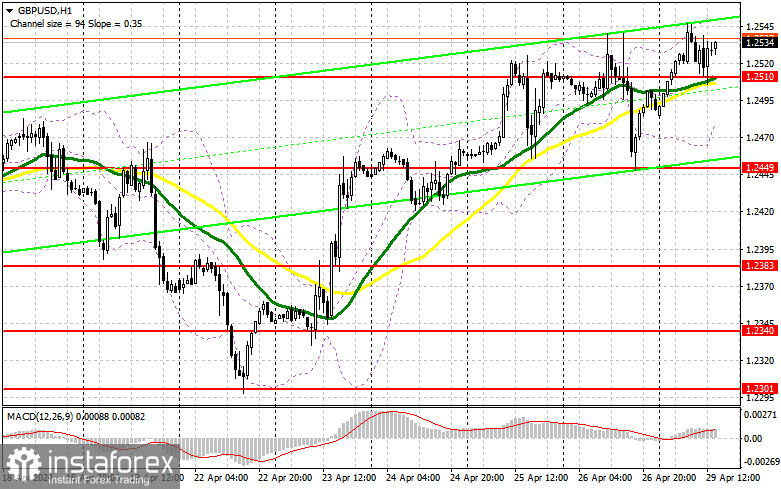
Image

To open long positions on GBP/USD, you need: The lack of statistics for the UK helped the buyers of the pound to beat off 1.2510 and now let's see if they will be able to achieve an update to the weekly maximum or not. The reason for the low volatility in the afternoon will be the complete absence of any data on the United States and the impending meeting of the Federal Reserve System, which will be able to change the current "rules of the game". For this reason, it is not necessary to force events: the formation of a false breakdown in the support area of 1.2510, by analogy with the first half of the day, will give an entry point to buy in order to grow to the resistance of 1.2573. The moving averages also pass around 1.2510, so you can again count on the active actions of the bulls. A breakout and a top-down test of 1.2573 will give a chance for GBP/USD growth, which will allow you to reach 1.2621. In the case of an exit above this range, we can talk about a breakthrough to 1.2658, where I'm going to fix profits. A test of this level is unlikely today, but anything is possible in the market. In the scenario of a fall in GBP/USD and the absence of buyers at 1.2510 in the afternoon, the market will maintain balance, and trading will move within the framework of the side channel. In this case, I will look for purchases in the area of 1.2449. The formation of a false breakdown there will be a suitable option for entering the market. It is possible to open long positions on GBP/USD immediately on a rebound from 1.2383 in order to correct 30-35 points within a day. To open short positions on GBP/USD, you need: The bears still have a chance to continue to return to the pair's decline, but for this they need to take 1.2510, which they failed to do in the first half of the day. In case of further growth of the pair, I will postpone sales until the test of the new resistance of 1.2573, which buyers have been looking at with great interest for a long time. Only the formation of a false breakdown there will make sure that large sellers are present in the market, which will lead to a fall in GBP/USD to the area of 1.2510, where the moving averages are located. A breakout and a reverse test from the bottom up of this range will increase the pressure on the pair, giving the bears an advantage and another entry point to sell with the aim of updating 1.2449. The ultimate target will be the minimum of 1.2383, where I will take a profit. In the scenario of GBP/USD rising and the absence of bears at 1.2573 in the second half of the day, bulls will have the opportunity to continue building an upward trend with movement towards the resistance at 1.2621. I will only enter there on a false breakout. If there is no activity there either, I suggest opening short positions on GBP/USD from 1.2658, expecting a pair to rebound down by 30-35 points within the day.

Analysis are provided by InstaForex.

Read more: https://ifxpr.com/4bgdWxI
IFX Bella
 
Posts: 101
Joined: Sat Dec 08, 2012 12:39 am

Re: Instaforex Analysis

Postby IFX Bella » Thu May 02, 2024 6:44 am

Forex Analysis & Reviews: USD/JPY: trading tips for beginners for European session on May 2

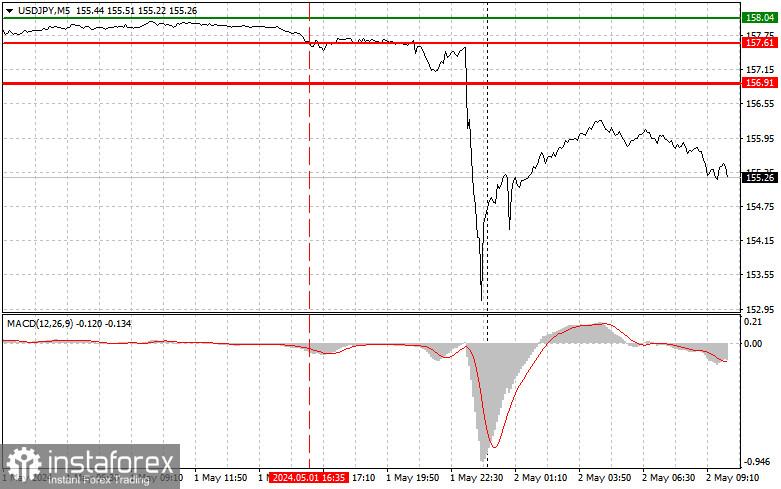
Image

Overview of trading and tips on USD/JPY The price test of 157.61 at the beginning of the US session occurred at a time when the MACD indicator sharply fell from the zero mark, which limited the pair's downward potential. For this reason, I did not sell. The outcome of the Federal Reserve meeting, as you can see on the chart, was a big surprise for the dollar bulls, who were counting on a firm hawkish stance, which could have further weakened the Japanese yen due to the interest rate differential. However, it didn't happen, which resulted in heavy profit taking and a major USD/JPY sell-off. The bulls will probably continue to buy back yesterday's movement, but they will be cautious about it, as no one is safe from the next Bank of Japan currency intervention. As for the intraday strategy, I will rely more on the implementation of scenarios No. 1 and No. 2.

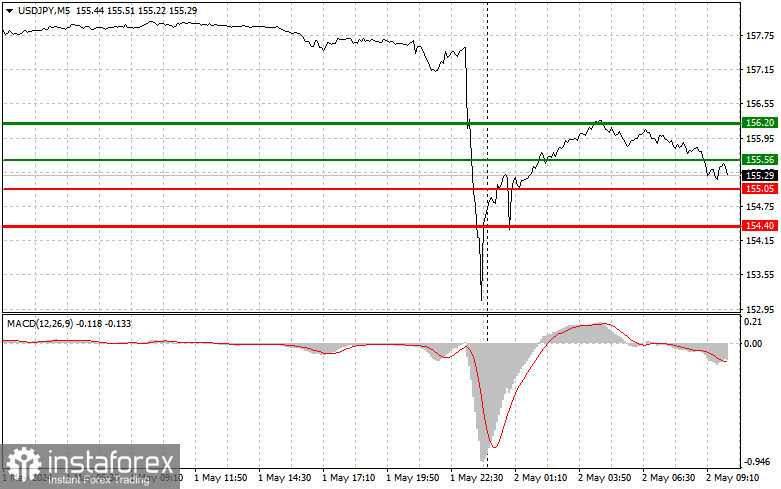
Image

Buy signals Scenario No. 1. I plan to buy USD/JPY today when the price reaches the entry point around 155.56 plotted by the green line on the chart, aiming for growth to 156.20 plotted by the thicker green line on the chart. In the area of 156.20, I'm going to exit long positions and open short ones in the opposite direction, expecting a movement of 30-35 pips in the opposite direction from that level. You can count on USD/JPY's growth today in continuation of the upward trend. Before buying, make sure that the MACD indicator is above the zero mark and is just starting to rise from it. Scenario No. 2. I also plan to buy USD/JPY today in case of two consecutive tests of 155.05 at the time when the MACD indicator is in the oversold area. This will limit the downward potential of the pair and lead to an upward reversal of the market. We can expect growth to the opposite levels of 155.56 and 156.20. Sell signals Scenario No. 1. I plan to sell USD/JPY today only after testing the level of 155.05 plotted by the red line on the chart, which will lead to a rapid decline in the price. The key target for sellers will be 154.40, where I am going to exit short positions and also immediately open long ones in the opposite direction, expecting a movement of 20-25 pips in the opposite direction from that level. Pressure on USD/JPY may return in case of another central bank intervention. Before selling, make sure that the MACD indicator is below the zero mark and is just starting to decline from it. Scenario No. 2. I also plan to sell USD/JPY today in case of two consecutive tests of the price of 155.56 at the time when the MACD indicator is in the overbought area. This will limit the pair's upward potential and lead to a downwards market reversal. We can expect a decline to the opposite levels of 155.05 and 154.40.

Analysis are provided by InstaForex.


Read more: https://ifxpr.com/44oeuiV
IFX Bella
 
Posts: 101
Joined: Sat Dec 08, 2012 12:39 am

Previous

Return to Forex Brokers