Instaforex Analysis

Forex broker related topics and discussions

Re: Instaforex Analysis

Postby IFX Gertrude » Wed Feb 28, 2024 1:10 am

FOREX ANALYSIS & REVIEWS: FORECAST FOR EUR/USD ON FEBRUARY 28, 2024

EUR/USD
Euro's situation did not change even though the indicators on the daily chart maintained their positions. The price continues to test its strength in both upward and downward movements, leaning towards the downside. This indicates a potential breach of the support level at 1.0825, where a consolidation below the level will likely bring the pair to the target level of 1.0724.

Image

Weak data on durable goods orders and consumer confidence in the US came out, but dollar did not decline. Further movement will depend on the upcoming GDP data for the 4th quarter, which forecasts say will remain unchanged at 3.3%.

Image

On the four-hour chart, the price appears to be heading towards the balance line. It will test the support level of 1.0825 along with the movement. The MACD line (1.0814) lies slightly below the level.

Without external assistance, such as a decline in stock indices, euro will find it difficult to cross the support levels in a single day. Currently, it has only one ally - the Marlin oscillator, which already arrived at the area of a downward trend.

Analysis are provided by InstaForex.

Read More https://ifxpr.com/3wzPb0J
Best regards, PR Manager

Learn more about InstaForex Company at http://instaforex.com
IFX Gertrude
 
Posts: 5198
Joined: Wed Nov 07, 2012 6:25 am

Re: Instaforex Analysis

Postby IFX Gertrude » Thu Feb 29, 2024 4:29 am

FOREX ANALYSIS & REVIEWS: FORECAST FOR EUR/USD ON FEBRUARY 29, 2024

EUR/USD
On Wednesday, the euro made a strong attempt to break below the support level of 1.0825, but, as we anticipated in yesterday's overview, it did not succeed in just a day. Nevertheless, it made an attempt, and speculative interest is clear. We expect another attack on the aforementioned support level. Traders could receive external help – yesterday, the S&P 500 decreased by 0.17%, and in today's Asia Pacific session, the S&P/ASX200 is losing 0.16%.

Image

On Wednesday, U.S. lawmakers, for the fourth time, agreed to extend funding for some government agencies for a week, through March 8, and the rest for another two weeks, until March 22. Obviously, they will be able to approve the final allocation of $1.7 trillion even if they fail to do so in March.

We're waiting for the price to settle below the level of 1.0825 to confirm the market's choice in pushing the pair towards 1.0724. An alternative scenario, suggesting growth above 1.0905, will begin to develop after the price overcomes the resistance of the MACD line (1.0874).

Image

On the 4-hour chart, yesterday, the price failed to settle below the MACD line, rising back above the red balance line. The Marlin oscillator is in its lower half, indicating a predominantly downward trend. In order to support the decline, the price needs to settle below the 1.0817 mark.

Analysis are provided by InstaForex.

Read More https://ifxpr.com/3SXb7u3
Best regards, PR Manager

Learn more about InstaForex Company at http://instaforex.com
IFX Gertrude
 
Posts: 5198
Joined: Wed Nov 07, 2012 6:25 am

Re: Instaforex Analysis

Postby IFX Bella » Mon Mar 04, 2024 5:38 am

Forex Analysis & Reviews: Indicator Analysis of GBP/USD on March 4, 2024


The GBP/USD currency pair may move upward from the level of 1.2649 (closing of Friday's daily candle) to 1.2680, the 14.6% pullback level (yellow dotted line). Then, from the said level, a continued upward movement is possible to the upper fractal at 1.2708 (yellow dotted line).

Image

Comprehensive analysis: Indicator analysis – up; Fibonacci levels – up; Volumes – up; Candlestick analysis – up; Trend analysis – up; Bollinger bands – up; Weekly chart – up. General conclusion: Today, the price may move upward from the level of 1.2649 (closing of Friday's daily candle) to 1.2680, the 14.6% pullback level (yellow dotted line). Then, from the said level, a continued upward movement is possible to the upper fractal at 1.2708 (yellow dotted line). Alternatively, from the level of 1.2649 (closing of Friday's daily candle), the price may move upward to 1.2680, the 14.6% pullback level (yellow dotted line). Then, a downward movement may occur with a target of 1.2663, the 23.6 % pullback level (yellow dotted line)


Analysis are provided byInstaForex.

[url="https://ifxpr.com/3V3hkY6"]Read More[/url]
IFX Bella
 
Posts: 97
Joined: Sat Dec 08, 2012 12:39 am

Re: Instaforex Analysis

Postby IFX Bella » Tue Mar 05, 2024 5:28 am

Forex Analysis & Reviews: Indicator Analysis of EUR/USD on March 5, 2024


Today, the price may move downward from the level of 1.0854 (closing of yesterday's daily candle) to test the historical support level at 1.0836 (blue dotted line). After that, an upward movement is possible to the 38.2% pullback level at 1.0864 (red dotted line), where the price may continue to rise. Alternatively, from the level of 1.0854 (closing of yesterday's daily candle), the price may move downward to test the 76.4% pullback level at 1.0842 (blue dotted line). After that, an upward movement is possible to the 38.2% pullback level at 1.0864 (red dotted line), where the price may continue to rise.

Image


Analysis are provided byInstaForex.

Read more: https://ifxpr.com/3uNdY0R
IFX Bella
 
Posts: 97
Joined: Sat Dec 08, 2012 12:39 am

Re: Instaforex Analysis

Postby IFX Bella » Wed Mar 06, 2024 4:19 am

Forex Analysis & Reviews: Indicator Analysis of EUR/USD on March 5, 2024

Image

Today, the price may move downward from the level of 1.0854 (closing of yesterday's daily candle) to test the historical support level at 1.0836 (blue dotted line). After that, an upward movement is possible to the 38.2% pullback level at 1.0864 (red dotted line), where the price may continue to rise. Alternatively, from the level of 1.0854 (closing of yesterday's daily candle), the price may move downward to test the 76.4% pullback level at 1.0842 (blue dotted line). After that, an upward movement is possible to the 38.2% pullback level at 1.0864 (red dotted line), where the price may continue to rise.


Analysis are provided byInstaForex.

Read More
IFX Bella
 
Posts: 97
Joined: Sat Dec 08, 2012 12:39 am

Re: Instaforex Analysis

Postby IFX Bella » Wed Mar 06, 2024 4:36 am

Forex Analysis & Reviews: Indicator Analysis of EUR/USD on March 6, 2024

Image

The EUR/USD currency pair may move downward from the level of 1.0855 (closing of yesterday's daily candle) to 1.0842, the 76.4% pullback level (blue dotted line). In the case of testing this level, an upward movement is possible to the upper fractal at 1.0888 (blue dotted line).

Analysis are provided byInstaForex.

[url="https://ifxpr.com/3v0n3TY]Read More[/url]
IFX Bella
 
Posts: 97
Joined: Sat Dec 08, 2012 12:39 am

Re: Instaforex Analysis

Postby IFX Bella » Thu Mar 07, 2024 5:26 am

Forex Analysis & Reviews: EUR/USD. Analysis for March 6th. The dollar is on the verge of a new decline

Image

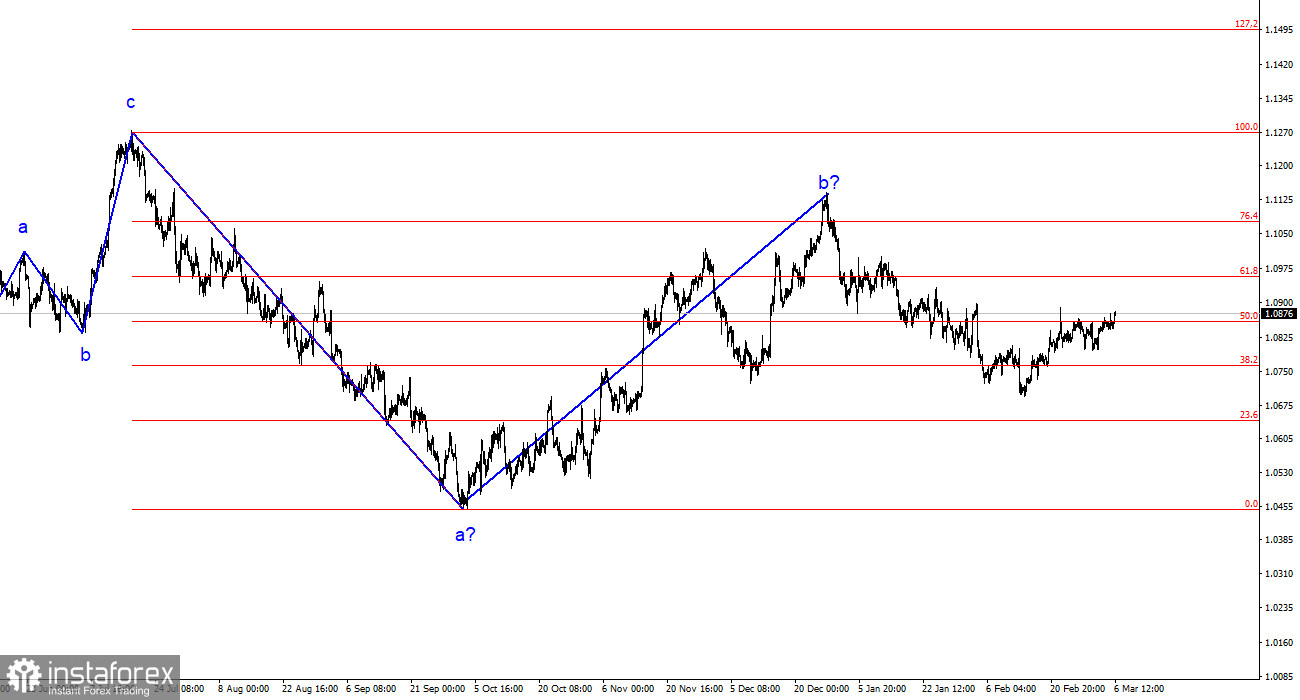
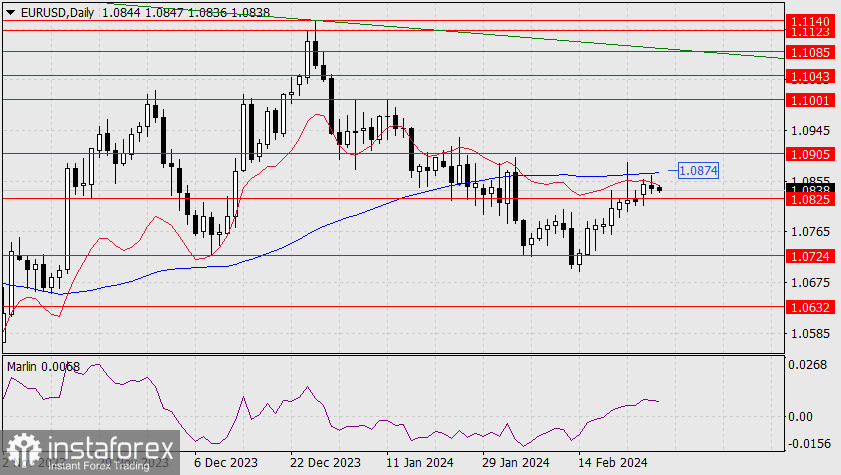
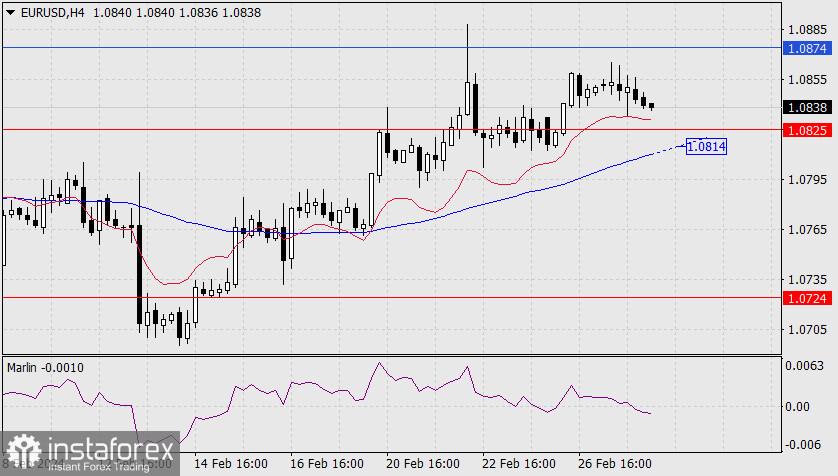
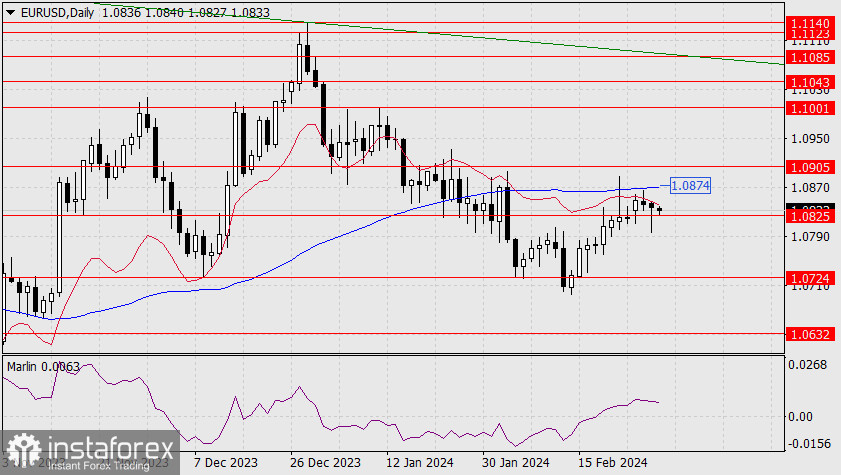
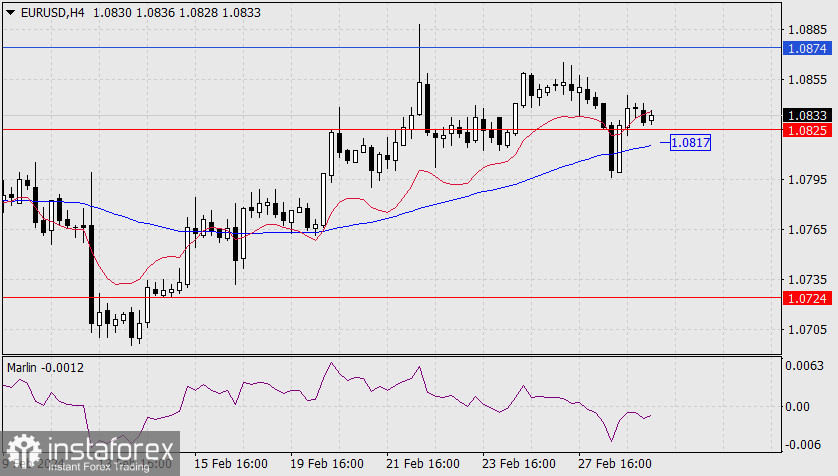
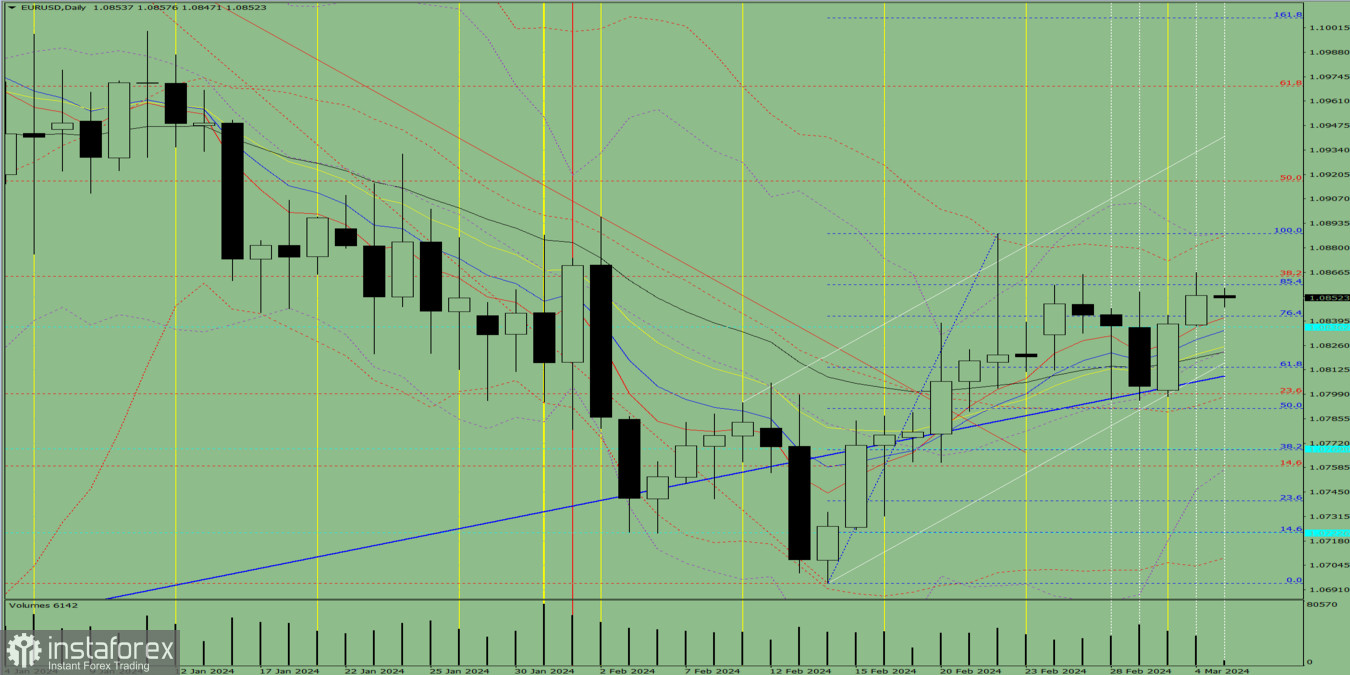
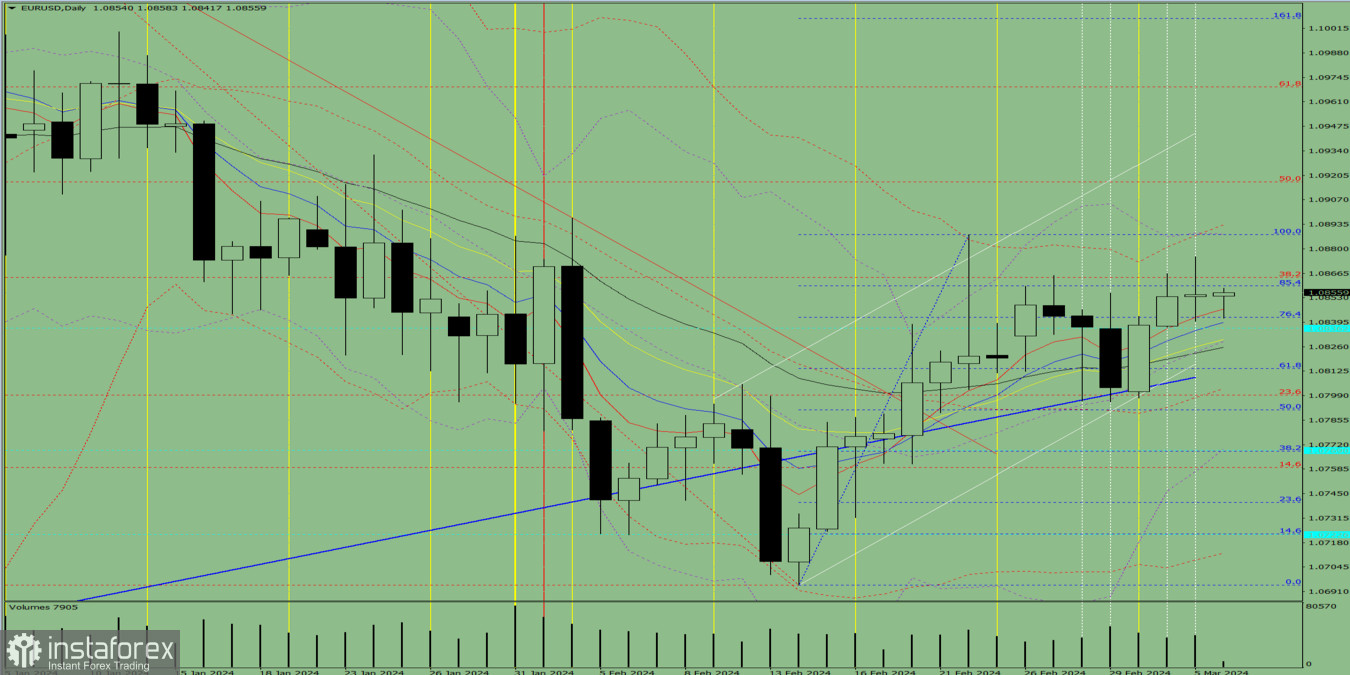
The wave analysis of the 4-hour chart for the EUR/USD pair remains unchanged. Over the past year, we have seen only three-wave structures of a larger scale that constantly alternate with each other. Currently, the construction of another three-wave structure is continuing - a downtrend that began on July 18 of last year. The presumed wave 1 is complete; wave 2 or b has become more complex three or four times but is now also complete as the decline of the pair has been ongoing for more than two months.

The upward trend section may still resume, but its internal structure will be absolutely unreadable in this case. I remind you that I try to highlight clear and unambiguous wave structures that do not tolerate dual interpretations. If the current wave analysis is correct, the market has moved on to form wave 3 or c. Currently, presumably, wave 2 in 3 or c is being built. If this is indeed the case, an unsuccessful attempt to break the 61.8% Fibonacci level may indicate the completion of this wave. At the same time, this wave can take on a distinctly three-wave form. In any case, this decline in the quotes of the pair should not be completed.

Alternatively, wave analysis may become significantly more complicated. The exchange rate of the EUR/USD pair rose by 15 basis points on Wednesday. Every day I say the same thing: market activity is currently so low that all price changes can be ignored. In addition to low market activity, the pair has been in a horizontal movement between Fibonacci levels 76.4% and 61.8% for over two weeks. Wave 2 in 3 or c may take on a three-wave form, implying a breakthrough of the 1.0881 mark. If this happens, the American currency may depreciate even more. However, there is no need to worry about this. Correctional waves often take on a three-wave form, so it can be said that everything is going according to plan.

Today, as well as Thursday and Friday, will be crucial for the American currency. In a couple of hours in America, reports on job vacancies and the number of new employees in the non-agricultural sector will be released, and Jerome Powell will speak in the US Congress. Tomorrow is another Powell speech, and the day after tomorrow is the nonfarm payrolls and unemployment reports. And this is not counting the ECB meetings and Christine Lagarde's speeches. Everything indicates that the last three working days of the week should be fiery.

For the current wave analysis to be preserved, at least not all of these events should increase demand for the euro. If at least half of the reports favor the dollar, and Lagarde and Powell do not change their previously voiced rhetoric, the dollar may depreciate within the wave plan. And then move on to building wave 3 in 3 or c. If this wave starts today or tomorrow, I'm fine with that too. I continue to consider only selling the pair.

Analysis are provided byInstaForex.

Read more: https://ifxpr.com/3TpIhE0
IFX Bella
 
Posts: 97
Joined: Sat Dec 08, 2012 12:39 am

Re: Instaforex Analysis

Postby IFX Bella » Fri Mar 08, 2024 8:25 am

Forex Analysis & Reviews: XAU/USD review and analysis: Gold looks poised for further gains


Image

For eight consecutive days, the price of gold has been gaining strong positive momentum. Expectations that the Federal Reserve will begin to lower interest rates in June are keeping bulls on the U.S. dollar on the defensive and are a key factor directing flows towards the non-yielding yellow metal. Additionally, ongoing geopolitical tensions and economic problems in China provide support to this safe-haven asset.

Meanwhile, Minneapolis Fed President Neel Kashkari played down rumors of a more aggressive policy easing. This, in turn, prompted a modest rebound in U.S. Treasury yields and helped limit the potential decline of the dollar. However, tense conditions on the daily chart are currently preventing traders from entering new bullish positions ahead of the NFP report, which will be released today during the American session. From a technical perspective, the recent breakthrough above the $2,100 mark is considered a key trigger for the bulls.

Nevertheless, the Relative Strength Index (RSI) on the daily chart already indicates overbought conditions. Therefore, before preparing for the continuation of the established short-term upward trend, it would be prudent to wait for some short-term consolidation or a moderate pullback. Nevertheless, gold seems poised for further growth towards the psychological $2,200 mark. On the flip side, corrective declines can be viewed as an opportunity to buy, with a limited figure of around $2,100. This mark is a turning point that, in the case of a decisive breakthrough, could push the price of gold back to the $2,065 level. Some subsequent sales may imply that the XAU/USD pair might shift the balance in favor of bears.

News are provided by
InstaForex
.


Read More ifxpr.com/43b1Z9N
IFX Bella
 
Posts: 97
Joined: Sat Dec 08, 2012 12:39 am

Re: Instaforex Analysis

Postby IFX Bella » Mon Mar 11, 2024 6:08 am

Indicator Analysis of GBP/USD on March 11, 2024


Image

Open trading account Open demo account Deposit money Money withdrawal Open trading account Open demo account Trend analysis (Fig. 1). The GBP/USD currency pair may move downward from the level of 1.2855 (closing of Friday's daily candlestick) to the 14.6% pullback level at 1.2837 (yellow dotted line). From there, an upward movement is possible to the upper fractal at 1.2892 (yellow dotted line). Fig. 1 (daily chart). Comprehensive analysis: Indicator analysis – down; Fibonacci levels – down; Volumes – down; Candlestick analysis – down; Trend analysis – up; Bollinger bands – up; Weekly chart – up. General conclusion: Today, the price may move downward from the level of 1.2855 (closing of Friday's daily candlestick) to the 14.6% pullback level at 1.2837 (yellow dotted line). From there, an upward movement is possible to the upper fractal at 1.2892 (yellow dotted line). Alternatively, from the level of 1.2855 (closing of Friday's daily candle), the price may move downward to the 23.6% pullback level at 1.2804 (yellow dotted line). From there, an upward movement is possible to the upper fractal at 1.2892 (yellow dotted line).

Analysis are provided byInstaForex.

Read more: https://ifxpr.com/3PevvFY
IFX Bella
 
Posts: 97
Joined: Sat Dec 08, 2012 12:39 am

Re: Instaforex Analysis

Postby IFX Bella » Tue Mar 12, 2024 8:20 am

Analysis of transactions and tips for trading GBP/USD


Image


The test of 1.2831 took place at a time when the MACD line moved downward from zero. This provoked a sell signal, which led to a price decrease of around 30 pips. The pair reached the target level of 1.2805.

Buying from this level for a rebound did not yield the expected results. Data on the UK's jobless claims, unemployment rate, and average earnings will come out today. The last indicator attracts the most attention, as a sharp decrease will weaken the position of pound, leading to a decline in the pair.

For long positions: Buy when pound hits 1.2829 (green line on the chart) and take profit at the price of 1.2857 (thicker green line on the chart). Growth will occur only after good and strong data on the UK labor market. When buying, ensure that the MACD line lies above zero or just starts to rise from it.

Pound can also be bought after two consecutive price tests of 1.2804, but the MACD line should be in the oversold area as only by that will the market reverse to 1.2829 and 1.2857. For short positions: Sell when pound reaches 1.2804 (red line on the chart) and take profit at the price of 1.2770. Pressure will return after an unsuccessful attempt to break through the local high. When selling, ensure that the MACD line lies below zero or drops down from it.

Pound can also be sold after two consecutive price tests of 1.2829, but the MACD line should be in the overbought area as only by that will the market reverse to 1.2804 and 1.2770. What's on the chart: Thin green line - entry price at which you can buy GBP/USD Thick green line - estimated price where you can set Take-Profit (TP) or manually fix profits, as further growth above this level is unlikely. Thin red line - entry price at which you can sell GBP/USD Thick red line - estimated price where you can set Take-Profit (TP) or manually fix profits, as further decline below this level is unlikely. MACD line- it is important to be guided by overbought and oversold areas when entering the market Important: Novice traders need to be very careful when making decisions about entering the market.

Before the release of important reports, it is best to stay out of the market to avoid being caught in sharp fluctuations in the rate. If you decide to trade during the release of news, then always place stop orders to minimize losses. Without placing stop orders, you can very quickly lose your entire deposit, especially if you do not use money management and trade large volumes. And remember that for successful trading, you need to have a clear trading plan. Spontaneous trading decisions based on the current market situation is an inherently losing strategy for an intraday trader.


Analysis are provided byInstaForex.

Read more: https://ifxpr.com/3TdWXVx
IFX Bella
 
Posts: 97
Joined: Sat Dec 08, 2012 12:39 am

PreviousNext

Return to Forex Brokers


cron