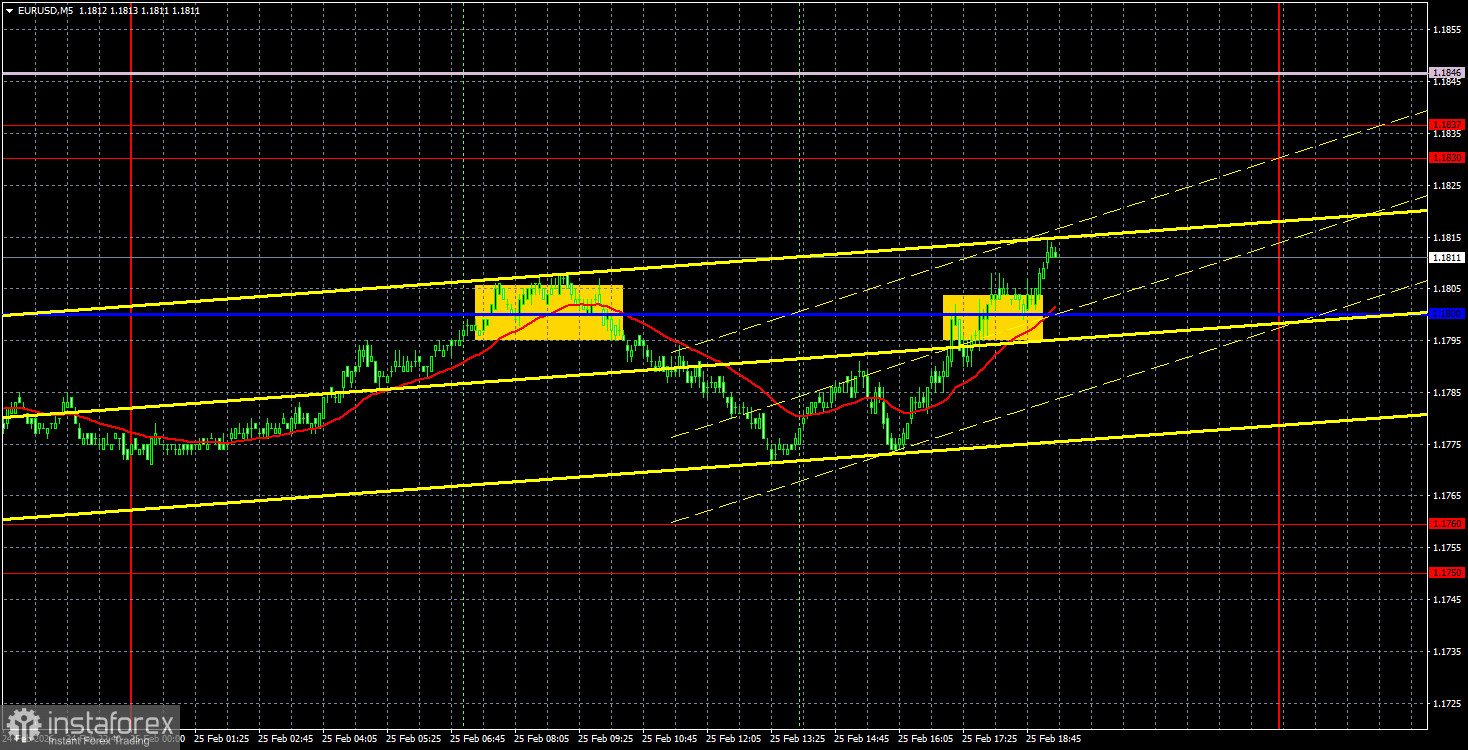
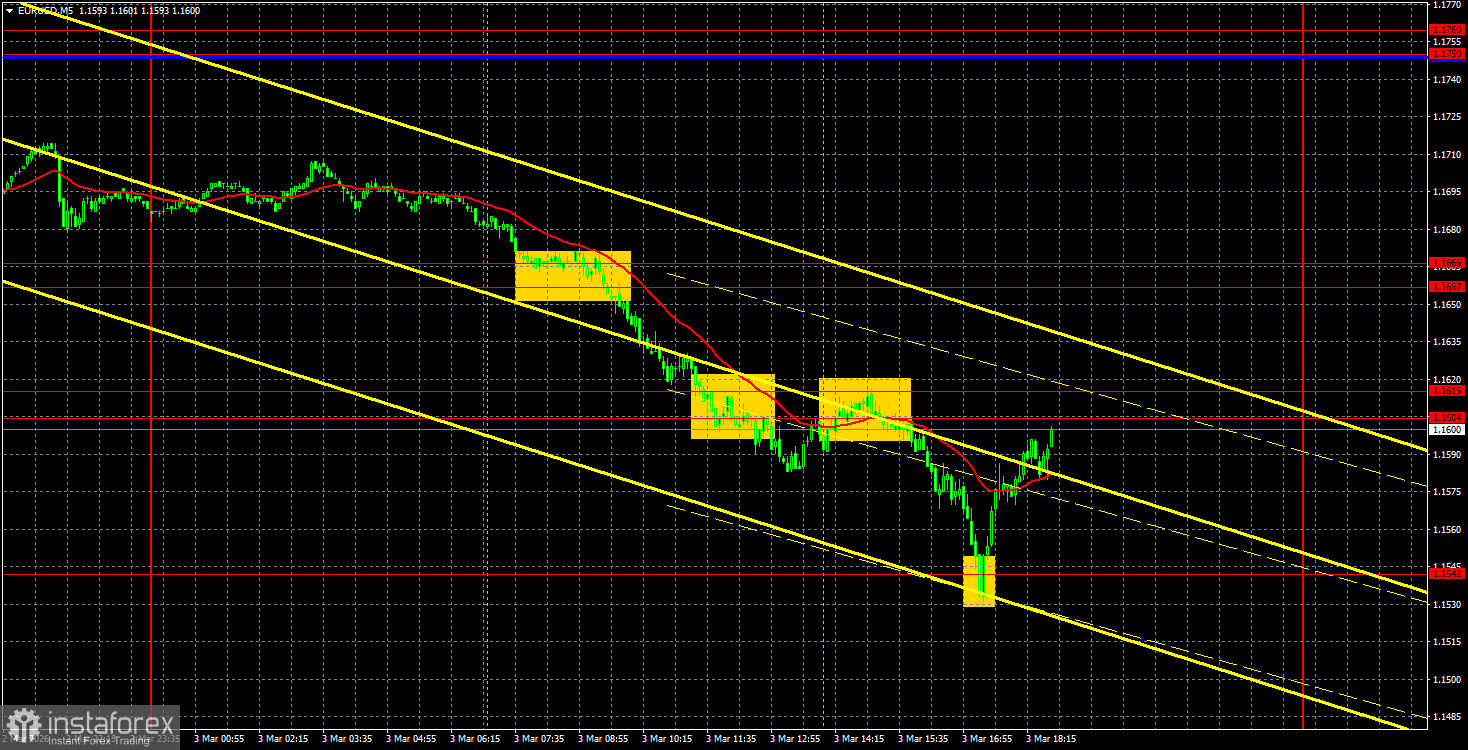
Analysis of EUR/USD 5M
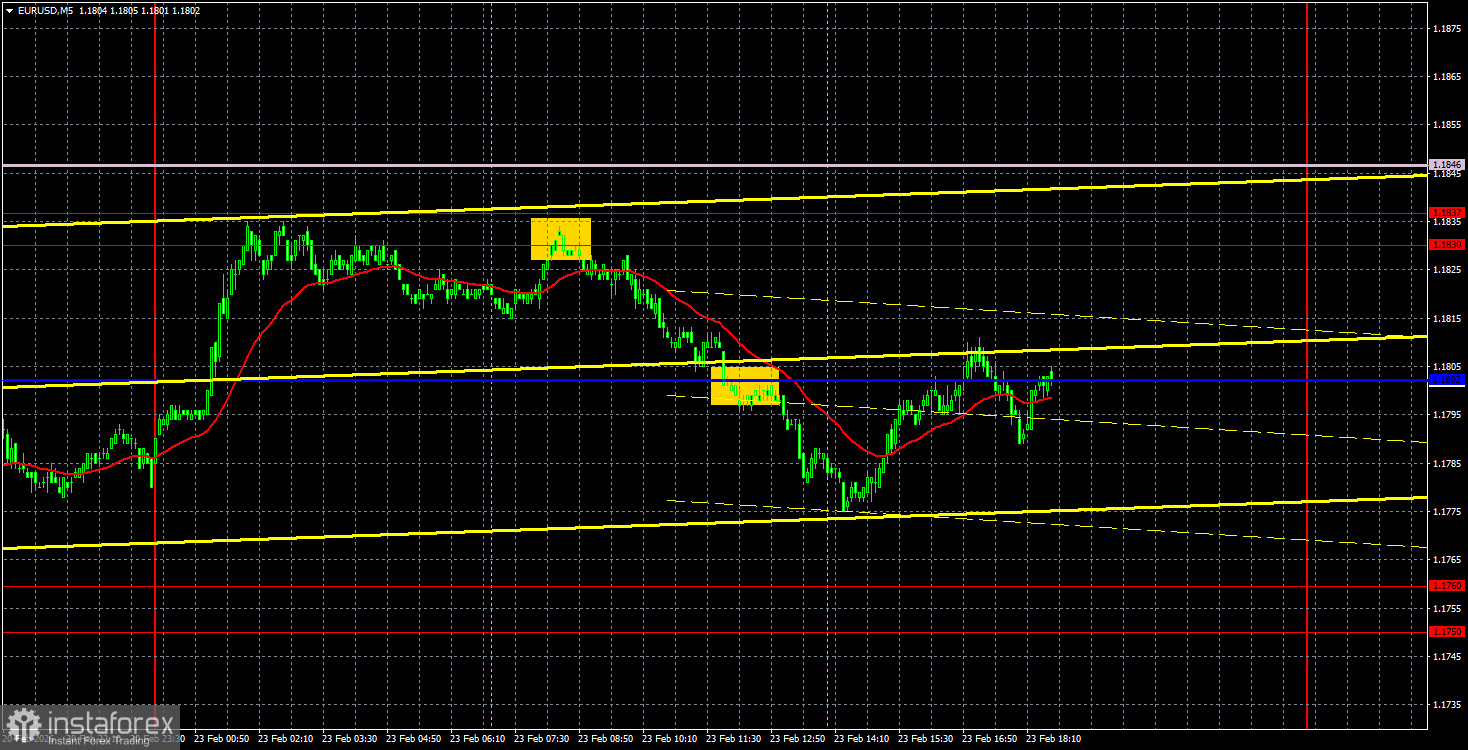
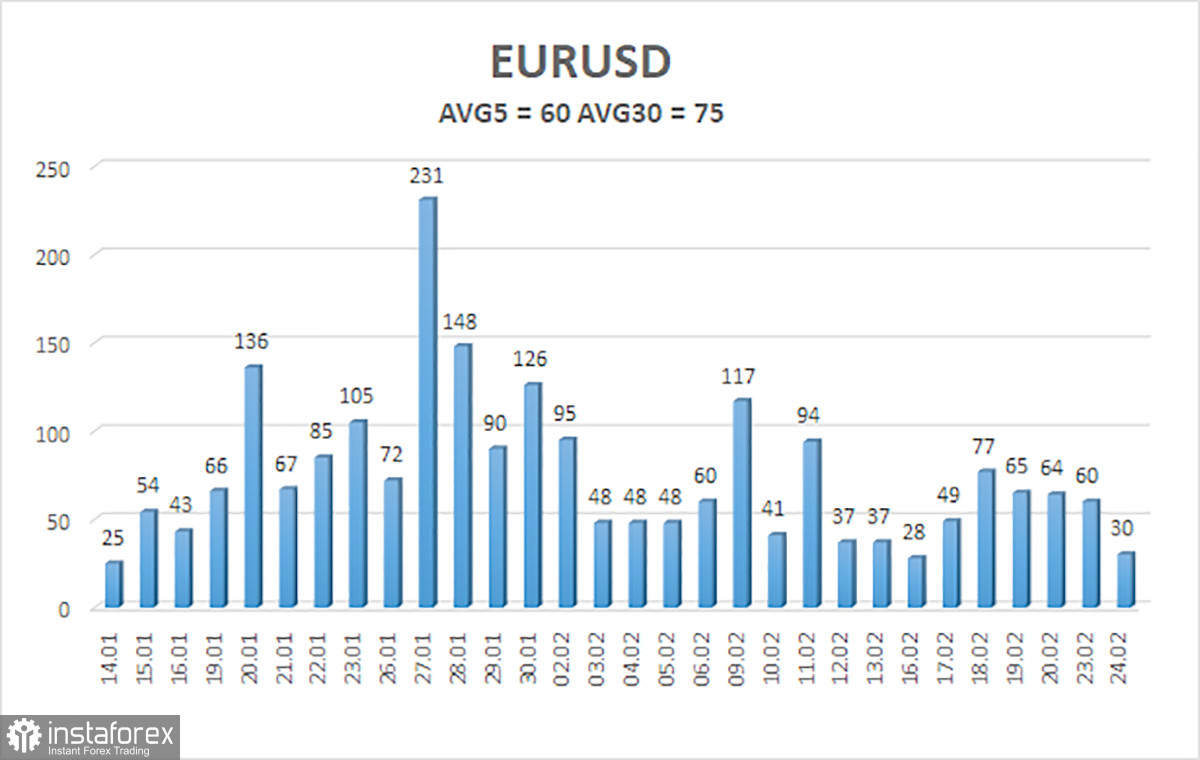
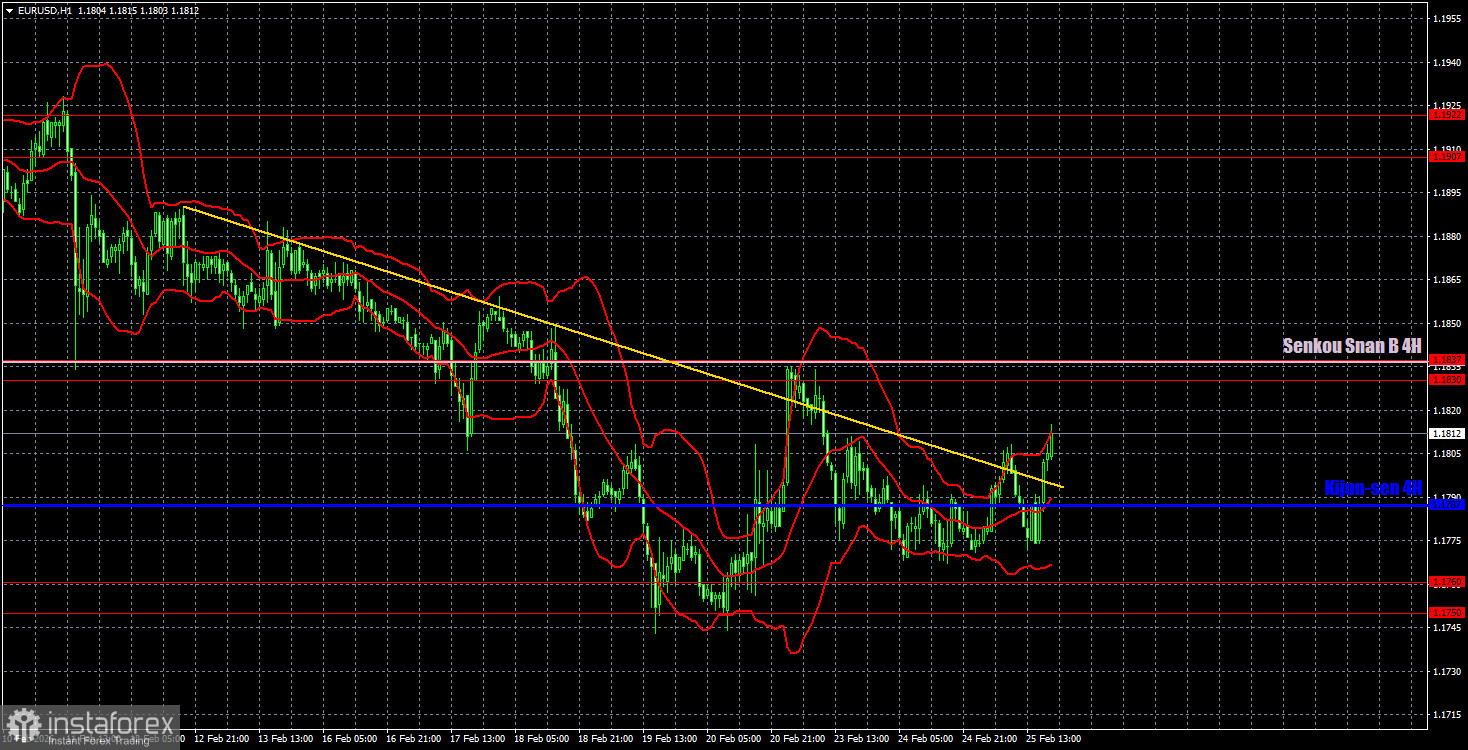
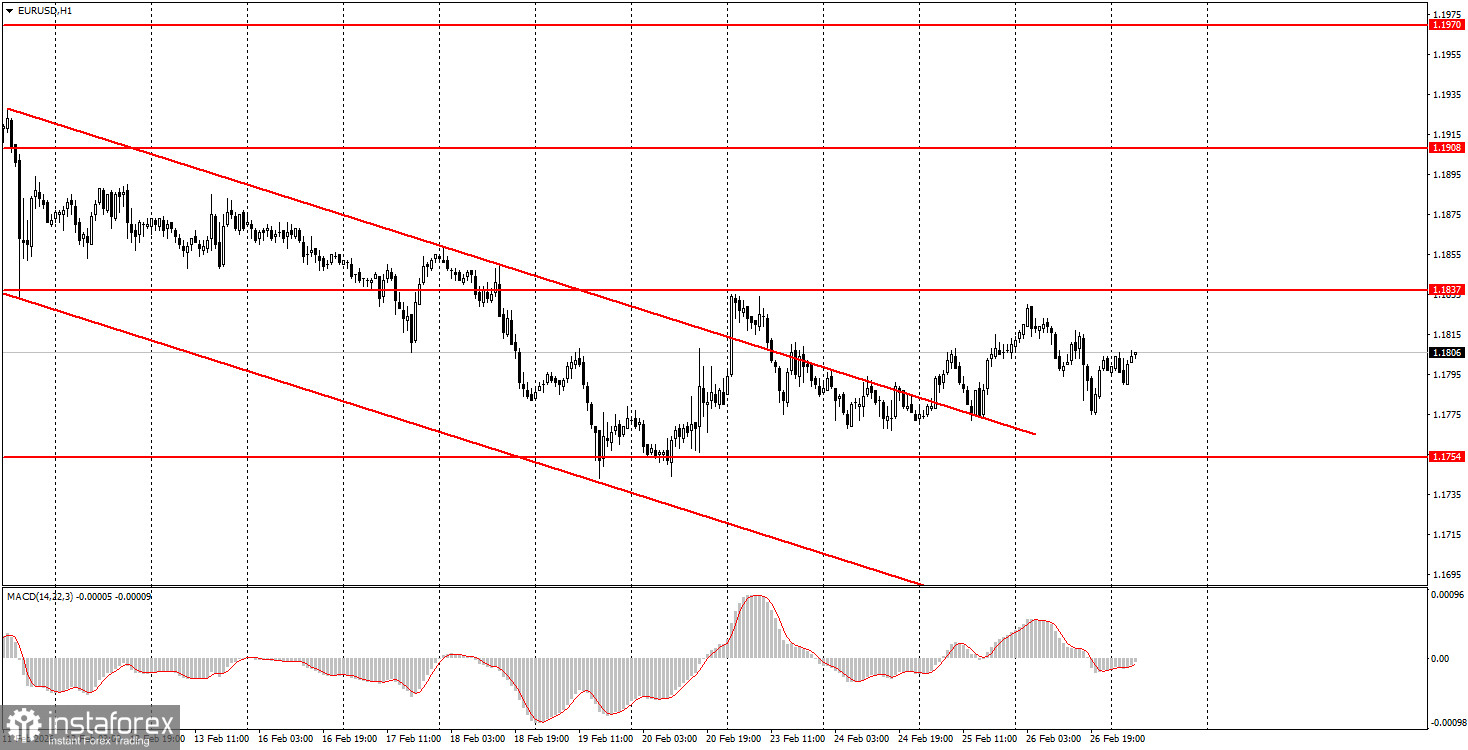
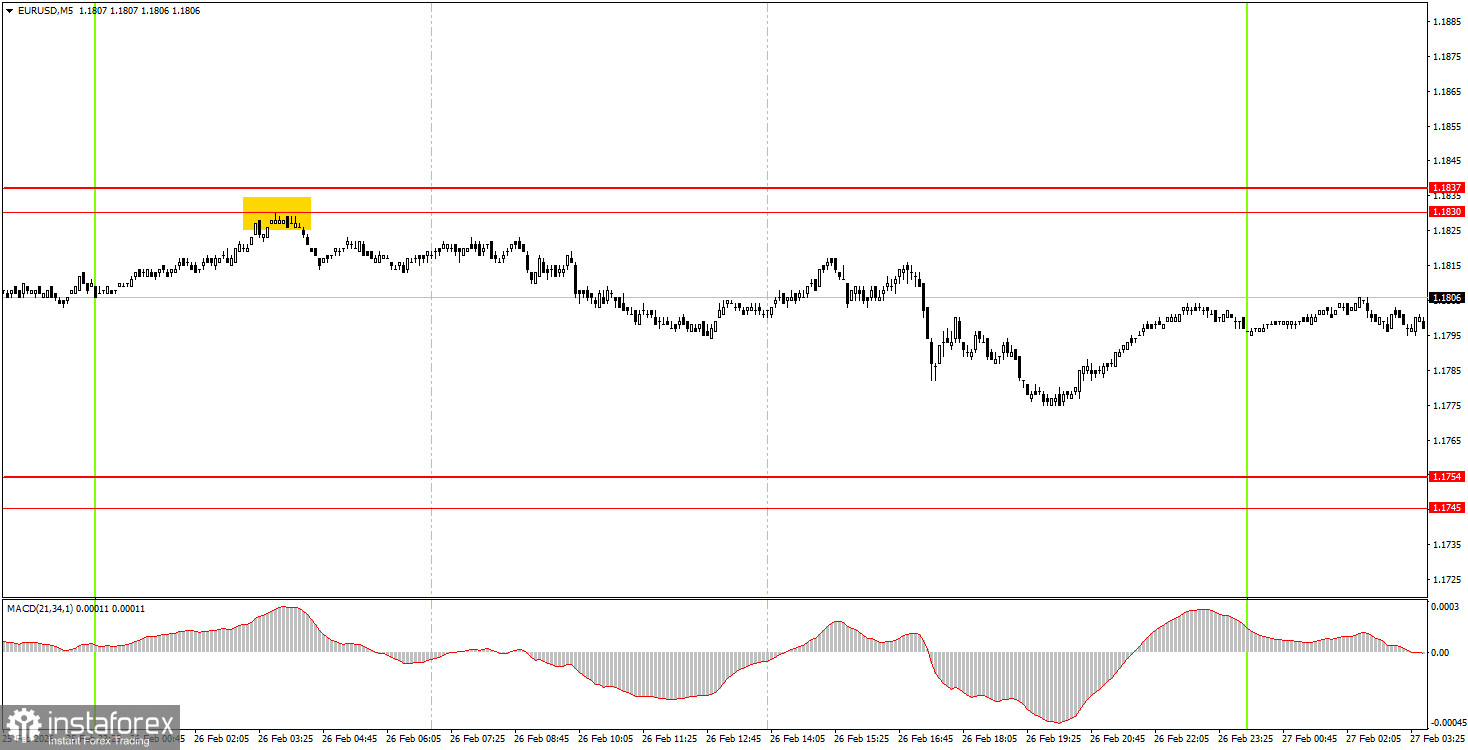
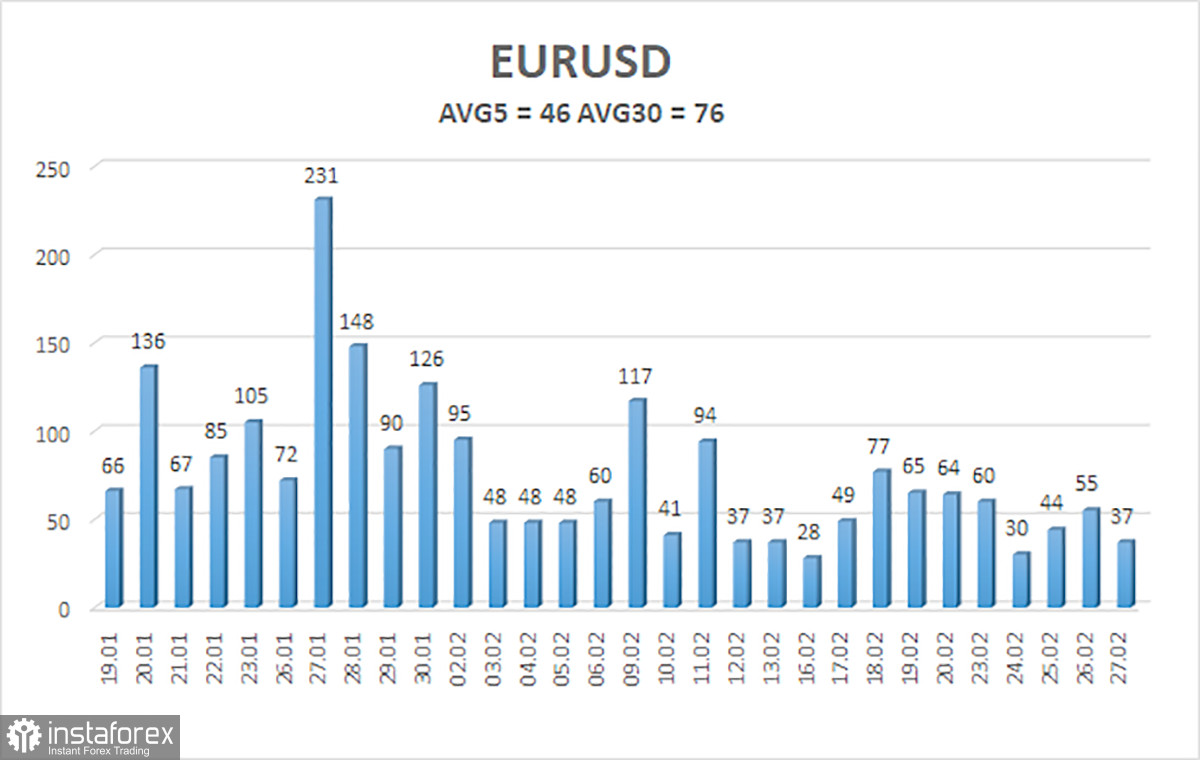
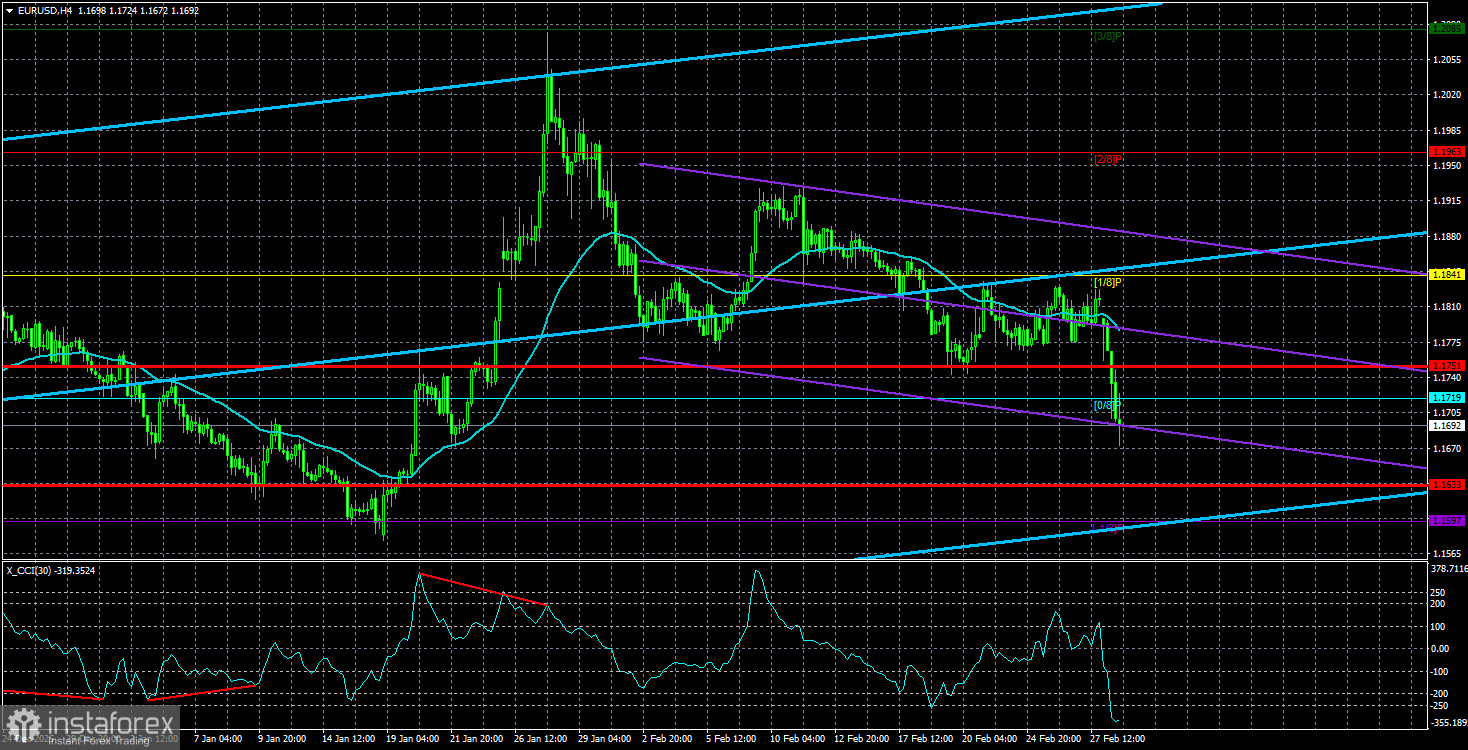
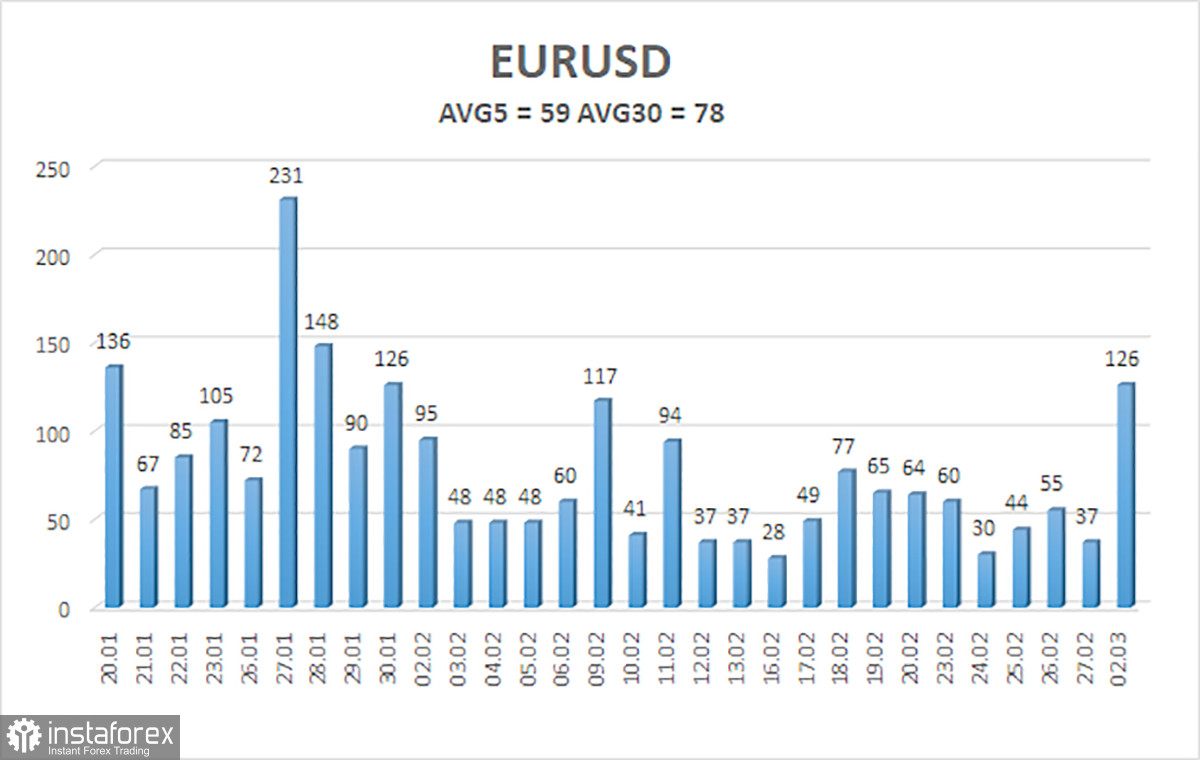
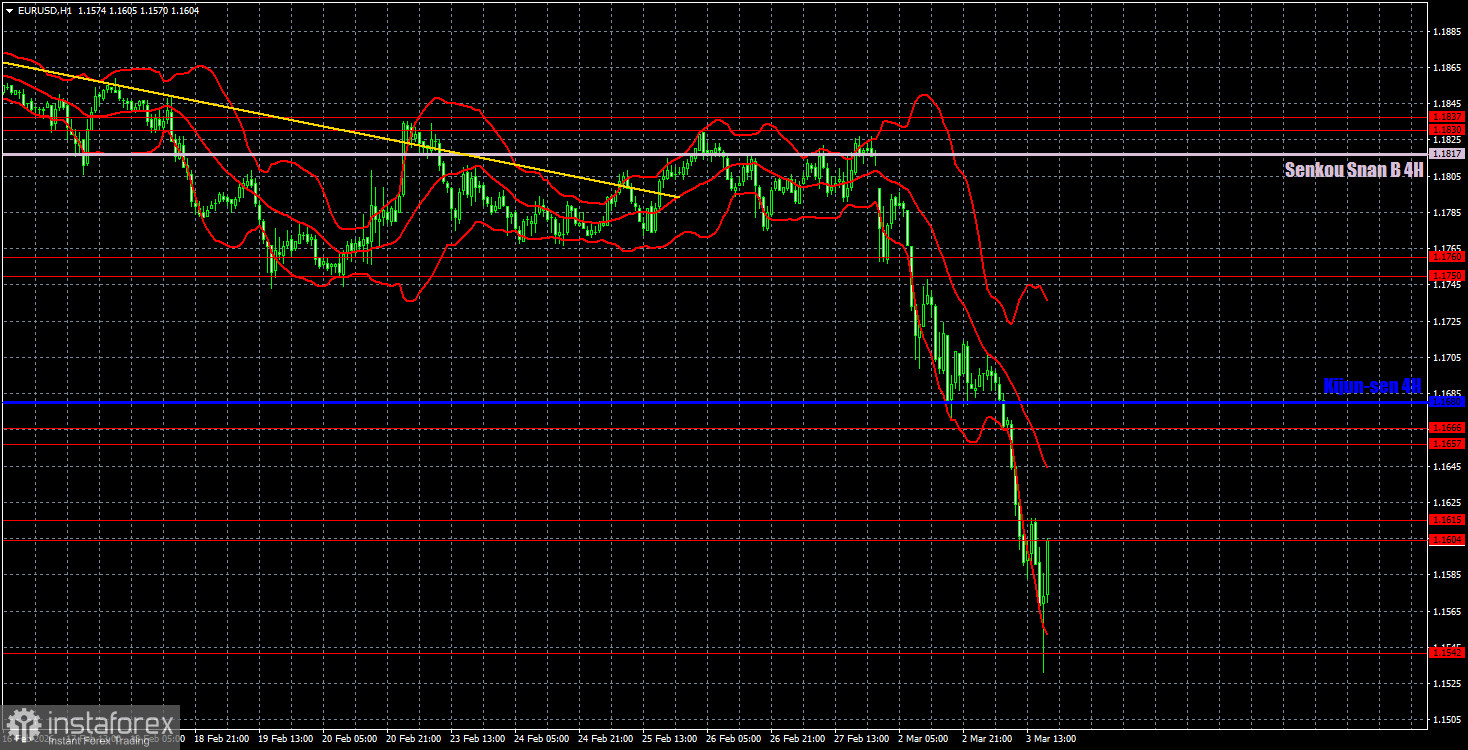
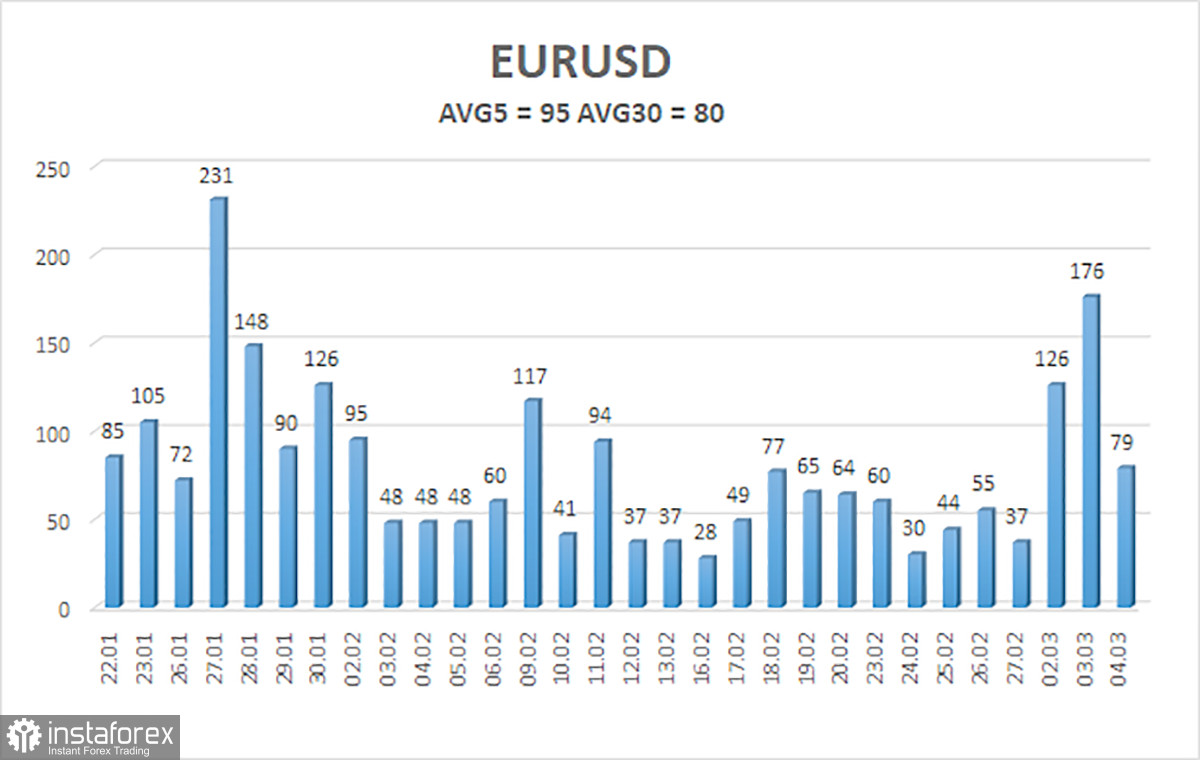
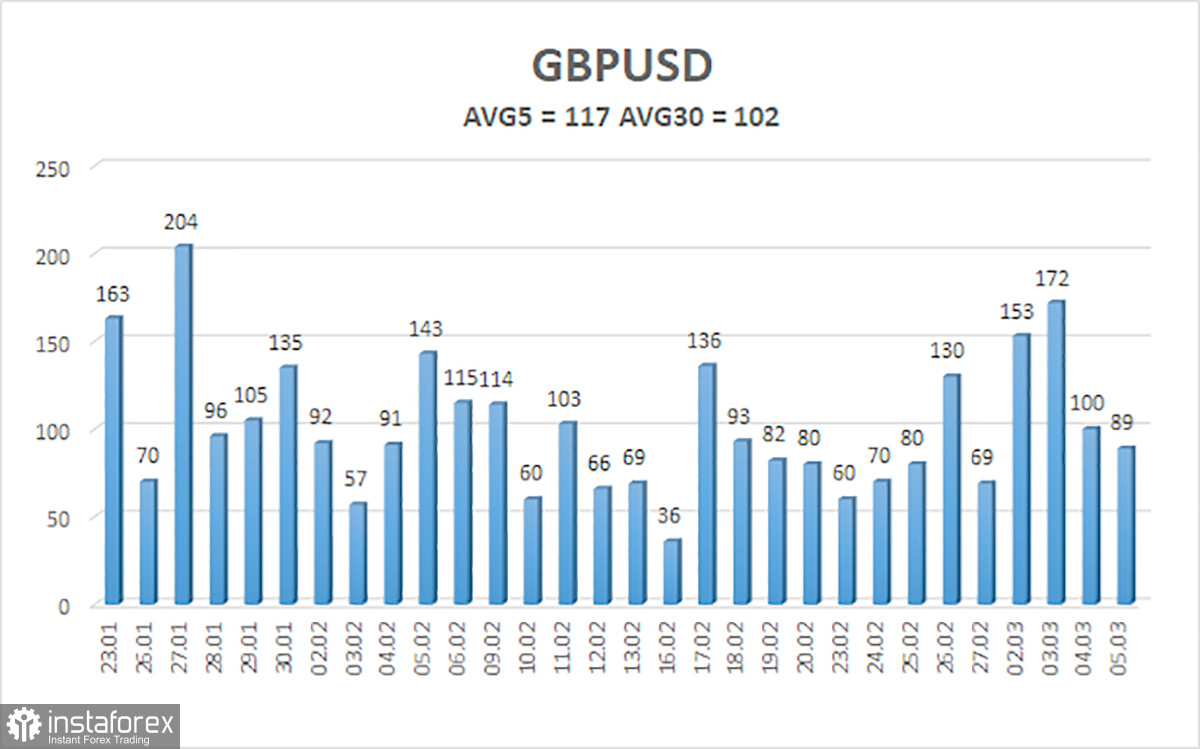
The EUR/USD currency pair traded quite actively on Monday, yet the overall volatility remained moderately low. Thus, we can immediately acknowledge the obvious: the market does not seem overly concerned about the continuation of the trade war or the new tariffs imposed by Donald Trump. The first trading day of the week started, as usual, with a decline in the dollar. However, throughout the day, the American currency fully recovered, so, in essence, the dollar did not experience any negative consequences. Once again, we find ourselves in a situation where a negative fundamental background has no impact on the dollar's exchange rate. Over the past two weeks, one could even get used to this. However, we have gotten accustomed to calling things by their names. Currently, market movements are illogical. The market continues to react extremely selectively to fundamentals and macroeconomics; therefore, it is now best to make trading decisions based on technical analysis. On the hourly timeframe, the pair broke through the trendline yesterday but failed to overcome the resistance area at 1.1830-1.1837. It also could not hold above the Senkou Span B line. Thus, the downward trend remains, despite the breach of the trend line. In this case, the pair may resume its decline, aiming for 1.1750-1.1760. On the 5-minute timeframe, two decent trading signals were generated on Monday. Initially, the price bounced off the 1.1830-1.1837 area, then breached the Kijun-sen line. However, the pair was unable to reach the target area of 1.1750-1.1760 and returned to the critical line by the end of the day. Therefore, traders could have achieved a profit of about 20 pips from the short position.
COT Report
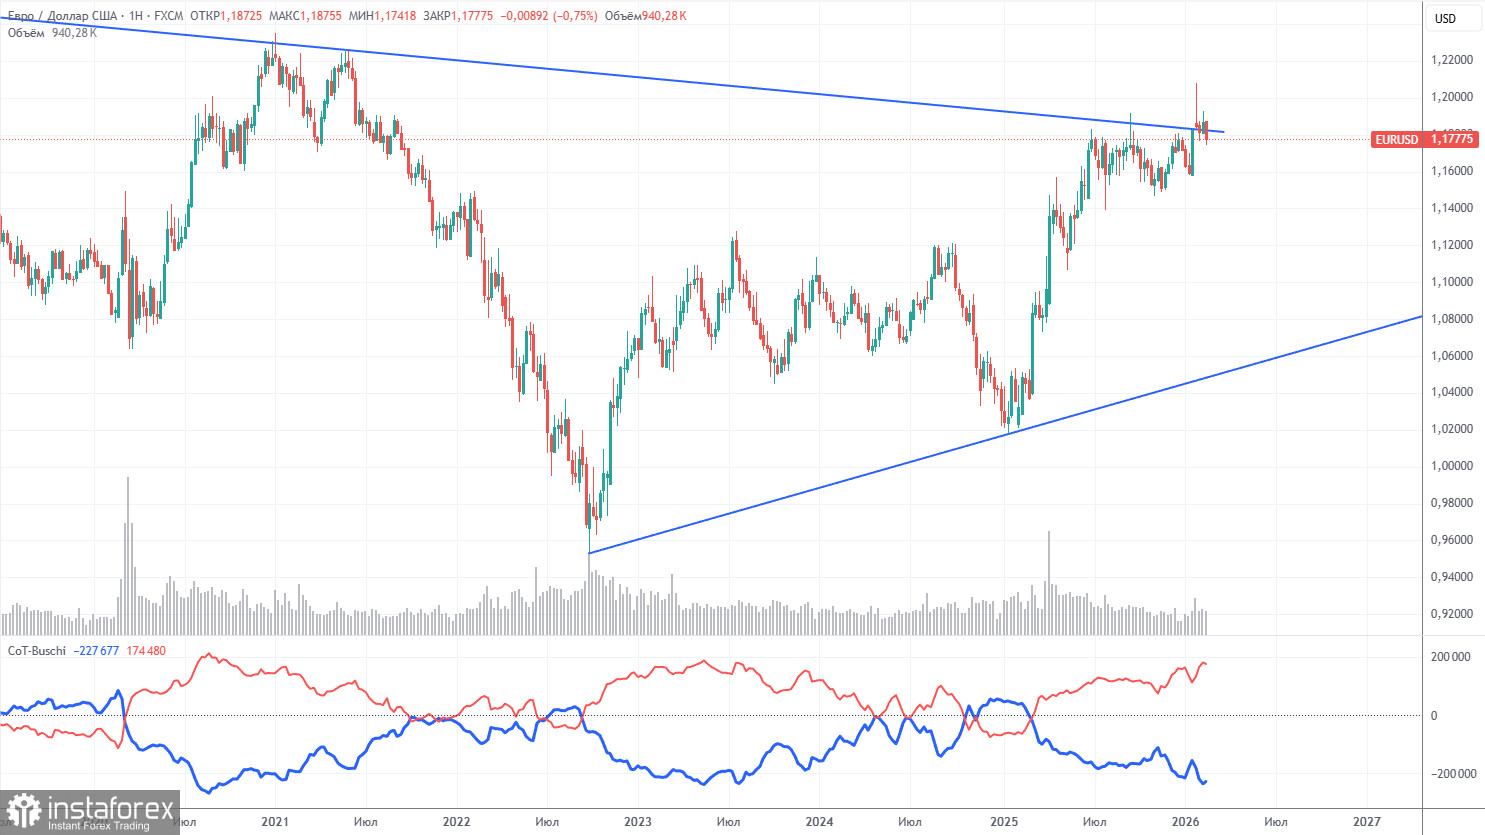
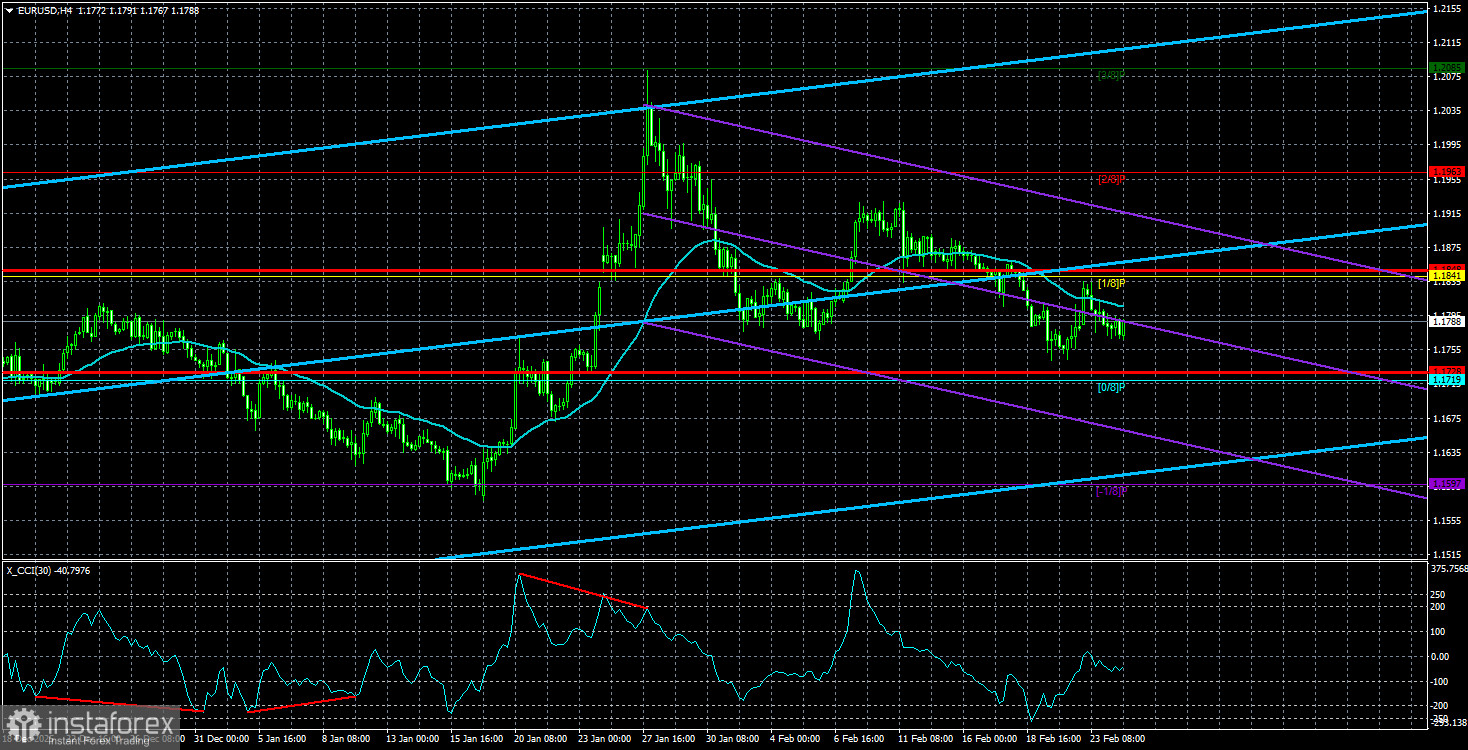
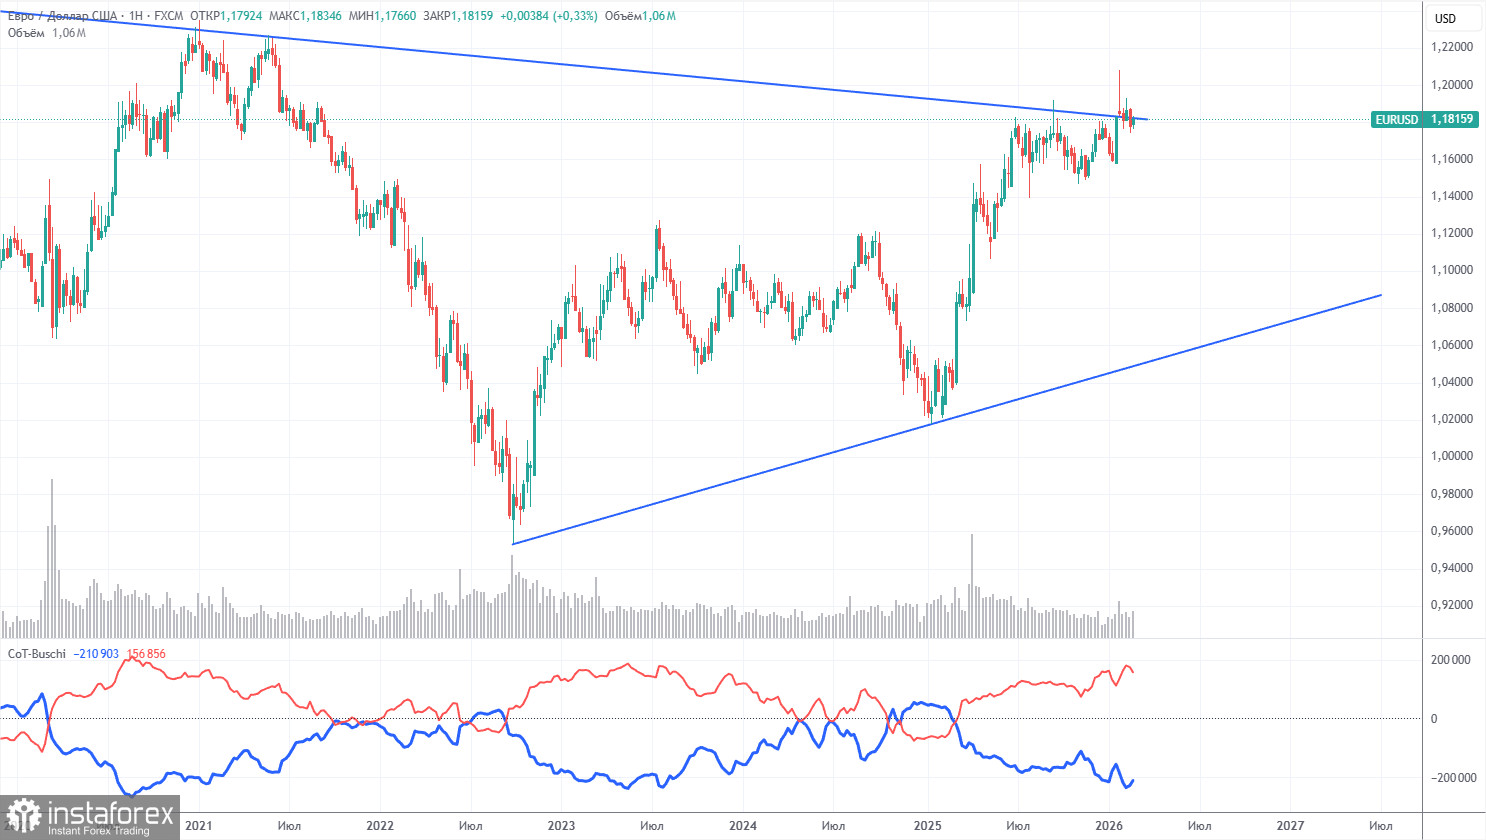
The latest COT report is dated February 17. As seen in the weekly timeframe illustration, the net position of non-commercial traders remains "bullish." Since Trump took office as President of the United States for the second time, the dollar has only been falling. We cannot say with 100% certainty that the decline of the American currency will continue, but the current developments in the world suggest this outcome. We still do not see any fundamental factors that would strengthen the euro; however, there are plenty of factors that would weaken the dollar. The global downward trend persists, but what does it matter where the price has moved over the last 18 years? In the last three years, a new upward trend has been forming, and the breach of the global descending trend line has occurred. Thus, the path further upward is open. The positioning of the red and blue lines of the indicator continues to indicate the preservation of a "bullish" trend. During the last reporting week, the number of longs for the "Non-commercial" group decreased by 7,100, and the number of shorts decreased by 1,300. Consequently, the net position decreased by 5,800 contracts over the week.
Analysis of EUR/USD 1H
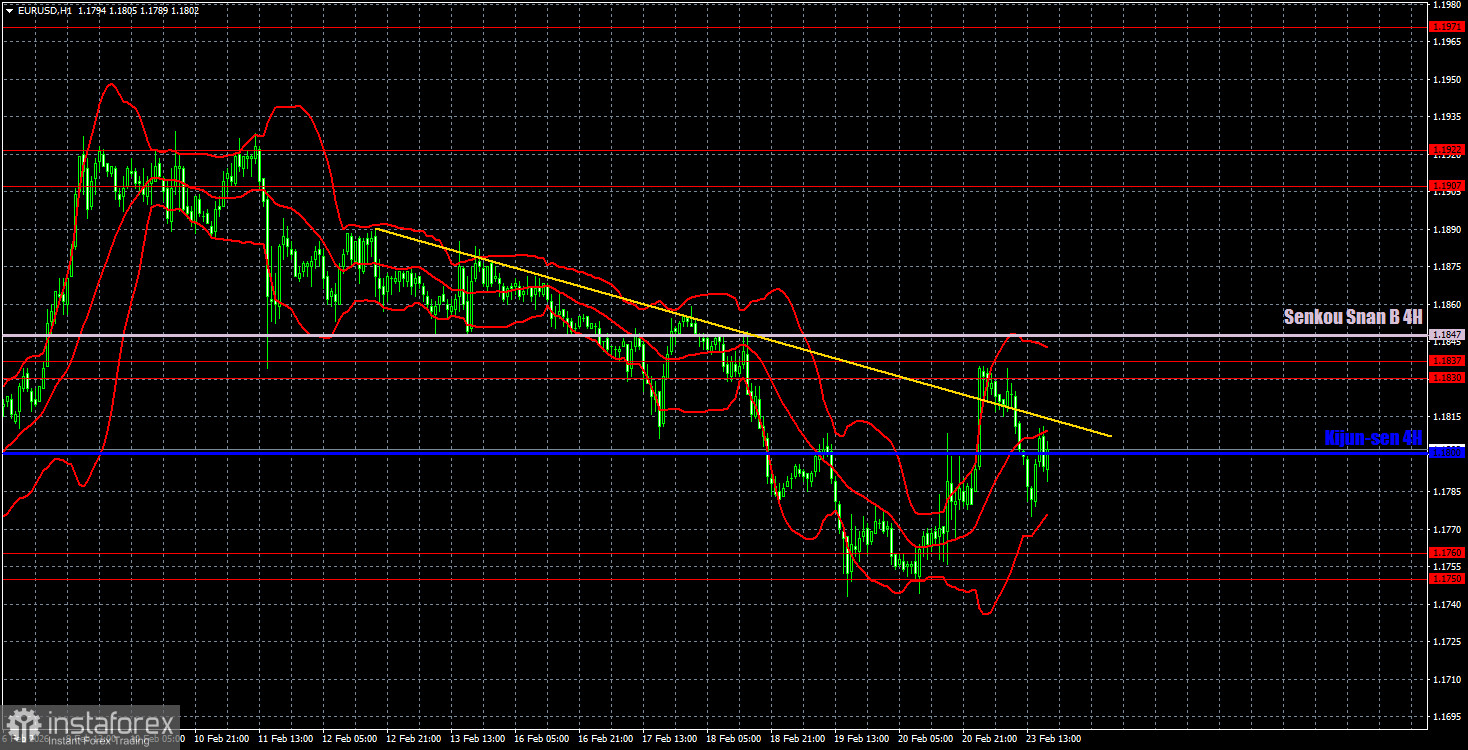
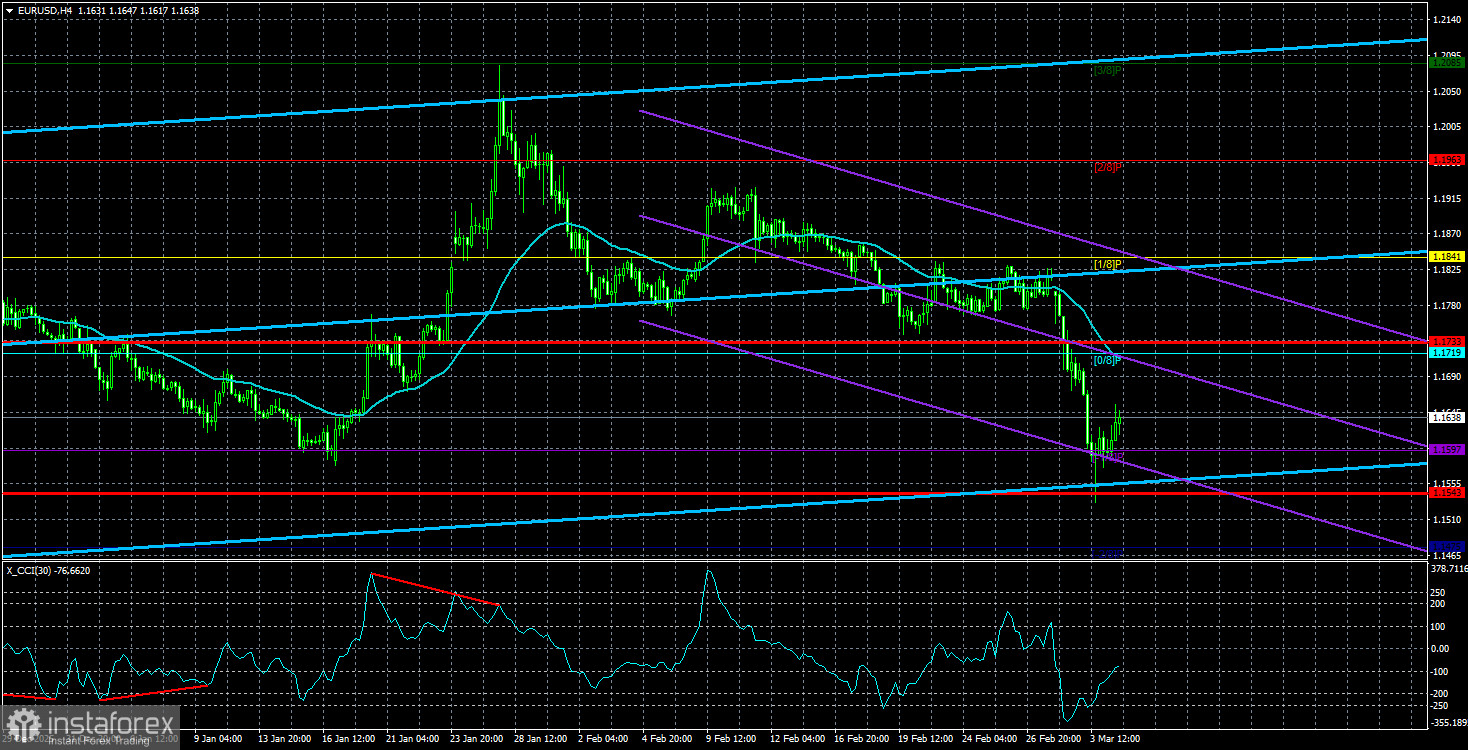
On the hourly timeframe, the EUR/USD pair remains below the Ichimoku indicator lines, hindering its ability to move upward. The pair exited the sideways channel of 1.1400-1.1830 at the beginning of the year, in which it had spent seven months, so the global upward trend has officially resumed. To technically restore the upward trend on the hourly timeframe, the price needs to consolidate above the Senkou Span B line and above the trend line. For February 24, we identify the following trading levels: 1.1362, 1.1426, 1.1542, 1.1604-1.1615, 1.1657-1.1666, 1.1750-1.1760, 1.1830-1.1837, 1.1907-1.1922, 1.1971-1.1988, 1.2051, 1.2095, as well as the Senkou Span B line (1.1847) and Kijun-sen (1.1800). The lines of the Ichimoku indicator can move during the day, which should be taken into account when determining trading signals. Do not forget to set a Stop Loss order to break even if the price moves in the correct direction by 15 pips. This will protect against potential losses if the signal turns out to be false. On Tuesday, the U.S. weekly ADP report on the labor market is scheduled for publication. We consider this report secondary and do not expect any market reaction. It is unlikely that the trend will change upward today. Trading Recommendations: On Tuesday, traders may consider selling with a target of 1.1750-1.1760 in case of another bounce from the 1.1830-1.1837 area. Long positions might be considered with a target of 1.1830-1.1837 if the price bounces from the 1.1750-1.1760 area.
Analysis are provided by InstaForex.
Read more: https://ifxpr.com/4aNEnMW