Instaforex Analysis

Forex broker related topics and discussions

Re: Instaforex Analysis

Postby IFX Bella » Tue Jan 27, 2026 4:11 am

Forex Analysis & Reviews: EUR/USD Overview. January 27. Trump Switches Attention to Canada

Image

The EUR/USD currency pair traded quietly, mostly sideways, on Monday. However, there is little doubt that this is just a pause before the next storm, and the new storm will likely not favor the US dollar. Just as sentiments regarding Greenland began to settle, Donald Trump initiated a new saga entitled "US vs. Canada." It seems that Trump has grievances against all nations on the planet; they are all living incorrectly and only exist due to America. This time, the controversial US president is unhappy with a possible trade deal between China and Canada. According to Trump, Canada wants to become a "buffer" between China and the US, accepting goods from China for further trafficking into America. Thus, we again see Trump trying to establish a world order that suits him. Furthermore, it's no longer just about relationships between America and other countries. Even Uganda might face US tariffs for trading with Zimbabwe. Everything will depend on Trump's opinion and mood. It seems that Trump wants every country to ask Washington for permission before taking any steps on the international stage. It sounds absurd, but, by his actions, this is precisely what the American president is striving for. Trump has stated that Canada exists only due to the US, while Canadian Prime Minister Mark Carney has called on the world to oppose autocracy. The Republican president took offense and did not invite Canada to the "Council of Peace," of which Trump must be the lifelong chair. If we weren't sure that this is reality, we might think it is some sort of fantastic novel. It should also be noted that Trump has encroached on Canadian sovereignty and independence since the day he became president of the United States for the second time. His initial attacks included offering Canada to become the 51st state of America. Now, Trump wants to impose 100% tariffs on goods from Canada if it reaches a free trade agreement with China. Overall, we are not surprised at all. Throughout the last year, we constantly stated that Trump considers China his main enemy. Therefore, grievances against China are continually raised. Other countries cannot trade with China. Additionally, Trump is attempting to claim what is easily accessible, such as Greenland or Venezuelan oil. The key is to arrange everything so that the world has no serious complaints against Washington. And Trump's plan is working, if not 100%, then at least 80%. Almost all countries, except for Canada, Russia, Iran, and China, prefer not to spoil relations with the controversial Republican, and as a consequence, yield to his threats to varying degrees. Understanding that his tactics are effective, Trump continues to make further demands for resources, money, and territories. This is an endless game.

Image

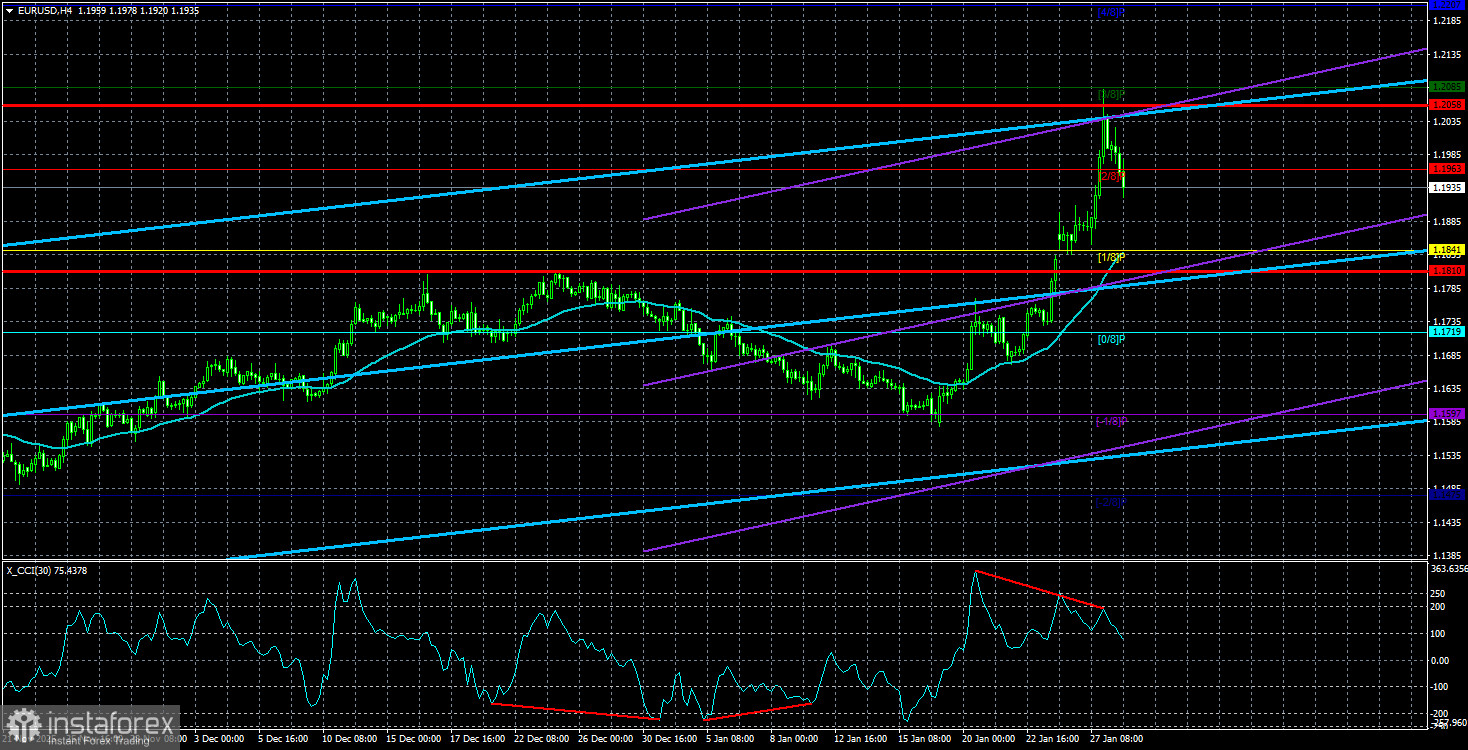
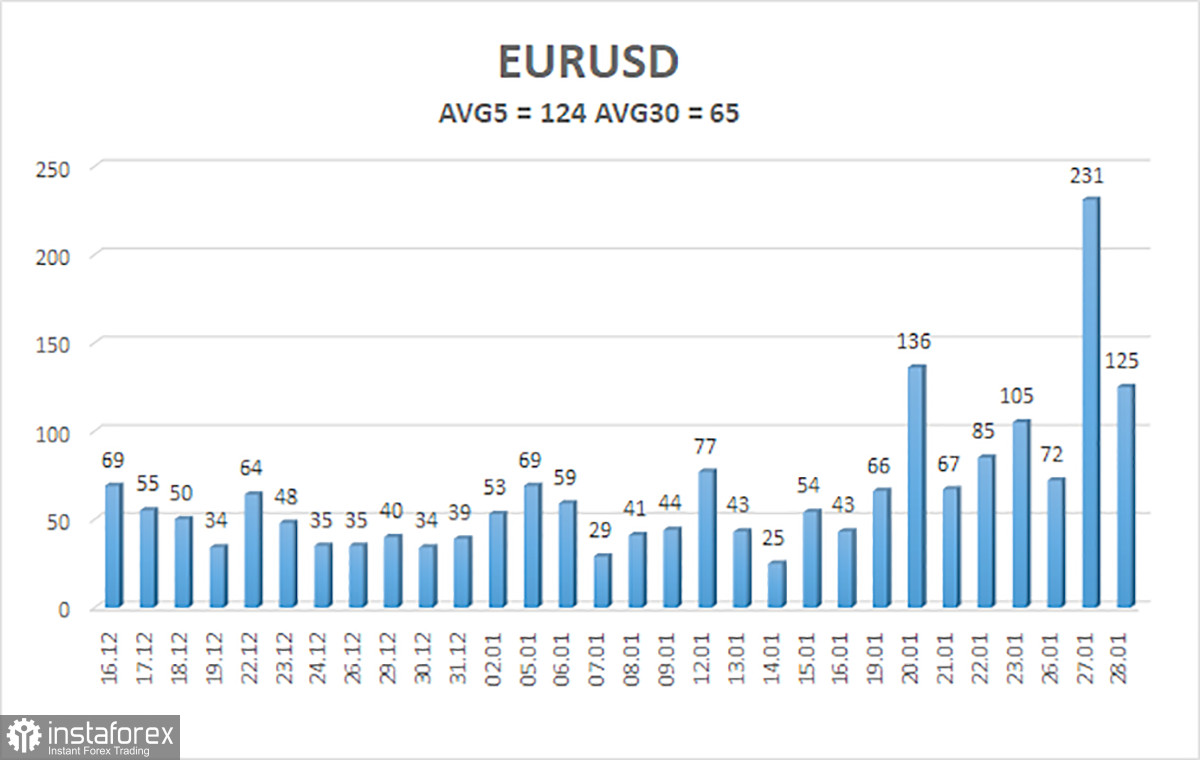
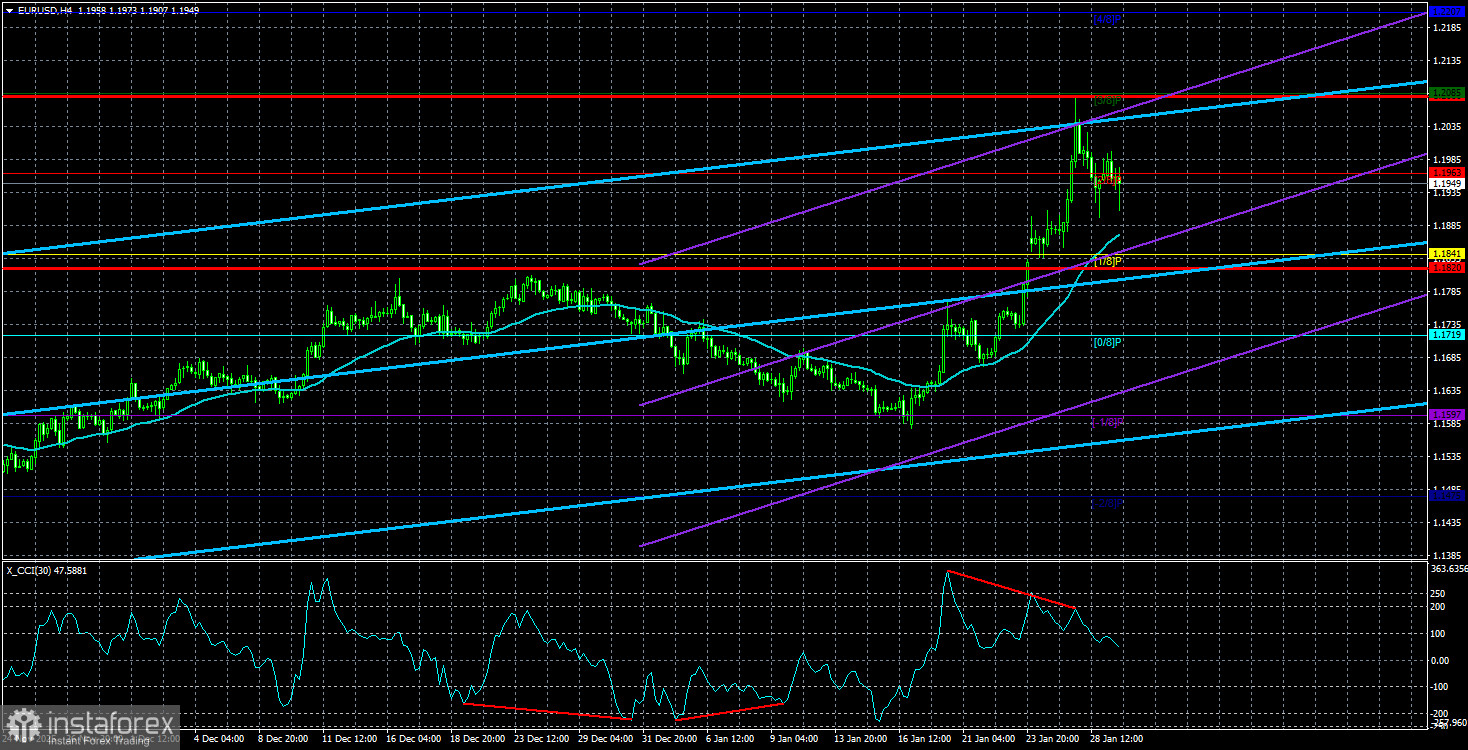
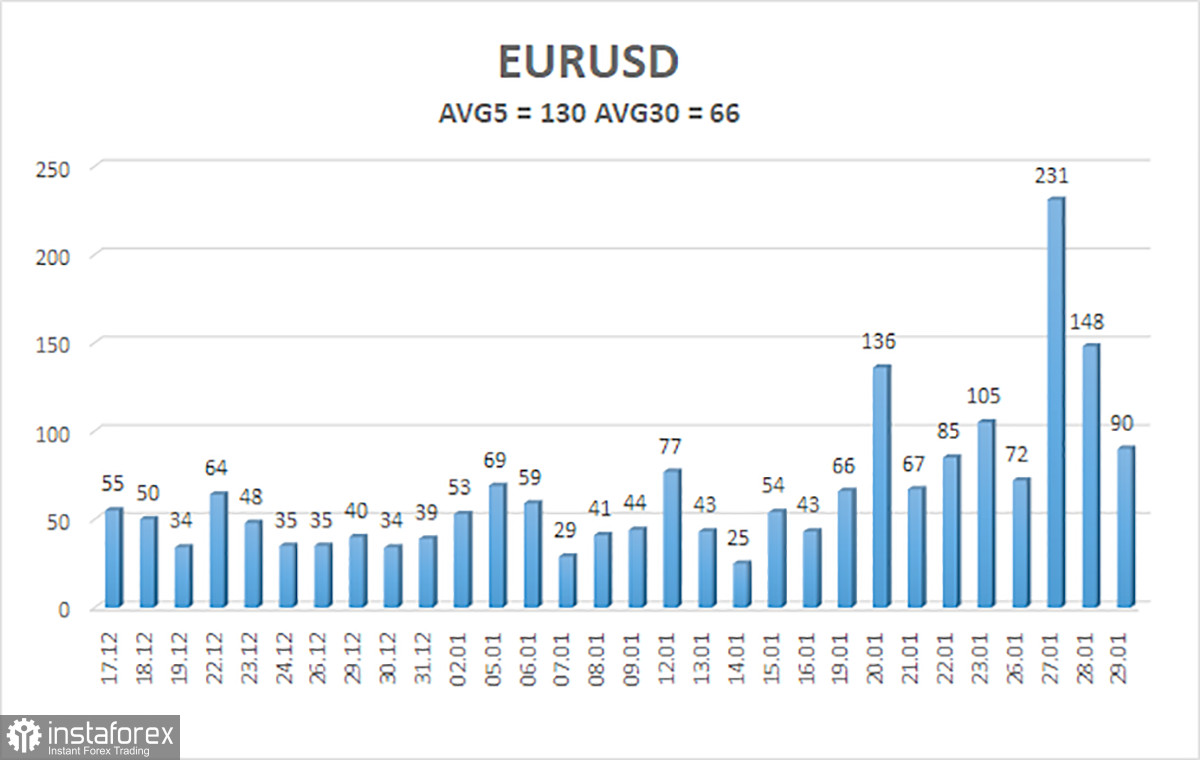
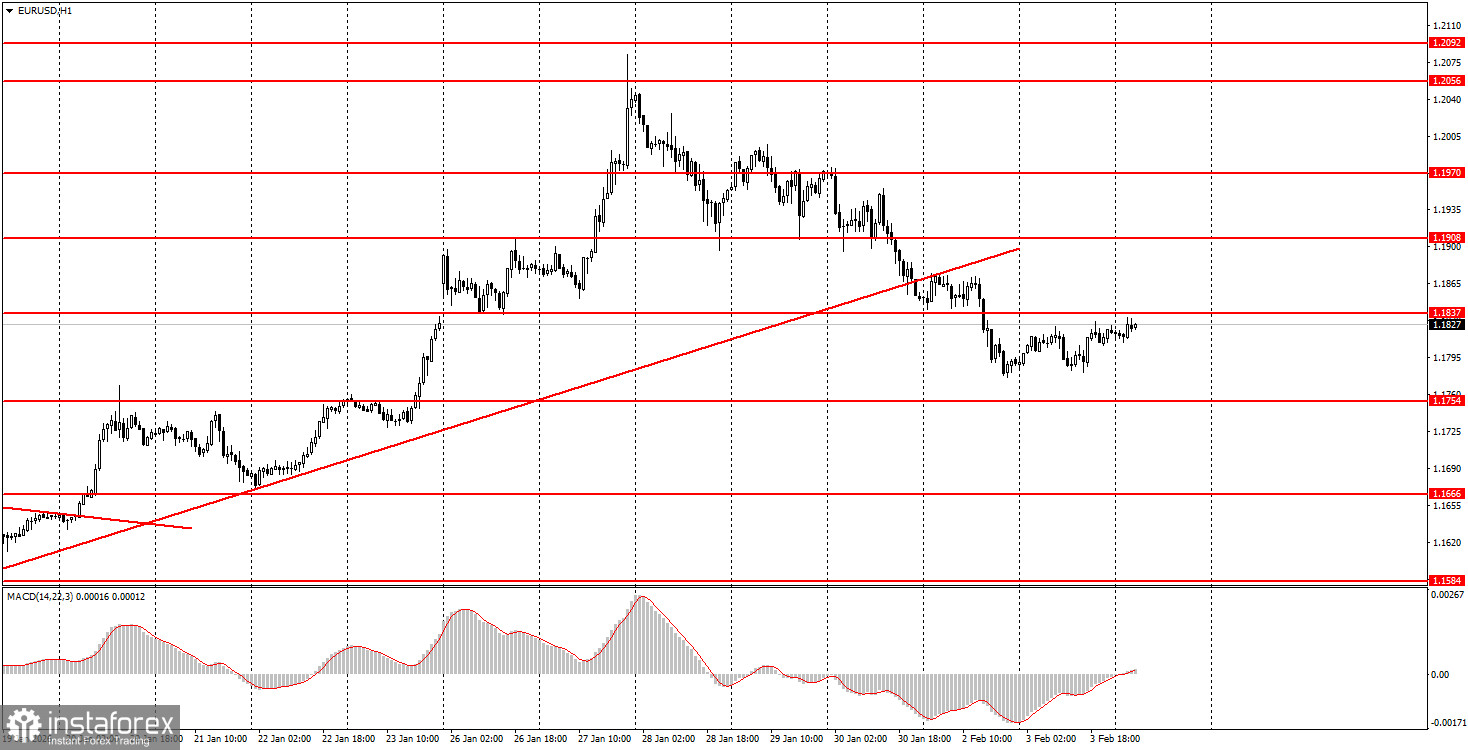
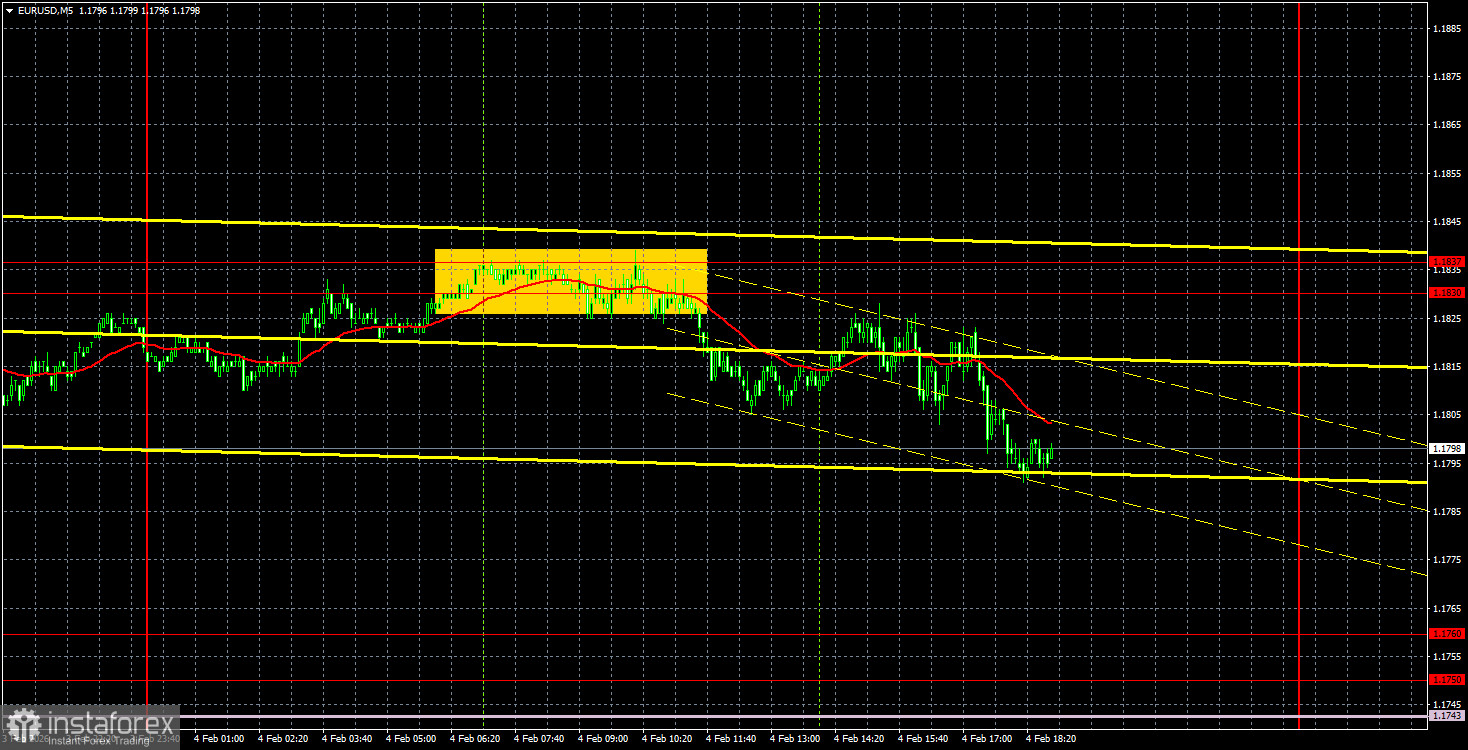
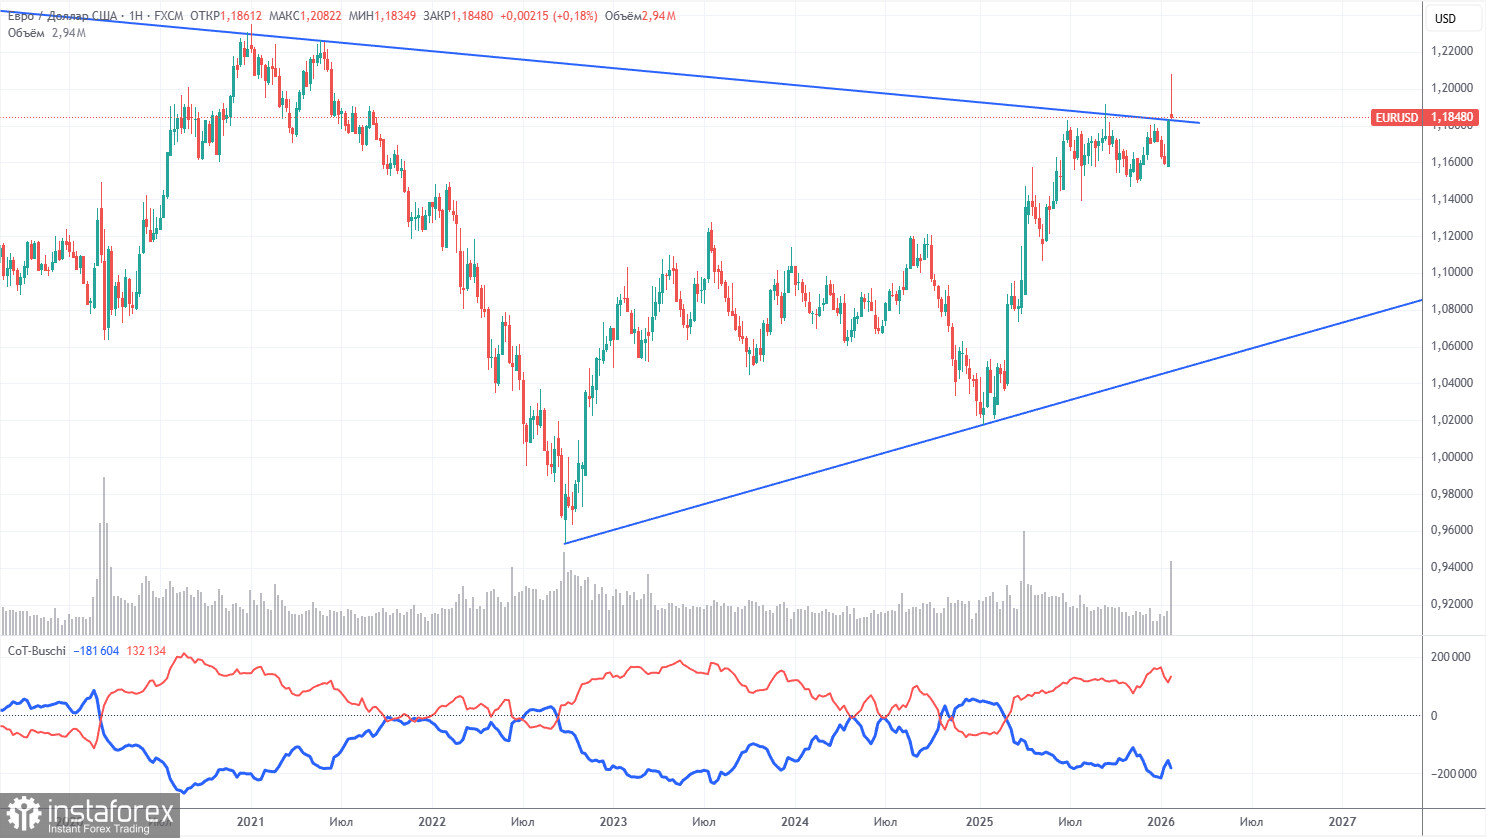
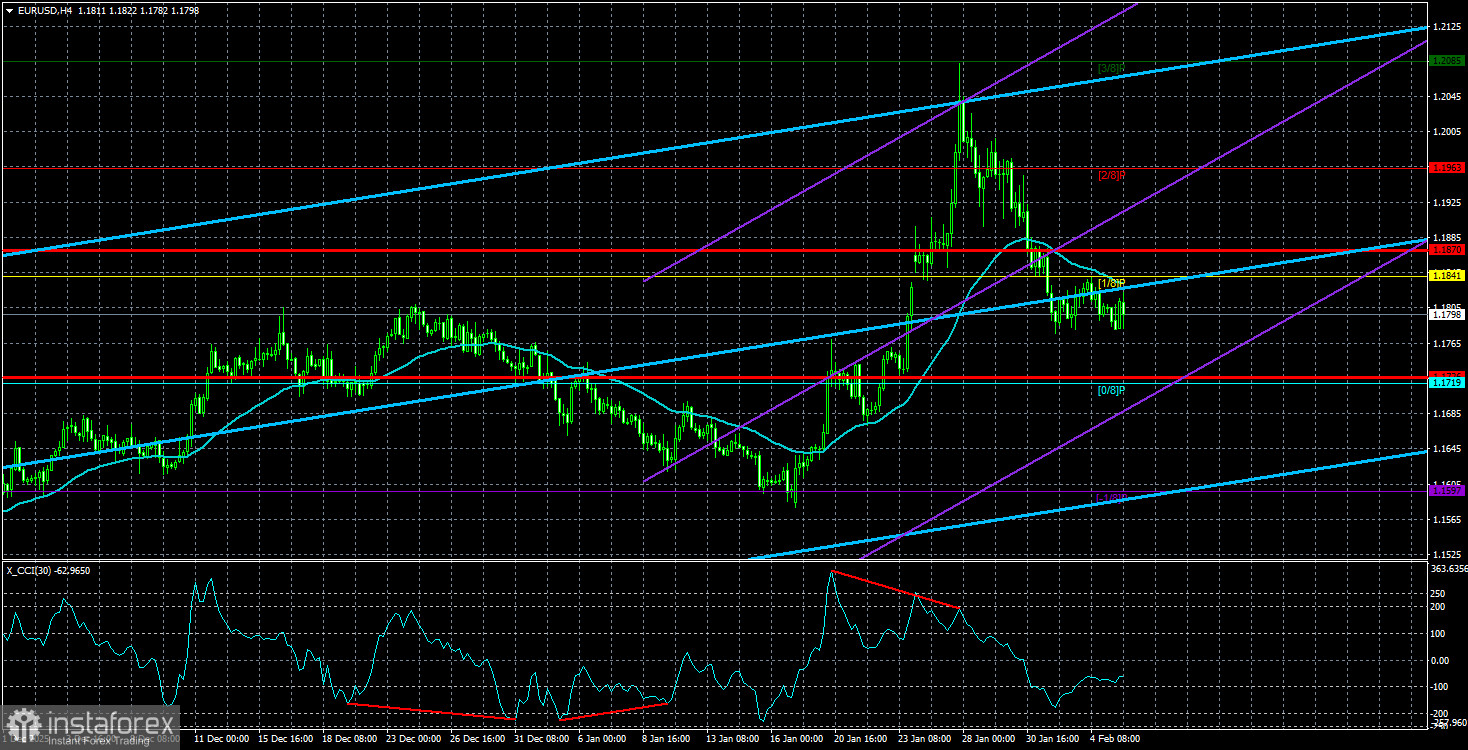
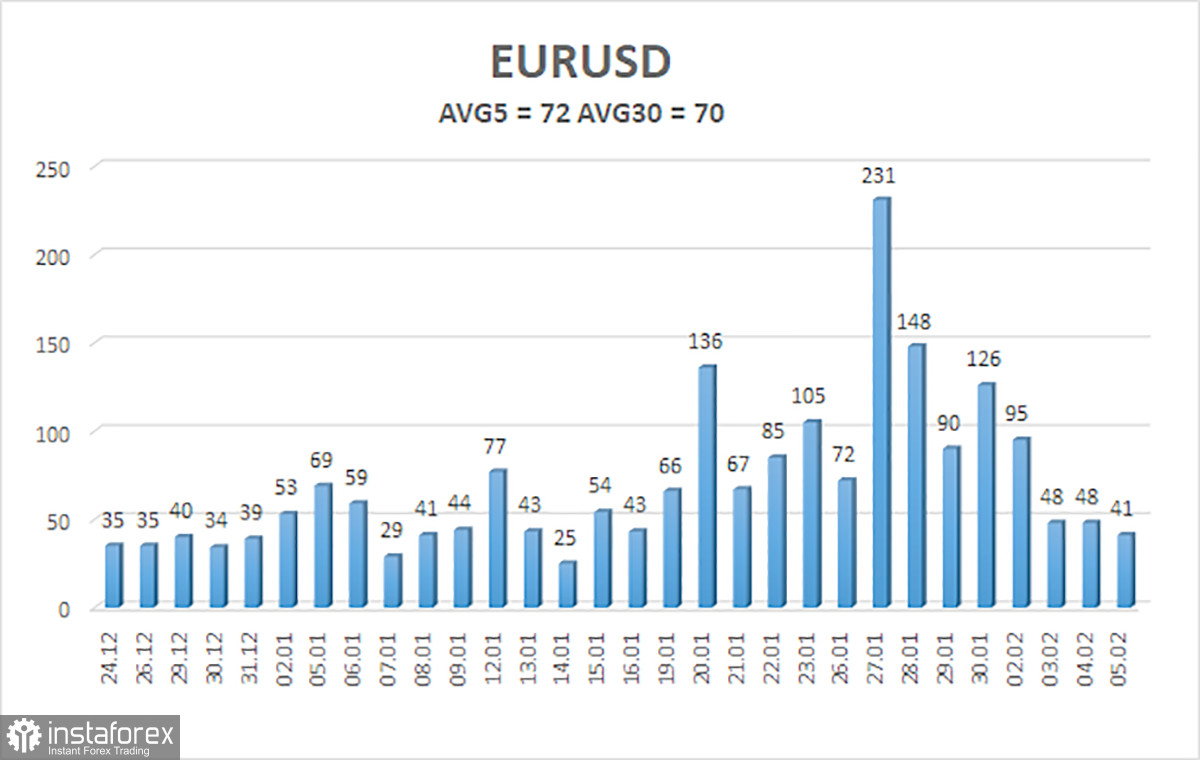
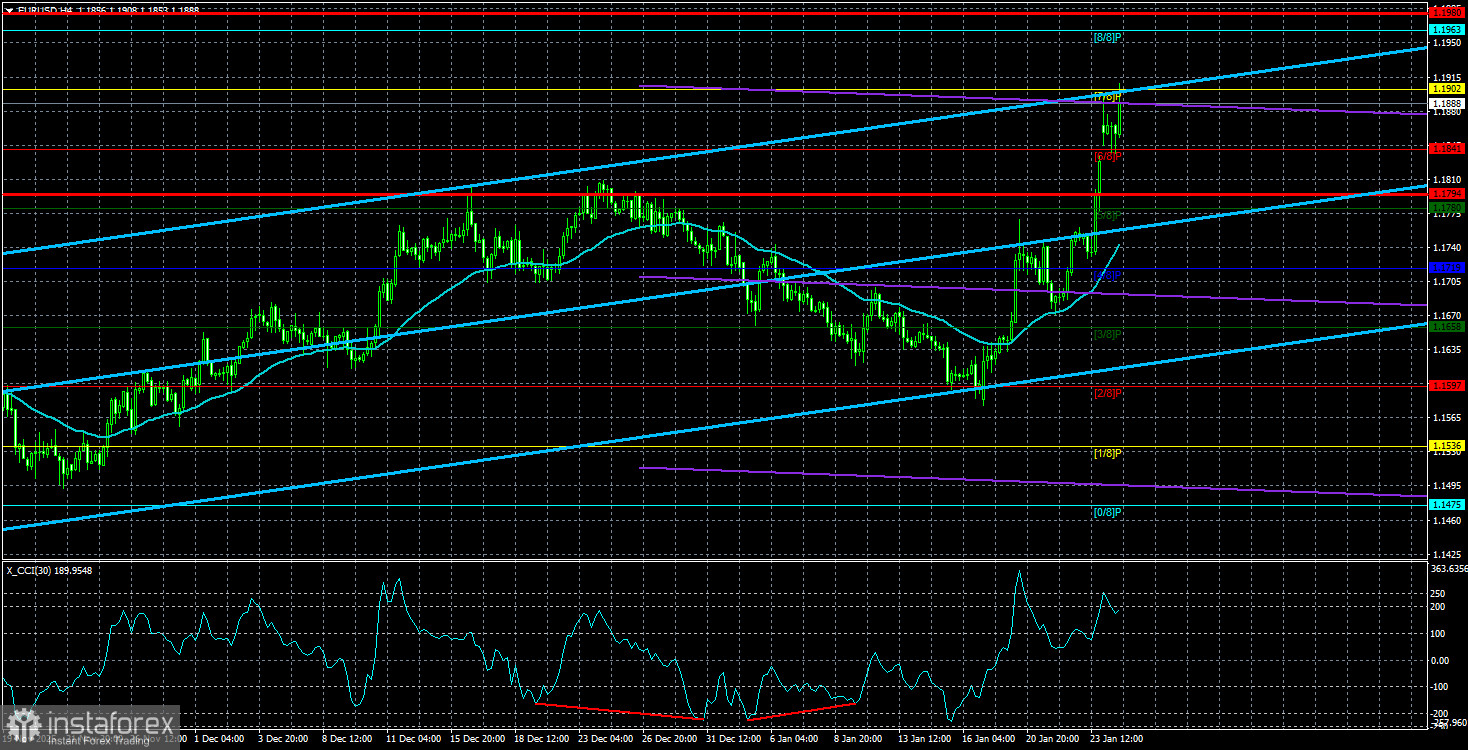
The average volatility of the EUR/USD currency pair over the last five trading days as of January 27 is 93 pips, which is considered "average." We expect the pair to trade between 1.1794 and 1.1980 on Tuesday. The upper linear regression channel points upward, indicating further growth for the euro. The CCI indicator entered overbought territory last week, signaling a downward correction, which has already completed. Nearest Support Levels: S1 – 1.1841 S2 – 1.1780 S3 – 1.1719 Nearest Resistance Levels: R1 – 1.1902 R2 – 1.1963 R3 – 1.2024 Trading Recommendations: The EUR/USD pair continues its upward movement, which has recently accelerated. The global fundamental backdrop remains crucial for the market and remains highly negative for the dollar. The pair spent seven months in a sideways channel, and it is time to resume that trend. There is no fundamental basis for the dollar's long-term growth. Below the moving average, small shorts can be considered with targets at 1.1719 and 1.1658 based purely on technical grounds. Above the moving average line, long positions remain relevant with targets of 1.1963 and 1.1980. Explanations for the Illustrations: Linear regression channels help determine the current trend. If both are directed in one way, the trend is currently strong; The moving average line (settings 20,0, smoothed) defines the short-term trend and the direction in which trading should currently be conducted; Murray levels are target levels for movements and corrections; Volatility levels (red lines) indicate the probable price channel in which the pair will operate for the next day, based on current volatility indicators; The CCI indicator entering the oversold area (below -250) or the overbought area (above +250) means that a trend reversal in the opposite direction is approaching.

Analysis are provided by InstaForex.


Read more: https://ifxpr.com/3O5F78c
IFX Bella
 
Posts: 585
Joined: Sat Dec 08, 2012 12:39 am

Re: Instaforex Analysis

Postby IFX Bella » Wed Jan 28, 2026 2:56 am

Forex Analysis & Reviews: EUR/USD: Trading Recommendations and Analysis for January 28. The Euro Is Rising Rapidly

EUR/USD Analysis 5M


Image

The EUR/USD currency pair continued its upward movement on Tuesday after a brief pause. The macroeconomic backdrop was virtually absent in the Eurozone and the US yesterday, so the dollar's further decline cannot even theoretically be linked to any reports. The market simply continues to sell the dollar almost without interruption. This is the scenario we warned traders about. Once the seven-month flat concludes, the trend of 2025 will resume. At that point, the pair won't need any local news to continue moving upward. Moreover, the reasons to sell the US currency are only increasing day by day. After Greenland, Donald Trump has shifted his attention to Canada. After Canada, it will be South Korea. When the US president completes his global tour, he will resume imposing tariffs. Additionally, Trump openly states that he wants to see a cheaper dollar. Well, if the president himself believes this, what can traders do? Essentially, the US government has given the green light to devalue the national currency. Denying this fact is pointless. On the hourly timeframe, the pair's rise is so strong that it prevents the construction of a trend line. Volatility has increased significantly since the flat ended. Everything has unfolded as we predicted. On the 5-minute timeframe, the first buy signal was generated yesterday at the beginning of the American trading session. The pair broke through the 1.1922 level and continued its upward movement, reaching the 1.1971-1.1988 area. This is far from being the peak growth for the European currency.

COT Report

Image

The latest COT report is dated January 20. The illustration above clearly shows that the net position of non-commercial traders remains "bullish." Since Trump took office as president of the United States for the second time, only the dollar has been declining. We cannot say with 100% certainty that the decline of the American currency will continue, but current developments around the world suggest this is a possibility. We still do not see any fundamental factors supporting the strengthening of the European currency, but there are sufficient factors for the decline of the American currency. The global downward trend is still in place, but how significant is it in terms of where the price has moved in the last 18 years? A new upward trend has been forming over the last three years, and in the coming weeks, the price may break through the global descending trend line, which would confirm further long-term growth. The positioning of the red and blue lines of the indicator continues to indicate a sustained bullish trend. Over the last reporting week, long positions in the "Non-commercial" group decreased by 8,400, while short positions increased by 12,600. Consequently, the net position declined by 21,000 contracts over the week.

EUR/USD Analysis 1H

Image

On the hourly timeframe, the EUR/USD pair continues to form a new upward trend. The pair has officially exited the sideways channel of 1.1400-1.1830, where it spent seven months. Thus, we still expect the European currency to continue growing in the near future. As mentioned, the trade war will escalate, and Trump will continue to use tariffs as the main tool to push his interests. For January 28, we identify the following levels for trading: 1.1362, 1.1426, 1.1542, 1.1604-1.1615, 1.1657-1.1666, 1.1750-1.1760, 1.1830-1.1837, 1.1922, 1.1971-1.1988, 1.2051, and 1.2095, along with the Senkou Span B line (1.1673) and Kijun-sen (1.1827). The Ichimoku indicator lines may shift throughout the day, which should be taken into account when determining trading signals. Don't forget to set your stop-loss orders to break-even once the price moves in the correct direction by 15 pips. This will protect against potential losses if the signal turns out to be false. On Wednesday, no significant events are scheduled in the Eurozone, while the Fed meeting will occur in the US. The Fed meeting is always important and interesting, but under the current circumstances, the market is fully focused on Donald Trump. By the way, the stability of the Fed's operations depends on Trump. Therefore, we believe that the Fed meeting will not positively influence the dollar under any circumstances. Trading Recommendations: On Wednesday, traders may trade in the area of 1.1971-1.1988. New longs will become relevant upon consolidation above this area with targets at 1.2051 and 1.2095. Short positions can be considered on a bounce from this area, targeting 1.1922.

Analysis are provided by InstaForex.

Read more: https://ifxpr.com/4rfWW2J
IFX Bella
 
Posts: 585
Joined: Sat Dec 08, 2012 12:39 am

Re: Instaforex Analysis

Postby IFX Bella » Thu Jan 29, 2026 3:43 am

Forex Analysis & Reviews: Overview of the EUR/USD Pair. January 29. Trump Draws a Line Under the Dollar Disputes

Image

The EUR/USD currency pair began correcting on Wednesday and fell sharply throughout the day. However, such a decline does not, first, affect the current technical picture and trend, and second, it was expected after the earlier sharp rise in quotes. Recall that a completely vertical move typically does not last long. This is exactly what we observed on Tuesday. As is customary, we will not consider the FOMC meeting results in this article. We still believe that at least 12-24 hours should pass for the market to digest all the information received and calm down. Why did the dollar accelerate its decline on Tuesday? It's simple. Donald Trump. In general, if you see another decline of the American currency on the charts or exchanges, you can be sure of who is behind it. Trump talked about the "too expensive" dollar back during his first term in the White House. At that time, it turned out that these were just the flowers, and the dollar, after four years of Trump's presidency, did not change much against its competitors. With his return to the White House, Trump immediately took the bull by the horns. He stated openly that the stronger the dollar, the lower US exports to other countries. And it was the negative trade balance that the Republicans wanted to correct. Therefore, it was clear last year that under Trump, the dollar would not rise. Of course, the trade war was not initiated by the leader of the White House to lower the dollar rate. His controversial legislative acts are also unlikely to be tied to a desire to depreciate the American currency. But these, if one may say so, are parts of one puzzle. And yesterday, Trump openly stated that he was pleased with the current dollar rate but hinted that if it fell even lower, it would be even better. After these words from the American president, the decline accelerated. Now, dear traders, try to answer one simple question: how can one expect the strengthening of the American currency if Trump's entire policy only evokes one desire among market participants – to run away from the dollar without looking back? If the President of the United States openly states that the dollar should fall as low as possible? If Trump insists on easing the FOMC's monetary policy, which will also lead to a decline in the American currency? We have been talking about this all last year. And now, a seven-month flat is over. There are countless factors behind the decline of the American currency. In a few days, a new "shutdown" will begin, and Trump will raise and impose tariffs as soon as he has new complaints against anyone on this planet. And complaints will arise regularly; you can rest assured.

Image

The average volatility of the EUR/USD currency pair over the last 5 trading days as of January 29 is 124 pips and is characterized as "high." We expect the pair to trade between 1.1810 and 1.2058 on Thursday. The upper linear regression channel is pointing upward, indicating continued euro growth. The CCI indicator entered the overbought area last week and formed a "bearish" divergence this week, signaling an upcoming pullback. Note how volatility increased as soon as the pair left the sideways channel of 1.1400-1.1830. Nearest support levels: S1 – 1.1841 S2 – 1.1719 S3 – 1.1597 Nearest resistance levels: R1 – 1.1963 R2 – 1.2085 R3 – 1.2207 Trading recommendations: The EUR/USD pair continues its upward movement, which has sharply intensified recently. The global fundamental backdrop remains extremely negative for the dollar, which remains of great significance to the market. The pair spent seven months in a sideways channel, and it is likely that the time has come to renew the trend. For long-term growth, the dollar has no fundamental basis. When the price is below the moving average, small shorts can be considered with a target of 1.1719 on purely technical grounds. Above the moving average line, long positions remain relevant with targets of 1.2058 and 1.2085. Explanations for the Illustrations: Linear regression channels help determine the current trend. If both are directed in one way, the trend is currently strong; The moving average line (settings 20,0, smoothed) defines the short-term trend and the direction in which trading should currently be conducted; Murray levels are target levels for movements and corrections; Volatility levels (red lines) indicate the probable price channel in which the pair will operate for the next day, based on current volatility indicators; The CCI indicator entering the oversold area (below -250) or the overbought area (above +250) means that a trend reversal in the opposite direction is approaching.

Analysis are provided by InstaForex.

Read more: https://ifxpr.com/3M0Lo4z
IFX Bella
 
Posts: 585
Joined: Sat Dec 08, 2012 12:39 am

Re: Instaforex Analysis

Postby IFX Bella » Fri Jan 30, 2026 2:45 am

Forex Analysis & Reviews: Overview of the EUR/USD Pair. January 30. The Fed Meeting to Forget

Image

The EUR/USD currency pair continued to correct slightly on Thursday, but it does not seem eager to move far from the recent four-year highs. Recall that on Wednesday evening, the results of the first Federal Reserve meeting of the year were announced, and honestly, the feelings after this event are mixed. On the one hand, the market was confident that no significant decisions would be made and that Powell would make no announcements. On the other hand, there was a desire to see Powell react to what is happening around him. It should be noted that Powell's term as Fed Chair expires in May. However, he may remain on the FOMC until 2028, acting as a voting member. Naturally, Donald Trump would like to avoid such a scenario, and we do not know Powell's stance on this issue. And we did not find out on Wednesday evening. It is also worth mentioning that Powell commented on the situation for the first time this year amid Trump's aggression towards him, stating that he is under pressure from the administration regarding his refusal to lower the key rate as Trump demands. It would have been useful to hear the Fed Chair's comments on this matter and regarding the progress of the legal investigation. However, in essence, Powell did not convey anything new, important, or interesting. He noted that the US economy is doing well, the labor market has begun to recover, and the unemployment rate is declining. However, these three indicators need more time to fully reflect the 0.75% rate cut at the end of last year. Powell also pointed to the elevated inflation rate, which prevents the Fed from making hasty decisions to ease monetary policy. Essentially, Powell reiterated his sacred phrase that "decisions will be made from meeting to meeting based on macroeconomic data." Powell also mentioned that a new "shutdown" could begin in America on February 1, making it more challenging for the Fed to make a rate decision in March due to the absence of relevant and reliable economic data. At the end of his speech, he urged the Fed to remain apolitical, as it is the guardian of financial stability. Of the entire FOMC, two representatives voted for a rate cut. It is not surprising that one of them was Stephen Miran and the other was Christopher Waller. It is worth recalling that Miran was appointed to his position by Donald Trump just six months ago, while Christopher Waller is vying to become the new Fed Chair. It is surprising that Michelle Bowman, who also sought the Fed Chair position and was appointed by Trump, is not on this list. Is she no longer a contender? The results of the Fed meeting can be summed up in one word – "bland." Therefore, the market reaction was virtually non-existent. Traders continue to closely monitor all statements and remarks by Trump, as they are the primary drivers of the currency market in 2026.

Image

As of January 30, the average volatility of the EUR/USD currency pair over the last 5 trading days is 130 pips and is characterized as "high." We expect the pair to trade between 1.1820 and 1.2080 on Friday. The upper linear regression channel is pointing upward, indicating further euro appreciation. The CCI indicator entered the overbought area last week, and this week formed a "bearish" divergence, which warned of an upcoming pullback. Note how volatility increased as soon as the pair exited the sideways channel of 1.1400-1.1830. Nearest support levels: S1 – 1.1841 S2 – 1.1719 S3 – 1.1597 Nearest resistance levels: R1 – 1.1963 R2 – 1.2085 R3 – 1.2207 Trading Recommendations: The EUR/USD pair continues its upward movement, which has sharply intensified recently. The global fundamental background remains extremely negative for the dollar. The pair spent seven months in a sideways channel, and the time to resume the trend has likely arrived. The dollar lacks a fundamental basis for long-term growth. When the price is below the moving average, small shorts can be considered with a target of 1.1719 on purely technical grounds. Above the moving average line, long positions remain relevant with targets of 1.2085 and 1.2207.

Analysis are provided by InstaForex.

Read more: https://ifxpr.com/4kiff59
IFX Bella
 
Posts: 585
Joined: Sat Dec 08, 2012 12:39 am

Re: Instaforex Analysis

Postby IFX Bella » Mon Feb 02, 2026 2:13 am

Forex Analysis & Reviews: American Dollar. Weekly Preview

Image

The American dollar will once again be the main driver of the entire currency market. There will be plenty of economic news next week, and 2026 has accustomed us to the fact that Donald Trump also regularly surprises the markets. Therefore, even economic events alone will be enough to prevent both instruments from stagnating. And if we add political factors to them... But let's not speculate about Trump. Only the US president knows what he will announce this time. I am sure that even his closest circle cannot always predict his statements. As for economic events, I advise focusing on the ISM business activity indexes in the services and manufacturing sectors (to be released on Monday and Wednesday), the ADP labor market report (Wednesday), the JOLTS report on job openings (Tuesday), the unemployment reports, and Nonfarm Payrolls (Friday), as well as the University of Michigan consumer sentiment index (Friday). Undoubtedly, the key events are Nonfarm Payrolls and the unemployment rate, but the last FOMC meeting took place last week. Before the next Fed governors' meeting, these reports will be released once again. Therefore, Jerome Powell and his colleagues will analyze two sets of data to make a decision. However, the decision will depend not only on economic indicators but also, for example, on a "shutdown." Economists believe that a new "shutdown" will not last long, but I would not be so certain. If it drags on for several more weeks, the Fed may extend its pause due to a lack of statistical data.

Image

In addition, the market is focused on the legal investigation against Jerome Powell and Lisa Cook. Trump has not abandoned his intention to dismiss both to ensure neither annoys him further within the FOMC. American courts are not the fastest in the world, but "water wears away stone." During Trump's first presidential term, he only threatened and criticized, but now he is doing everything to restructure the FOMC committee. Wave Picture for EUR/USD: Based on the conducted analysis of EUR/USD, I conclude that the instrument continues to build an upward segment of the trend. Trump's policies and the Fed's monetary policy remain significant factors in the long-term decline of the American currency. The targets for the current segment of the trend may reach the 25 figure. At this moment, I believe that the global wave 4 has completed its formation, so I expect further increases in quotes. However, I also expect a downward wave in the near term, as the series of waves a-b-c-d-e also appears to be complete. Soon, my readers may want to look for benchmarks for new purchases.

Image

Wave Picture for GBP/USD: The wave structure of the GBP/USD instrument has become quite clear. The five-wave upward structure has completed its formation, but the global wave 5 may take on a much more extended form. I believe that a corrective wave or wave set may begin to form soon, after which the upward trend will likely resume. Consequently, in the coming weeks, I recommend looking for opportunities for new purchases. In my opinion, under Trump, the British pound has a good chance of reaching $1.45-$1.50. Trump himself welcomes the decline of the dollar. All of his actions have a dual positive effect: a weaker dollar and the resolution of internal, external, trade, and geopolitical issues. Key Principles of My Analysis: Wave structures should be simple and clear. Complex structures are difficult to trade and often entail changes. If there is no confidence in what is happening in the market, it is better not to enter it. There can never be 100% certainty in the direction of movement, nor can there ever be. Do not forget about protective Stop Loss orders. Wave analysis can be combined with other forms of analysis and trading strategies.

Analysis are provided by InstaForex.

Read more: https://ifxpr.com/4qgauKX
IFX Bella
 
Posts: 585
Joined: Sat Dec 08, 2012 12:39 am

Re: Instaforex Analysis

Postby IFX Bella » Tue Feb 03, 2026 3:00 am

Forex Analysis & Reviews: Trading Recommendations and Deal Analysis for GBP/USD on February 3. The Pound is on the Edge

GBP/USD Analysis 5M


Image

The GBP/USD currency pair continued its downward movement on Monday, which can be attributed to the macroeconomic backdrop. Recall that one report each was published in the UK and the US yesterday regarding business activity in the manufacturing sector. However, the US report was important—ISM, which is published in a single estimate—while the UK report was not significant and was released in two estimates. As a result, the dollar gained a bit more value by the end of the day. Overall, the currency market did not react to the new wave of protests in the US against Donald Trump, nor to the release of the "Epstein files," in which Trump's name also appears. While this is not the best topic for discussion, it is still a pretty serious scandal. However, the dollar is still ignoring new portions of negativity. Nevertheless, we have already noted that the current decline in the pair is purely technical. We still do not see reasons for a long-term increase in the American currency. This week, the dollar will have to undergo a macroeconomic exam. If the ISM indices and the ADP and JOLTs reports are interesting and sufficiently significant reports, the NonFarm Payrolls and unemployment rate could determine future dynamics. Jerome Powell literally stated just last week that the US labor market is recovering, the economy is growing at a good pace, and inflation remains elevated. Thus, if the labor market does not disappoint the Fed and shows signs of recovery, the dollar could continue to rise. However, in our view, global fundamental factors will sooner or later drag the US currency down. On the 5-minute timeframe, three trading signals were formed yesterday. First, the pair very imprecisely rebounded from the area of 1.3671-1.3681, managing to climb about 20 pips. Then it broke through the specified area and, as a bonus, rebounded from it from below. In these two cases, the price moved in the desired direction by 25 and 30 pips, respectively. The target level was not reached at any point. Monday was not the best day, but there were no losses on the trades.

COT Report

Image

The COT reports for the British pound show that commercial traders' sentiment has been changing steadily in recent years. The red and blue lines, representing the net positions of commercial and non-commercial traders, frequently cross and are mostly near the zero mark. Currently, the lines are converging, with non-commercial traders still dominating... sales. Recently, speculators have begun building long positions, so a shift in sentiment may occur soon, though it is unlikely to affect the GBP/USD pair. The dollar continues to decline due to Donald Trump's policies, which is clearly visible on the weekly timeframe (illustration above). The trade war will continue in one form or another for a long time, and the Fed will certainly lower rates in the next 12 months. Demand for the dollar will decline, one way or another. According to the latest COT report (dated January 27) on the British pound, the "Non-commercial" group opened 6,500 BUY contracts and 600 SELL contracts. Thus, the net position of non-commercial traders increased by 5,900 contracts over the week. In 2025, the pound rose significantly, but it should be understood that the reason is one: Donald Trump's policies. Once this reason is neutralized, the dollar could start to rise. However, no one knows when this will happen.


GBP/USD Analysis 1H

Image

On the hourly timeframe, the GBP/USD pair continues to form an upward trend. The British pound reached last year's highs without much difficulty and is now poised to rise further. But first, it decided to correct. The fundamental and macroeconomic backdrop fully supports such a development, and the market has been accumulating strength for a new upward move for six months. For February 3, we highlight the following important levels: 1.3201-1.3212, 1.3307, 1.3369-1.3377, 1.3437, 1.3533-1.3548, 1.3615, 1.3671-1.3681, 1.3751-1.3763, 1.3846-1.3886, 1.3948. The Senkou Span B (1.3605) and Kijun-sen (1.3760) lines can also be sources of signals. It is recommended to set the Stop Loss to breakeven when the price moves in the correct direction by 20 pips. The Ichimoku indicator lines may shift throughout the day, which should be taken into account when determining trading signals. On Tuesday, there are no interesting events scheduled in the UK, while the US will have the JOLTs report on job openings, which is not significant. Most likely, trading today will also proceed based on technical factors. Trading Recommendations: Today, traders may consider short positions with targets of 1.3605-1.3615 if the price rebounds from the area of 1.3671-1.3681. Long positions will become relevant with targets of 1.3751-1.3763 if the price consolidates above 1.3671-1.3681. Explanations for Illustrations: Price levels of support and resistance are thick red lines around which movement may end. They are not sources of trading signals. The Kijun-sen and Senkou Span B lines are Ichimoku indicator lines shifted to the hourly timeframe from the 4-hour timeframe. They serve as strong lines. Extreme levels are thin red lines from which the price has previously rebounded. They are sources of trading signals. Yellow lines represent trend lines, trend channels, and any other technical patterns. Indicator 1 on the COT charts shows the net position size of each trader category.

Analysis are provided by InstaForex.


Read more: https://ifxpr.com/3M0tsaj
IFX Bella
 
Posts: 585
Joined: Sat Dec 08, 2012 12:39 am

Re: Instaforex Analysis

Postby IFX Bella » Wed Feb 04, 2026 4:13 am

Forex Analysis & Reviews: How to Trade the EUR/USD Currency Pair on February 4? Simple Tips and Trade Analysis for Beginners

Tuesday's Trade Analysis: 1H Chart of the EUR/USD Pair

Image

The EUR/USD currency pair traded with low volatility on Tuesday, with no significant decrease. Recall that over the past five days, the US dollar has been rising quite actively, and the trend has even changed to a downward one after the ascending trend line was breached. But was such growth justified? In terms of technical factors, yes. Corrections have always been an integral part of a trend. In terms of macroeconomic factors, to some extent, yes, because recent US reports have indeed brought positive news. However, from a fundamental perspective, no. Nothing has changed for the dollar on a global scale. Yet even global fundamental factors cannot pressure the dollar every day. Therefore, within the framework of the upward trend, we saw a technical correction. This week, traders will need to understand how long the "shutdown" will last, whether the US will strike Iran, and the state of the US labor market. These topics define trader sentiment and the direction of the pair's movement.

5M Chart of the EUR/USD Pair

Image

On the 5-minute timeframe, no trading signals were formed on Tuesday. In the evening, the price nearly worked out the area of 1.1830-1.1837, but by that time, it was unlikely worth opening new trades. Today, beginner traders can trade from this area, as the price is situated right around it. How to Trade on Wednesday: On the hourly timeframe, the downward correction continues. Recall that the flat phase lasting 7 months can be considered completed. If so, a long-term upward trend has been restored at the beginning of 2026. Therefore, we expect a new decline for the dollar. The overall fundamental background remains very challenging for the US currency, so we firmly support further upward movement for the euro. On Wednesday, beginner traders may open short positions if there is a rebound from the area of 1.1830-1.1837, targeting 1.1745-1.1754. A price consolidation above the 1.1830-1.1837 area will allow for long positions with a target at 1.1908. On the 5-minute timeframe, levels to consider include 1.1354-1.1363, 1.1413, 1.1455-1.1474, 1.1527-1.1531, 1.1550, 1.1584-1.1591, 1.1655-1.1666, 1.1745-1.1754, 1.1830-1.1837, 1.1908, 1.1970-1.1988, 1.2044-1.2056, 1.2092-1.2104. Today, beginner traders should pay attention to three important reports: the Eurozone inflation report, as well as the ADP and ISM reports for the US services sector. Inflation in the EU may slow to levels at which the ECB will have to contemplate resuming rate cuts. The American reports are important in their own right. Main Rules of the Trading System: The strength of the signal is determined by the time it took to form the signal (rebound or breaking through the level). The shorter the time, the stronger the signal. If two or more trades were opened around a particular level based on false signals, all subsequent signals from that level should be ignored. In a flat market, any pair can generate numerous false signals or no signals at all. In any case, it is best to stop trading at the first signs of a flat. Trades are opened during the time period between the start of the European session and until the middle of the American session, after which all trades should be manually closed. On the hourly timeframe, signals from the MACD indicator should ideally be traded only when there is good volatility and a trend confirmed by a trend line or channel. If two levels are too close to each other (ranging from 5 to 20 pips), they should be considered as a support or resistance area. After moving 15 pips in the correct direction, it is advisable to set the Stop Loss to break-even. What's on the Charts: Support and resistance levels are targets for opening buy or sell trades. Take Profit levels can be placed around them. Red lines indicate channels or trend lines that reflect the current trend and indicate the preferred direction for trading now. The MACD indicator (14,22,3) – the histogram and signal line – serves as a supplementary indicator that can also be used as a source of signals. Important speeches and reports (always found in the news calendar) can significantly influence the movement of the currency pair. Therefore, during their release, trading should be conducted with maximum caution, or it is advised to exit the market to avoid a sharp price reversal against the preceding movement. Beginners trading in the Forex market should remember that not every trade can be profitable. Developing a clear strategy and practicing sound money management are the keys to long-term trading success.

Analysis are provided by InstaForex.

Read more: https://ifxpr.com/46vm3Xj
IFX Bella
 
Posts: 585
Joined: Sat Dec 08, 2012 12:39 am

Re: Instaforex Analysis

Postby IFX Bella » Thu Feb 05, 2026 4:19 am

Forex Analysis & Reviews: Trading Recommendations and Trade Analysis for EUR/USD on February 5. The US Labor Market is Hopeless

Analysis of EUR/USD 5M


Image

The EUR/USD currency pair traded very calmly in the first half of Wednesday and more actively in the second half. On the hourly timeframe, it is clear that the day's movements cannot be classified as a resumption of the downward trend or as a continuation of the correction. Price changes were minimal. Nevertheless, the European currency is currently below the Ichimoku indicator lines, indicating a local downward trend. The technical situation is simple and clear, but the macroeconomic context is much more complex. We should start with the fact that yesterday's Eurozone inflation report could have triggered a significant drop in the euro. Despite the forecasts matching the actual figure (1.7%), this value is low enough for the ECB to begin considering easing monetary policy. Whether this is the case or not will be revealed today, but the report itself allowed the euro to drop. In the second half of the day, the market's reaction was more logical and adequate. The only published report this week, the ADP report on the US labor market, showed another dismal figure, falling short of even the minimum forecasts. Thus, in the second half of the day, the dollar had every reason to decline sharply. The ISM services activity index exceeded expectations, but not enough to have the market overlook the ADP report. On the 5-minute timeframe, one trading signal was formed on Wednesday in the area of 1.1830-1.1837. During the European trading session, the price bounced from this area, and by the end of the day, it moved in the desired direction by about 15 pips. Not a significant gain, but the volatility yesterday was low.

COT Report

Image

The latest COT report dated January 27 shows that the net position of non-commercial traders remains "bullish." Since Trump took office as president of the United States for the second time, the dollar has only been falling. We cannot say with 100% certainty that the decline of the American currency will continue, but current developments around the world hint at this possibility. We still do not see any fundamental factors supporting the strengthening of the European currency, while there are sufficient factors for the weakening of the dollar. The global downward trend persists, but is it still relevant to consider where the price has moved over the last 18 years? A new upward trend has formed over the last three years, breaking through the global downward trend line. This trend line may be the cause of the downward pullback. The positioning of the red and blue lines of the indicator continues to indicate the preservation of a "bullish" trend. Over the last reporting week, the number of long positions in the "Non-commercial" group increased by 15,100, while the number of short positions decreased by 5,300. Consequently, the net position increased by 20,400 contracts over the week.

Analysis of EUR/USD 1H

Image

On the hourly timeframe, the EUR/USD pair continues to form an upward trend despite breaking the trendline and the ongoing correction. The pair has officially left the sideways channel of 1.1400-1.1830, in which it spent seven months. Therefore, we still expect growth in the European currency in 2026. The ECB and the Eurozone may resist this, but Donald Trump is expertly managing the dollar. Most of his decisions lead to its depreciation. For February 5, we highlight the following important levels for trading: 1.1362, 1.1426, 1.1542, 1.1604-1.1615, 1.1657-1.1666, 1.1750-1.1760, 1.1830-1.1837, 1.1907-1.1922, 1.1971-1.1988, 1.2051, 1.2095, as well as the Senkou Span B line (1.1830) and Kijun-sen (1.1878). The Ichimoku indicator lines may shift throughout the day, which should be taken into account when determining trading signals. Remember to set the Stop Loss at breakeven if the price moves in the correct direction by 20 pips, which will safeguard against potential losses if the signal turns out to be false. On Wednesday, the Eurozone is set to announce the results of the Bank of England's first meeting of the year. It is expected that the decision will be made to keep the key rate unchanged. The British pound may react only to unexpected results from the Monetary Policy Committee's voting on the rate. Trading Recommendations: Today, traders may consider short positions with a target of 1.3533-1.3548 if the price consolidates below the 1.3615-1.3633 range. Long positions will become relevant with a target of 1.3751-1.3763 if the price bounces from the Senkou Span B line. Explanations for Illustrations: Price levels of support and resistance are thick red lines around which movement may end. They are not sources of trading signals. The Kijun-sen and Senkou Span B lines are Ichimoku indicator lines shifted to the hourly timeframe from the 4-hour timeframe. They serve as strong lines. Extreme levels are thin red lines from which the price has previously rebounded. They are sources of trading signals. Yellow lines represent trend lines, trend channels, and any other technical patterns. Indicator 1 on the COT charts shows the net position size of each trader category.

Analysis are provided by InstaForex.

Read more: https://ifxpr.com/3MqLJO7
IFX Bella
 
Posts: 585
Joined: Sat Dec 08, 2012 12:39 am

Re: Instaforex Analysis

Postby IFX Bella » Fri Feb 06, 2026 3:06 am

Forex Analysis & Reviews: Overview of the EUR/USD Pair. February 6. How Will the Currency Game Between the U.S. and the EU End?

Image

The EUR/USD currency pair traded quite calmly throughout Thursday, especially given the day's central bank meetings. However, let us remind you that the European Central bank and Bank of England meetings are not the most important events of this week. They were supposed to be, but the U.S. "shutdown" forced the Bureau of Statistics to postpone the publication of the unemployment and Nonfarm reports to next week. However, the meetings of the European and British central banks have not become more important as a result of this postponement. Both central banks were expected to maintain the "status quo," and they did. Of course, certain points allow traders to forecast further developments, but, in our opinion, there is little sense in that. Let us explain why. A full-blown currency war is beginning between Europe and the U.S. No one is talking about it openly, but that's where things are heading. Consider this: in Europe, it is openly stated that an exchange rate above $1.20 for the euro is a blow to the economy. Export levels would decrease in this case, which could be very painful for an already weak industrial production sector. At the same time, in the U.S., Donald Trump welcomes any fall in the dollar and believes the national currency's exchange rate can be lowered even further. Trump is also concerned about export levels. It turns out that Washington and Brussels will strive to weaken their own currencies. It is clear with Washington. Virtually every piece of news from the U.S. poses a potential threat to the dollar. Of course, we do not believe that Trump makes decisions that leave most traders in shock solely to make the dollar cheaper. But in practice, that is precisely what happens. What is the European Union prepared to do to weaken the euro? Only lower the key rate. But to what levels? Let us remind you that the ECB is not an independent structure like the Fed. It is forced to listen to the politicians' opinions and act in the interests of the European Union. However, at the same time, the ECB is unlikely to "detach" the key rate from inflation and begin lowering it in a Trump-like manner (if he were the head of the central bank). Meanwhile, the Federal Reserve is an independent body that may lose its independence this year and does not aim to lower the dollar's exchange rate. Therefore, as long as the Fed maintains its apolitical stance, the ECB can somehow influence the euro's exchange rate. If the Fed loses control of the situation, Trump could lower rates to zero. So, the euro can maintain its current levels against the dollar only if the Fed does not lose its independence from the president. However, Trump has a multitude of aces up his sleeve. Let us remind you that last year, the ECB actively lowered interest rates, yet the euro still rose rapidly. Monetary policy is fine and important, but Trump could carry out a couple more military operations, lay claim to some "unwanted" territory, exit NATO, impose new tariffs, and so on. And the dollar would again go down the drain regardless of what the Fed and ECB are doing. We continue to believe that the dollar remains in a blatant losing position.

Image

The average volatility of the EUR/USD currency pair over the last five trading days as of February 6 is 72 pips, which is classified as "average." We expect the pair to trade between 1.1726 and 1.1870 on Friday. The upper linear regression channel is pointing upwards, indicating further euro growth. The CCI indicator has entered overbought territory, forming two "bearish" divergences that signal an impending pullback. The nearest support levels: S1 – 1.1719 S2 – 1.1597 S3 – 1.1475 The nearest resistance levels: R1 – 1.1841 R2 – 1.1963 R3 – 1.2085 Trading Recommendations: The EUR/USD pair continues a fairly strong correction within an upward trend. The overall global fundamental backdrop remains extremely negative for the dollar. The pair spent seven months in a sideways channel, and now it is likely time to resume the global trend of 2025. The dollar has no fundamental basis for long-term growth. When the price is below the moving average, small shorts can be considered with a target of 1.1726 on purely technical grounds. Above the moving average line, long positions remain relevant with targets of 1.1963 and 1.2085. Explanations for Illustrations: Linear regression channels help to determine the current trend. If both are directed the same way, it indicates a strong trend; The moving average line (settings 20,0, smoothed) defines the short-term trend and the direction that trading should currently take; Murray levels are target levels for movements and corrections; Volatility levels (red lines) are the probable price channel within which the pair will stay in the coming days based on current volatility indicators; The CCI indicator – its entry into the oversold area (below -250) or into the overbought area (above +250) indicates that a trend reversal in the opposite direction is approaching.

Analysis are provided by InstaForex.

Read more: https://ifxpr.com/45UDe4y
IFX Bella
 
Posts: 585
Joined: Sat Dec 08, 2012 12:39 am

Previous

Return to Forex Brokers