Instaforex Analysis

Forex broker related topics and discussions

Re: Instaforex Analysis

Postby IFX Gertrude » Tue Sep 12, 2023 12:25 am

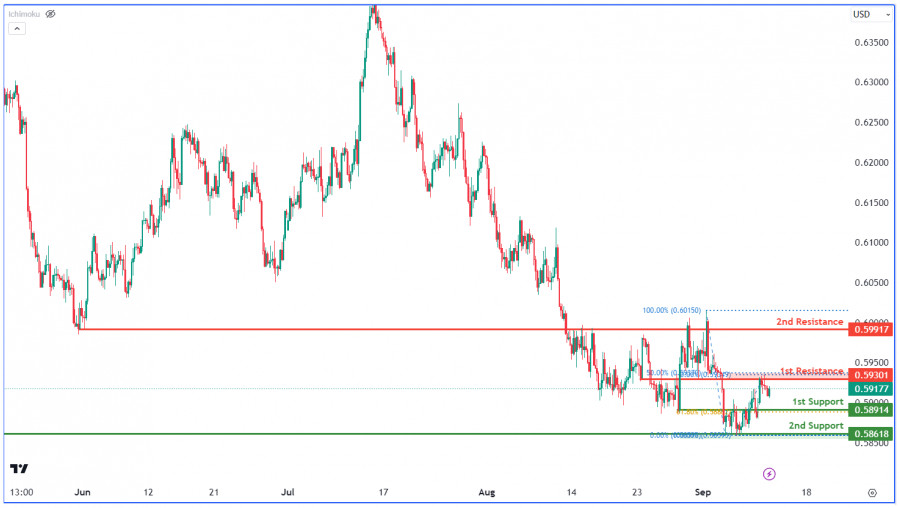
NZDUSD H4 | Falling to 1st support?

Image

The NZD/USD chart currently shows a bullish trend with potential for further upward movement. The 1st resistance at 0.5930, coinciding with the 50.00% Fibonacci retracement, is a key level that may impede bullish progress. Similarly, the 2nd resistance at 0.5992 is also significant for potential resistance.

On the downside, the 1st support at 0.5891 aligns with the 61.80% Fibonacci retracement and serves as a strong support level. The 2nd support at 0.5862, identified as a pullback support, adds to the support zone.

Analysis are provided by InstaForex.

Read More https://ifxpr.com/3LhemcE
Best regards, PR Manager

Learn more about InstaForex Company at http://instaforex.com
IFX Gertrude
 
Posts: 5088
Joined: Wed Nov 07, 2012 6:25 am

Re: Instaforex Analysis

Postby IFX Gertrude » Wed Sep 13, 2023 1:15 am

Forex Analysis & Reviews: Forecast for EUR/USD on September 13, 2023

EUR/USD:
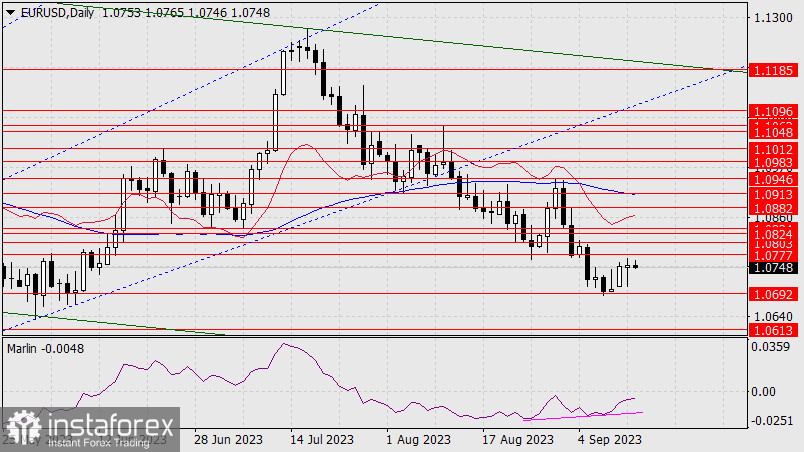
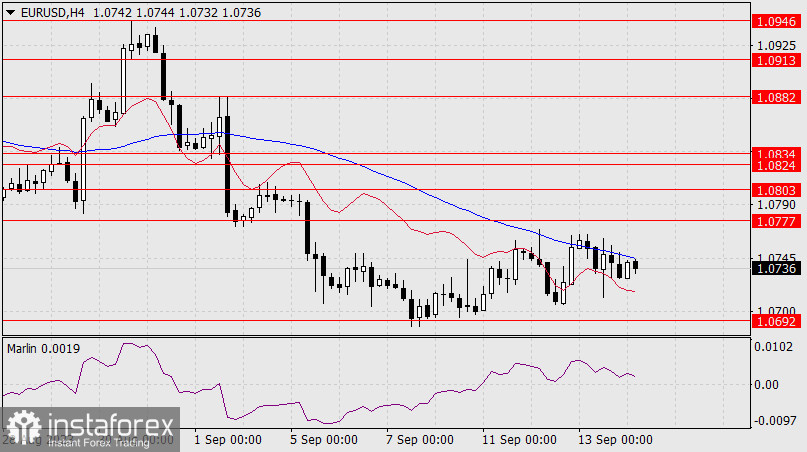
Yesterday, the volatile day ended in favor of the bulls. Despite the numerous target levels on the daily chart, which is due to the corrective nature of the growth, the main target is defined by the MACD line around 1.0913. Overcoming the nearest resistance at 1.0777 will open the second target at 1.0803, the low from August 23rd.

Image

Today, the main driving force could be the US inflation data for August. The forecast for the core CPI is 4.3% YoY, compared to 4.7% YoY the previous month, and the forecast for the CPI suggests an increase from 3.2% YoY to 3.6% YoY. If we assume that the data will come out in line with economists' calculations, investors will pay more attention to the decrease in the core CPI, as the Federal Reserve relies more on it. As a result, expectations of a rate hike will decrease, and the euro will rise.

Image

Analysis are provided by InstaForex.

Read More https://ifxpr.com/3sUIyUP
Best regards, PR Manager

Learn more about InstaForex Company at http://instaforex.com
IFX Gertrude
 
Posts: 5088
Joined: Wed Nov 07, 2012 6:25 am

Re: Instaforex Analysis

Postby IFX Gertrude » Thu Sep 14, 2023 12:28 am

Forex Analysis & Reviews: Forecast for EUR/USD on September 14, 2023

EUR/USD
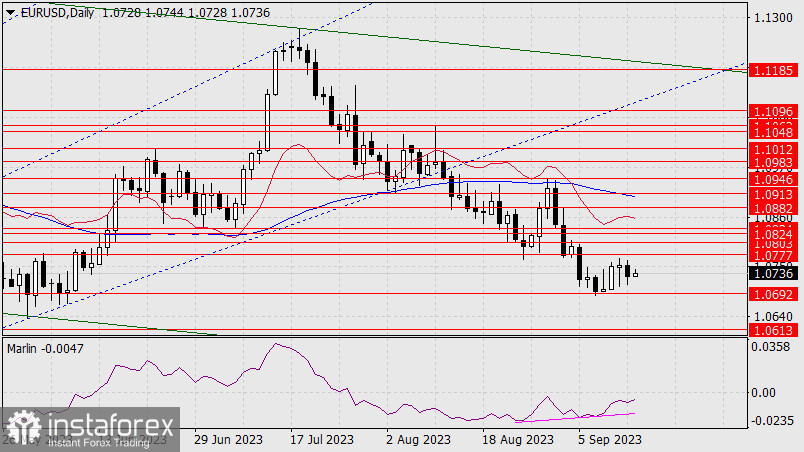
Yesterday's US CPI data came in around forecast levels. The August Core CPI dropped from 4.7% YoY to 4.3% YoY, while the CPI rose from 3.2% YoY to 3.7% YoY (forecast 3.6% YoY). Considering that industrial production in the eurozone plummeted by 1.1% in July and decreased by 2.2% YoY (forecast -0.3%), the euro's decline could have been greater than the 24 pips that we saw yesterday.

Image

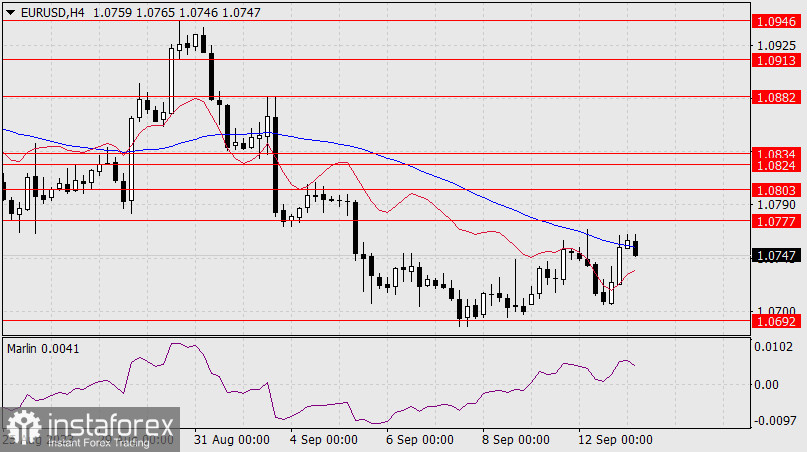
Trading volumes were substantial, indicating that there was market activity, and traders preferred to hold their positions ahead of today's European Central Bank meeting, as the probability of a rate hike stands at 68%. If investors showed an intention not to sell the euro based on US inflation data, they may buy it following the ECB meeting. The bullish target is the 1.0824/32 range. Technical convergence in action. A price above this range will open up the target of 1.0882. The MACD line is approaching this level.

Image

On the 4-hour chart, the price is between the balance and MACD indicator lines. The Marlin oscillator is currently holding an uptrend. A waiting mode is likely until the ECB announces its rate decision.

Analysis are provided by InstaForex.

Read More https://ifxpr.com/45RGA63
Best regards, PR Manager

Learn more about InstaForex Company at http://instaforex.com
IFX Gertrude
 
Posts: 5088
Joined: Wed Nov 07, 2012 6:25 am

Re: Instaforex Analysis

Postby IFX Gertrude » Fri Sep 15, 2023 12:35 am

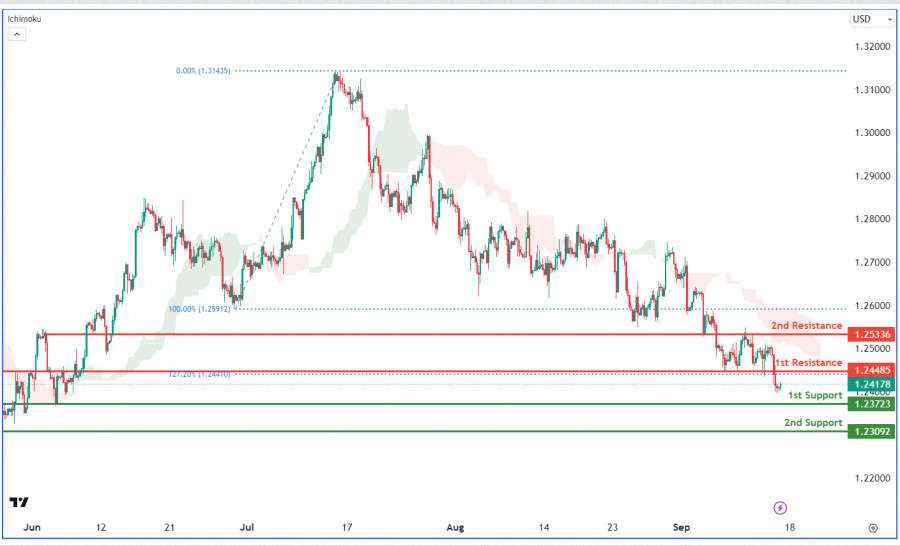
GBPUSD H4 | Bearish Continuation Expected?

Image

The GBP/USD chart currently shows a bearish momentum due to trading below the bearish Ichimoku cloud. This could lead to a continued bearish movement towards the significant 1st support level at 1.2372, which is marked as an overlap support. Additionally, the 2nd support at 1.2309 is recognized as a swing low support.

On the resistance side, the 1st resistance level at 1.2448 is a pullback resistance, possibly hindering upward movement. The 2nd resistance at 1.2533 is an overlap resistance, suggesting its potential as a point of reversal or resistance.

Analysis are provided by InstaForex.

Read More https://ifxpr.com/3EK4zbm
Best regards, PR Manager

Learn more about InstaForex Company at http://instaforex.com
IFX Gertrude
 
Posts: 5088
Joined: Wed Nov 07, 2012 6:25 am

Re: Instaforex Analysis

Postby IFX Gertrude » Mon Sep 18, 2023 12:24 am

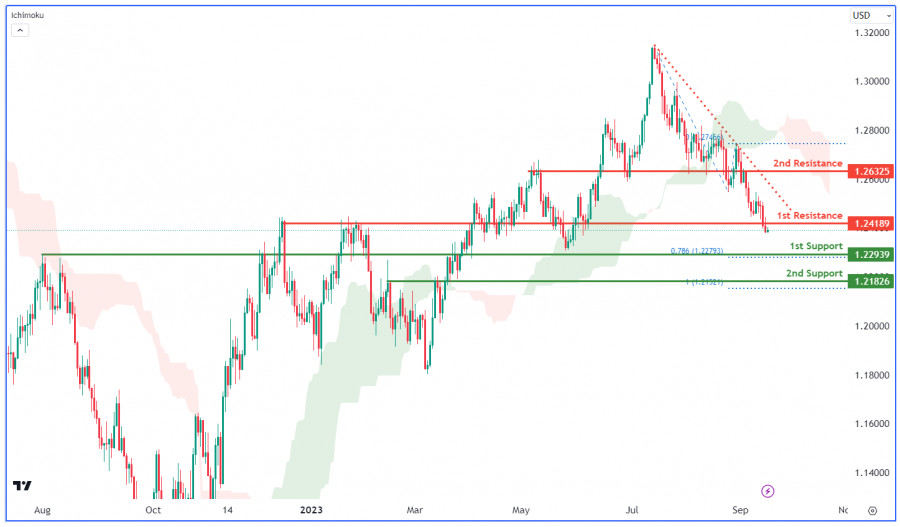
GBPUSD Day | Bearish Continuation Expected?

Image

The GBP/USD chart displays a dominant bearish trend, emphasized by its position below the bearish Ichimoku cloud and a descending trend line. Key supports stand at 1.2293, backed by the 78.60% Fibonacci Projection, and 1.2182, aligned with the 100% Fibonacci Projection. Resistances are identified at 1.2418 and 1.2632, with the latter being an overlap resistance. The overall outlook remains bearish.

Analysis are provided by InstaForex.

Read More https://ifxpr.com/3PHlotS
Best regards, PR Manager

Learn more about InstaForex Company at http://instaforex.com
IFX Gertrude
 
Posts: 5088
Joined: Wed Nov 07, 2012 6:25 am

Re: Instaforex Analysis

Postby IFX Gertrude » Tue Sep 19, 2023 12:52 am

Forecast for GBP/USD on September 19, 2023

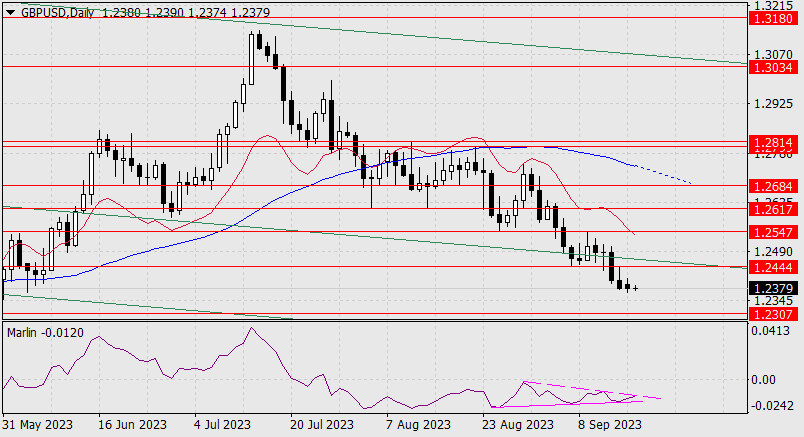
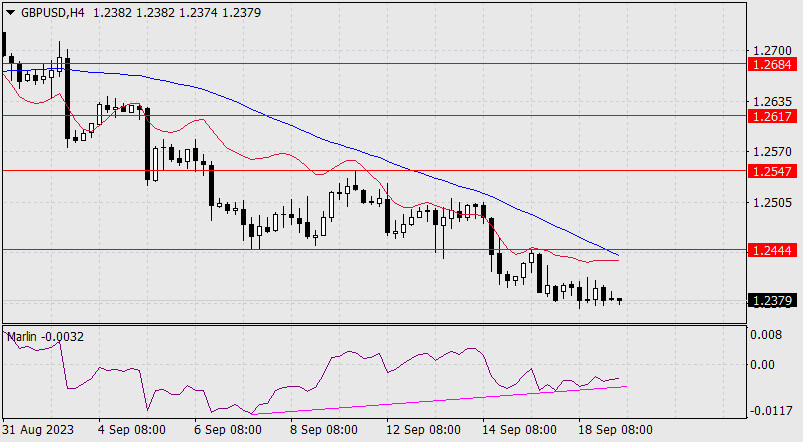
The British pound closed Monday at the same level as Friday's closing level. The Marlin oscillator rose, reinforcing the double convergence with the price. We can see that the signal line of the oscillator is converging into a wedge, and an upward exit (most likely) from it will fuel the price growth.

Image

The nearest bullish target is 1.2547, followed by 1.2617. The third target is 1.2684. The MACD indicator line is approaching this level.

Image

On the 4-hour chart, we see a build up in the convergence. A break above 1.2444 will also correspond to Marlin's move into the bullish territory. Such a pattern will support the pound. We await the results of tomorrow's Federal Reserve meeting.

Analysis are provided by InstaForex.

Read More https://ifxpr.com/3ZuRtbJ
Best regards, PR Manager

Learn more about InstaForex Company at http://instaforex.com
IFX Gertrude
 
Posts: 5088
Joined: Wed Nov 07, 2012 6:25 am

Re: Instaforex Analysis

Postby IFX Gertrude » Wed Sep 20, 2023 1:15 am

Forex Analysis & Reviews: Technical Analysis of Intraday Price Movement of USD/CAD Commodity Currency Pairs, Wednesday, September 20 2023

Image

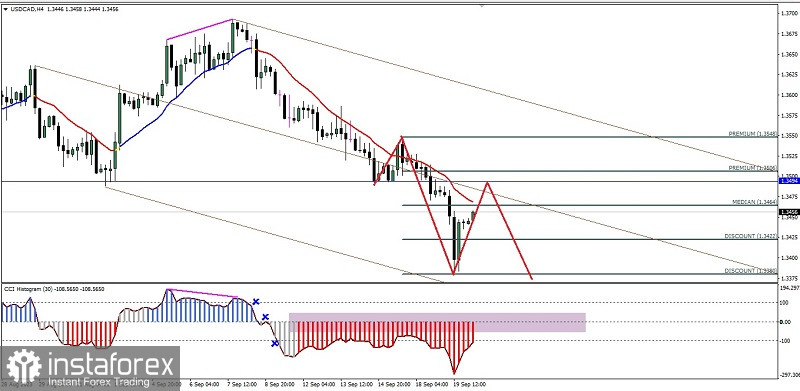
From the 4-hour chart of The Lonnie, it can be clearly seen that Sellers are very dominant, this can be seen from the price movement which moves regularly and harmoniously in the Pitchfork channel which dips downwards and the price movement is below the WMA (20) with a downward sloping slope as well as the CCI indicator has succeeded breaking below the three main levels (100, 0, & -100), but currently it appears that USD/CAD is being corrected upwards to test the SBR (support Become Resistance) level at the level 1.3494. As long as this upward correction does not breaks and close above the level 1.3550, then USD/CAD has the potential to continue its decline back to level 1.3422 as the main target and level 1.3380 as the second target if momentum and volatility support it.

Analysis are provided by InstaForex.

Read More https://ifxpr.com/3LtYp30
Best regards, PR Manager

Learn more about InstaForex Company at http://instaforex.com
IFX Gertrude
 
Posts: 5088
Joined: Wed Nov 07, 2012 6:25 am

Re: Instaforex Analysis

Postby IFX Gertrude » Thu Sep 21, 2023 1:48 am

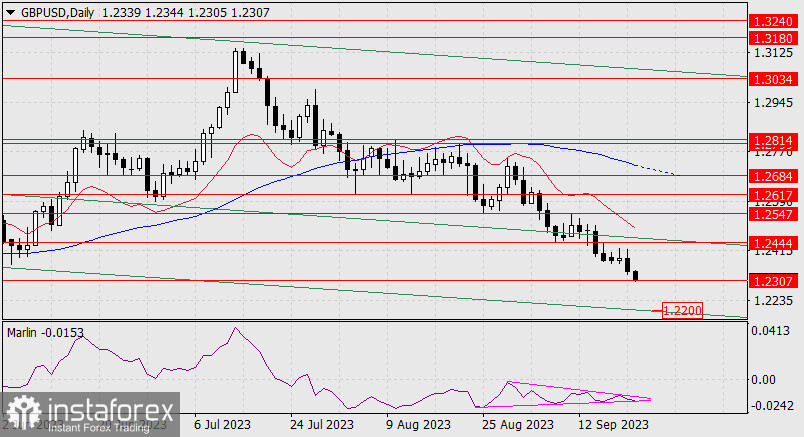
Forex Analysis & Reviews: Forecast for GBP/USD on September 21, 2023

GBP/USD
This morning, the British pound reached the target support level of 1.2307. It took 5 days for it to move from the previous level of 1.2444. During this time, the Marlin oscillator's signal line has compressed even further into a wedge and is ready to break out of it today. If it breaks below, the first target will be the embedded price channel line at 1.2200. Then the second target will be 1.2070, which is nearly in line with the May 2020 low.

Image

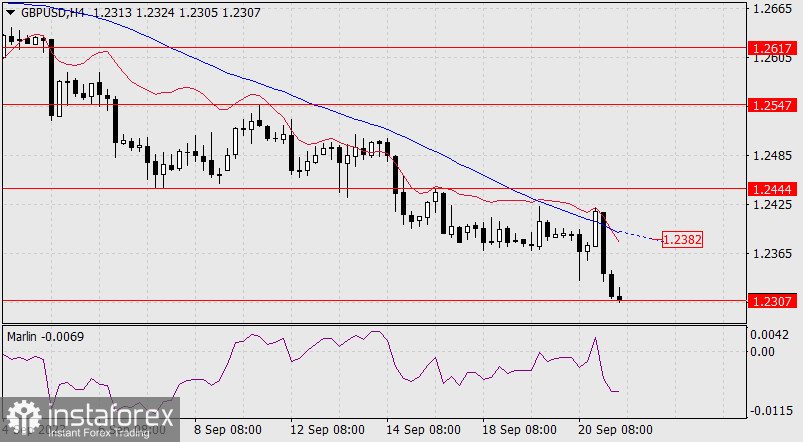
Today, the Bank of England may raise the rate from 5.25% to 5.50% (market expectations), so Marlin could break above the wedge. If we witness a solid momentum and the price consolidates above 1.2444, it will continue to rise to the next target at 1.2547. This would mark a return to the bullish scenario towards the MACD line at 1.2684.

Image

Analysis are provided by InstaForex.

Read More https://ifxpr.com/3Lw09c0
Best regards, PR Manager

Learn more about InstaForex Company at http://instaforex.com
IFX Gertrude
 
Posts: 5088
Joined: Wed Nov 07, 2012 6:25 am

Re: Instaforex Analysis

Postby IFX Yvonne » Fri Sep 22, 2023 5:56 am

Forecast for GBP/USD on September 22, 2023

GBP/USD:
Yesterday, the British pound fell short of reaching the support line of the price channel. On the daily chart, the Marlin oscillator's signal line is breaking out of the wedge and moving downwards, so the price could test the support around the 1.2200 level. However, we do not expect a deep fall, as the oscillator's wedge has been fully formed, reaching its peak, and is gradually transforming into a horizontal trend.

Image


A reversal towards the bullish line of the price channel could likely occur from the price channel line at 1.2200, as it aims to rise toward the target level of 1.2444. The Bank of England's decision to leave the interest rate at 5.25%, instead of the expected increase to 5.50%, did not have a significant impact on the British pound. The expected rise has been postponed for now.


Image

On the 4-hour chart, the price is falling below both indicator lines, and Marlin is gradually moving deeper into the downtrend. The first sign of a bullish correction would be the price closing above 1.2307. After that, the price will need to overcome the MACD line at 1.2354, which would then open the path to the target at 1.2444.

*The market analysis posted here is meant to increase your awareness, but not to give instructions to make a trade.


Analysis are provided by InstaForex.

Read More
Best Regards,
PR Manager
InstaForex Companies Group
User avatar
IFX Yvonne
 
Posts: 286
Joined: Sat Mar 02, 2013 12:23 am

Re: Instaforex Analysis

Postby IFX Gertrude » Mon Sep 25, 2023 12:50 am

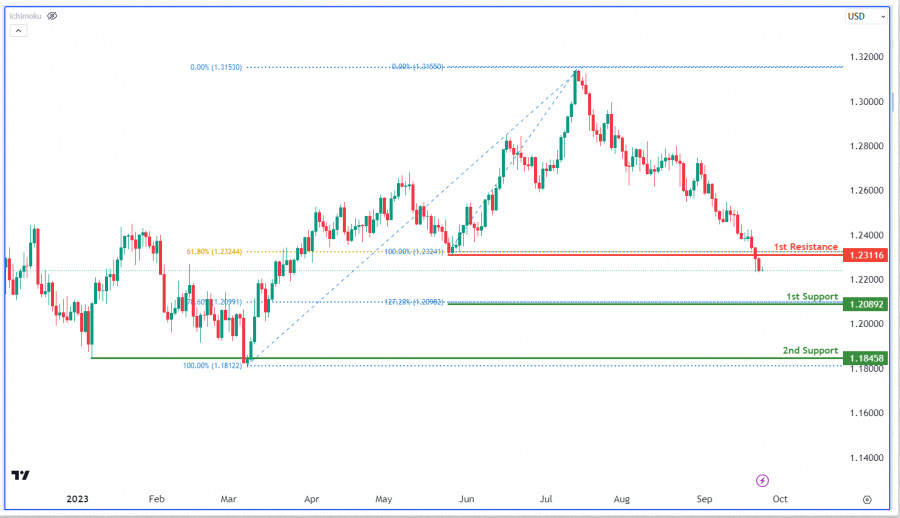
GBPUSD Day | Bouncing off support?

Image

The GBP/USD chart shows a bearish trend, with focus on the 1st support at 1.2089, significant due to the convergence of the 127.20% Fibonacci Extension and the 78.60% Fibonacci Retracement. The 2nd support is at 1.1845, a historical swing low. On the resistance side, the 1st resistance is at 1.2311, a pullback resistance aligned with the 61.80% Fibonacci Retracement, serving as a potential barrier.

Analysis are provided by InstaForex.

Read More https://ifxpr.com/3Q0B3oB
Best regards, PR Manager

Learn more about InstaForex Company at http://instaforex.com
IFX Gertrude
 
Posts: 5088
Joined: Wed Nov 07, 2012 6:25 am

PreviousNext

Return to Forex Brokers