Instaforex Analysis

Forex broker related topics and discussions

Re: Instaforex Analysis

Postby IFX Gertrude » Wed Mar 29, 2023 1:37 am

TECHNICAL ANALYSIS OF DAILY PRICE MOVEMENT OF NATURAL GAS COMMODITY ASSET, WEDNESDAY MARCH 29 2023.

Image

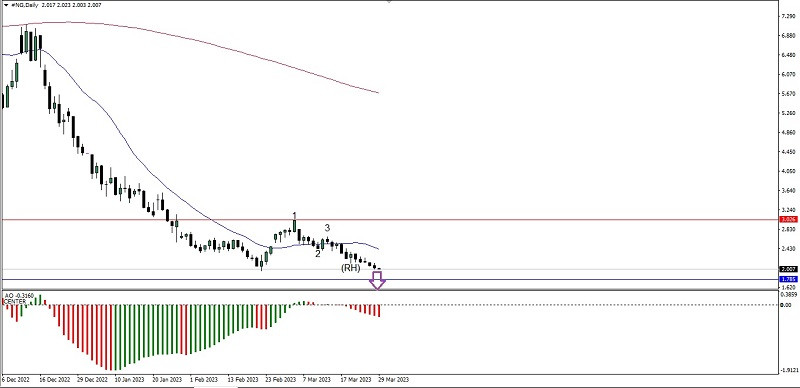
If we look on the daily chart of Natural Gas commodity asset then it will seen that both of Moving Average is on Death Cross condition as well as supported by the appearance of Bearish 123 pattern follow by Ross Hook (RH) also Awesome Oscillator indicator was on negative area so in a few days ahead, Natural Gas has the potential to depreciated down below where the level of 1,967 will try to tested to break below, as long as there is no upward correction movement which is quite significant until it breaks above the level of 2,427, Natural Gas has the potential to continue its decline to the level of 1,785.

Analysis are provided by InstaForex.

[url="https://ifxpr.com/40HmkRF"]Read More[/url]
Best regards, PR Manager

Learn more about InstaForex Company at http://instaforex.com
IFX Gertrude
 
Posts: 5198
Joined: Wed Nov 07, 2012 6:25 am

Re: Instaforex Analysis

Postby IFX Gertrude » Thu Mar 30, 2023 1:58 am

FORECAST FOR GBP/USD ON MARCH 30, 2023

Yesterday, the pound, as well as other world currencies (especially the yen), refused to reach technical levels and turned down instead. The pound lost 27 pips, giving up the 1.2420 target. However, this level is very strong, and testing it while the market is neutral is unlikely to provide the pound with more prospects.

Image

Now, the price can overcome the support level at 1.2278 and go down to 1.2155 to assess the new balance of power, as it is the middle of the range since mid-December 2022.

Image

On the four-hour chart, the Marlin oscillator signal line is entering the downtrend area. The price is approaching the support level at 1.2278. The MACD line reached this support level, i.e. these lines coincide on different scales. And if so, a breakthrough of the support will have a strong subsequent impact on the price.

Analysis are provided by InstaForex.

Read More https://ifxpr.com/3JW3srp
Best regards, PR Manager

Learn more about InstaForex Company at http://instaforex.com
IFX Gertrude
 
Posts: 5198
Joined: Wed Nov 07, 2012 6:25 am

Re: Instaforex Analysis

Postby IFX Gertrude » Fri Mar 31, 2023 1:38 am

FORECAST FOR AUD/USD ON MARCH 31, 2023

The Australian dollar broke through the upper limit of the neutral range that started back on March 17. AUD climbed out of this range this morning.

Image

It could fall to the lower limit of the range, like it did on the 23rd, but the ascending Marlin oscillator creates an advantage for the growth option, at first to 0.6790 and then, under the favorable circumstances, to 0.6873.

Image

On the four-hour chart, the price is in an active position to rise above the indicator lines, the Marlin is growing at an even angle, with an optimal speed to enter the overbought zone. After consolidating above 0.6730, we can expect the price to rise further. However, this plan can potentially be hindered by the price breaking through the MACD line, below the 0.6693 mark.

Analysis are provided by InstaForex.

Read More https://ifxpr.com/3G5e6ed
Best regards, PR Manager

Learn more about InstaForex Company at http://instaforex.com
IFX Gertrude
 
Posts: 5198
Joined: Wed Nov 07, 2012 6:25 am

Re: Instaforex Analysis

Postby IFX Gertrude » Mon Apr 03, 2023 1:50 am

XAUUSD, DAY | POTENTIAL BREAKOUT 1ST SUPPORTL?

Image

Gold (XAU/USD) has been exhibiting a bullish trend, with an overall momentum that is also bullish. Based on the chart, the price has the potential to make a bullish rebound off the first support level and then move towards the first resistance.

The first support level, which is at 1948.51, is a strong overlap support level that has been tested multiple times and has acted as a support level in the past. Therefore, it is a good level for a potential bounce.

Another support level is located at 1881.07, which is also an overlap support level. It has been tested several times and has held as a support level, making it another level for a potential bounce.

Meanwhile, the first resistance level at 2000.00 is a multi-swing high resistance level that has been significant in the past. Additionally, it is located at the 127.20% Fibonacci Extension level, which provides additional confluence to the level.

Another resistance level is at 2070.00, which is a swing high resistance level. This level has also been important in the past, making it another level for traders to observe.

Analysis are provided by InstaForex.

Read More https://ifxpr.com/3ZAKGM0
Best regards, PR Manager

Learn more about InstaForex Company at http://instaforex.com
IFX Gertrude
 
Posts: 5198
Joined: Wed Nov 07, 2012 6:25 am

Re: Instaforex Analysis

Postby IFX Gertrude » Tue Apr 04, 2023 12:36 am

FORECAST FOR EUR/USD ON APRIL 4, 2023

The euro changed its bearish mood on Friday, and jumped by 120 pips on Monday from the low of the day, from the support of the target level, or more precisely, the upper limit of the target range of 1.0758/87. The price is consolidating above the MACD indicator line below the upper limit of the green price channel. Climbing above the 1.0930 reference level will make 1.0990 the next target.

Image

Bears, if they don't want to give up easily and have control of the situation, must consolidate under the MACD line on the daily chart, below 1.0867. In this case, a divergence with the Marlin oscillator will unfold, and simultaneously, the signal line of the oscillator will leave the wedge and move down. The price will move towards the range of 1.0758/87.

On the four-hour chart, a double divergence of the price with the oscillator has already been formed. This is an effective sign of a reversal, but it's not enough. In the current conditions, the price needs to cross the support of the MACD line, around 1.0857, which is 10 pips below the MACD line on the daily chart. We have to wait what scenario the market will choose in the near future.

Image

Analysis are provided by InstaForex.

Read More https://ifxpr.com/437gOd5
Best regards, PR Manager

Learn more about InstaForex Company at http://instaforex.com
IFX Gertrude
 
Posts: 5198
Joined: Wed Nov 07, 2012 6:25 am

Re: Instaforex Analysis

Postby IFX Gertrude » Wed Apr 05, 2023 4:30 am

FORECAST FOR EUR/USD ON APRIL 5, 2023

The euro has chosen growth, at least soon. The EUR/USD exchange rate increased by 56 points yesterday. The price maintains its pursuit of the target level of 1.1033 – reaching its peak on February 2. Consolidation above the level will enable the target of 1.1185 — the maximum for March 2022 and the same minimum for November 2021 — to be reached.

Image

Today, the United States will release March data on private, non-agricultural employment and the ISM Services PMI. ADP Non-Farm and ISM Services PMI are anticipated to decrease: ADP Non-Farm from 242 thousand to 200/208 thousand and ISM Services PMI from 55.1 to 54.5/3.

Image

On the four-hour chart, the price is rising above the indicator lines, the Marlin oscillator is in the rising trend zone, and there are no indications of a price reversal.

Analysis are provided by InstaForex.

Read More https://ifxpr.com/3KAfQim
Best regards, PR Manager

Learn more about InstaForex Company at http://instaforex.com
IFX Gertrude
 
Posts: 5198
Joined: Wed Nov 07, 2012 6:25 am

Re: Instaforex Analysis

Postby IFX Gertrude » Thu Apr 06, 2023 12:57 am

FORECAST FOR EUR/USD ON APRIL 6, 2023

On Wednesday, the euro fell by 49 points, showing an intention to turn down in the short or medium term. However, this behavior has signs of a false movement.

Image

There is no price divergence with the Marlin oscillator on the daily chart, which is rare for the saw-toothed movement of the oscillator signal line. There may be another final surge of the oscillator and the price, even if it doesn't reach the target level of 1.1033. At least (while there is no divergence), the price should settle below the MACD indicator line to create a sign of reversal, and that will take at least a day. If the bears succeed, the price will move to the target range of 1.0758/87. Meanwhile, the price can still try to overcome the April 4 high.

Image

On the four-hour chart, the price falls below the MACD line, but the main support is the line of the higher chart (1.0872). The Marlin oscillator is already in the area of the downtrend, but there can also be a breakthrough.

Analysis are provided by InstaForex.

Read More https://ifxpr.com/3GlvGeq
Best regards, PR Manager

Learn more about InstaForex Company at http://instaforex.com
IFX Gertrude
 
Posts: 5198
Joined: Wed Nov 07, 2012 6:25 am

Re: Instaforex Analysis

Postby IFX Gertrude » Fri Apr 07, 2023 2:00 am

FORECAST FOR GBP/USD ON APRIL 7, 2023

Yesterday, the pound reached a strong support level at 1.2422, which turned out to be an insurmountable resistance for the price in the second half of January. Now, if the pair crosses this level, the first target will be the MACD line at 1.2298, and after correcting the price may fall to 1.2155.

Image

If the 1.2422 level is so strong that even good U.S. jobs data, if it is available today, will not be able to help the price to overcome it, the pair is likely to reverse to the target level of 1.2598. In this case, the signal line of the Marlin oscillator will climb from its own consolidation.

Image

On the four-hour chart, the 1.2422 level is reinforced by the MACD indicator line. And even though the Marlin oscillator is already in negative territory, it can reluctantly follow the price in case it rises. It is a holiday in Europe, and the only driver may be the U.S. employment data. Let's wait for the report and see how things unfold.

Analysis are provided by InstaForex.

Read More https://ifxpr.com/3nJymfa
Best regards, PR Manager

Learn more about InstaForex Company at http://instaforex.com
IFX Gertrude
 
Posts: 5198
Joined: Wed Nov 07, 2012 6:25 am

Re: Instaforex Analysis

Postby IFX Gertrude » Mon Apr 10, 2023 3:28 am

BTCUSD, Daily | Potential reversal from 1st resistance?

Image

The BTC/USD chart currently reflects a bearish momentum in the cryptocurrency market, and Bitcoin seems to be following the trend. The chart suggests that the price of Bitcoin could face resistance at the 1st resistance level of 28343, which has previously been an important level as an overlap resistance. If Bitcoin fails to break through this level, it may result in a bearish reaction causing the price to drop towards the 1st support level of 25249. This level, being a pullback support, could act as a strong support for the price of Bitcoin.

In the event that the price of Bitcoin breaks through the 1st resistance level, the next resistance level it could face is the 2nd resistance level of 32843, which is a pullback resistance. Conversely, if Bitcoin breaks below the 1st support level, the next support level it could drop to is the 2nd support level of 23925. This level, also being a pullback support, could potentially act as a strong support for the price of Bitcoin.

Additionally, there is an intermediate support level at 26598, which is a swing low support and is accompanied by a 23.60% Fibonacci retracement. This level could potentially provide support to the price of Bitcoin if it drops towards the 1st support level. Overall, the BTC/USD chart's momentum is bearish, indicating that the price is expected to continue falling in the near term.

Analysis are provided by InstaForex.

Read More https://ifxpr.com/3nVZyaK
Best regards, PR Manager

Learn more about InstaForex Company at http://instaforex.com
IFX Gertrude
 
Posts: 5198
Joined: Wed Nov 07, 2012 6:25 am

Re: Instaforex Analysis

Postby IFX Gertrude » Tue Apr 11, 2023 2:33 am

USDJPY, H4 | Potential reversal from 1st resistance?

Image

The current momentum of the USD/JPY chart is bearish, indicating a potential price drop in the near future. A significant resistance level to watch is at 133.76, which is a strong pullback resistance level and coincides with the 78.60% Fibonacci projection. If the price reacts bearishly at this level, it may potentially fall towards the first support at 131.81. This support level is an overlap support and also lines up with the 61.80% Fibonacci retracement level, making it a significant level for a potential price rebound.

If the price breaks below the first support, it may fall towards the second support at 130.53, which is also an overlap support level. However, if the price breaks above the first resistance, it may potentially rise towards the second resistance at 134.08. This is an overlap resistance level and also has the 61.80% Fibonacci retracement level lining up with it, making it a significant level to watch.

Analysis are provided by InstaForex.

Read More https://ifxpr.com/3mlATMr
Best regards, PR Manager

Learn more about InstaForex Company at http://instaforex.com
IFX Gertrude
 
Posts: 5198
Joined: Wed Nov 07, 2012 6:25 am

PreviousNext

Return to Forex Brokers