Point and Figure for Forex. Any pair.Charts.

Start your personal journal and share your trading results and experience

Re: Point and Figure for Forex. Any pair.Charts.

Postby MDunleavy » Mon Jun 18, 2012 5:33 am

---Crude Oil Weekly P&F Technical Outlook.
...Crude Oil Maintains The Upside Bias.OPEC decision was so helpful for crude pushing it up to the top of the range that is expected to remain among it $80-$85, as the commodity is trading now around $84.66. But how long the upside momentum will last as the Greek elections at the door and no one knows how results will come. In fact, central bankers seem to be more mature than the market speculated before, as they stand ready to stabilize financial markets in a coordinated action to provide liquidity if the Greek elections on Sunday cause a mess in the market....[by oilngold]
Image
Learn more! ↓↓↓
Code: Select all
https://docs.google.com/spreadsheet/pub?key=0AhxKzvQ2GlM8dDBqYWl6XzlEbFZDWFVob0FMbG9nbGc&output=html

See also:
~~~>docs.google.com/open?id=0B9cvIxidsTjvQ2VmWU5xUk96alE
^^^ORvvv
~~~>img717.imageshack.us/img717/6808/12jun17.pdf
^^^ORvvv
A d d i t i o n a l l y ↑↑↑
FOREX MetaTrader Expert Advisors
Point & Figure :) :( Chart in Forex
User avatar
MDunleavy
 
Posts: 284
Joined: Fri Oct 30, 2009 1:43 am

Re: Point and Figure for Forex. Any pair.Charts.

Postby MDunleavy » Sun Jun 24, 2012 3:37 pm

--The USD/JPY pair shot straight up during the week as the dollar found its footing against most currencies for the week.
--The 80 handle continues to be the epicenter of resistance for our money, and has still price down.
--The level won’t be considered broken out of it until we cross and close above the 80.50 level.
--This area is a clear top to the resistance area on the daily charts.
--Because of this, we are not ready to go along yet but believe that a break of the top of this week’s candle would be an excellent buy signal.
--As for selling, we are looking to do that now. [By FX Empire Analyst]
Image
> > Click to learn more! < < ↓↓↓
Code: Select all
>>https://docs.google.com/spreadsheet/pub?key=0AhxKzvQ2GlM8dDBqYWl6XzlEbFZDWFVob0FMbG9nbGc&output=html<<
>>https://docs.google.com/open?id=0B9cvIxidsTjvdktmX0NlcnJWMHM<<
>>http://img401.imageshack.us/img401/9310/12jun24.pdf<<

A d d i t i o n a l l y ↑↑↑
FOREX MetaTrader Expert Advisors
Point & Figure :) :( Chart in Forex
User avatar
MDunleavy
 
Posts: 284
Joined: Fri Oct 30, 2009 1:43 am

Re: Point and Figure for Forex. Any pair.Charts.

Postby MDunleavy » Sun Jul 08, 2012 11:08 pm

The Dollar Index (DXY), which Intercontinental Exchange Inc. uses to track the greenback against the currencies of six major U.S. trade partners including the euro and the yen, advanced 2 percent, the most since December, to 83.285. It touched 83.431, the highest level since June 1.
==================================
Dollar Index [DXY]: This forum had the conviction to be a $ bull for the last 1 year or so when all expert commentary was bearish on the currency. The buck hasn’t disappointed by its performance either, having rallied from 73.26 in May 2011 to a close of 82.9420 last week, just under its previous high at 83.6700. Can the $ rally higher?
Image
> > Learn more! < < ↓↓↓
Code: Select all
>>https://docs.google.com/spreadsheet/pub?key=0AhxKzvQ2GlM8dDBqYWl6XzlEbFZDWFVob0FMbG9nbGc&output=html<<
>>https://docs.google.com/open?id=0B9cvIxidsTjvMVFhZzFydUxfa3M<<
>>http://img195.imageshack.us/img195/2825/12jul07.pdf<<

A d d i t i o n a l l y ↑↑↑
FOREX MetaTrader Expert Advisors
Point & Figure :) :( Chart in Forex
User avatar
MDunleavy
 
Posts: 284
Joined: Fri Oct 30, 2009 1:43 am

Re: Point and Figure for Forex. Any pair.Charts.

Postby MDunleavy » Mon Jul 16, 2012 2:15 pm

--EUR/USD Weekly Outlook and Trading Idea Outlook:
--As expected EUR/USD continued lower and almost reached the 1.2145 Fibonacci level (the low recorded last week was 1.2163).
--Now, despite the Friday's bounce, the daily chart remains very negative and I expect further weakness.
--We may see some choppy sideways action first (most likely between 1.2145 and 1.2345) because the market has become quite oversold.
--Only a rise abv 1.2430/40 will negate the immediate bearish outlook and will risk larger recovery twd 1.2670 before the downtrend from the May 2011 top resumes....
--Strategy: Holding short from 1.2600 is favored. Stop=1.2450. [By ibtimes]
Image
> > Learn more! < <
Code: Select all
https://docs.google.com/spreadsheet/pub?key=0AhxKzvQ2GlM8dDBqYWl6XzlEbFZDWFVob0FMbG9nbGc&output=html

See also ↓↓↓
~~~>_https://docs.google.com/open?id=0B9cvIxidsTjvbTVST0hIWGVmVkk
^^^ORvvv
~~~>_http://img694.imageshack.us/img694/7990/12jul15.pdf
^^^ORvvv
A d d i t i o n a l l y ↑↑↑
FOREX MetaTrader Expert Advisors
Point & Figure :) :( Chart in Forex
User avatar
MDunleavy
 
Posts: 284
Joined: Fri Oct 30, 2009 1:43 am

Re: Point and Figure for Forex. Any pair.Charts.

Postby MDunleavy » Mon Jul 23, 2012 10:27 am

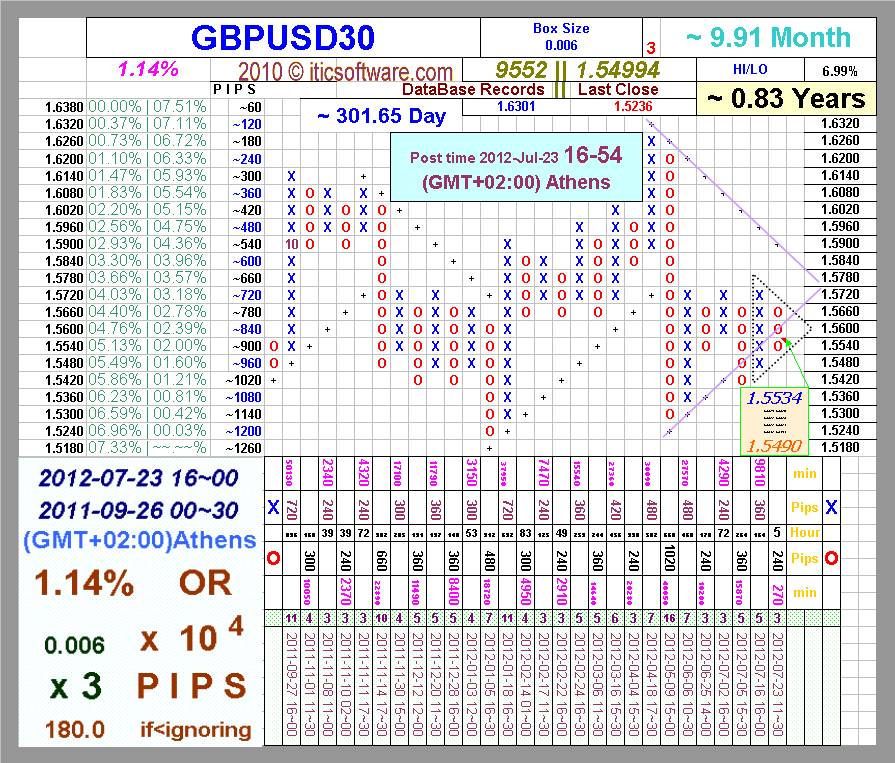
–Please note that overall GBP/USD has been in a very volatile sideways mode since January 2009.
–A break below 1.5269 and then the low of January 13th i.e.
–1.5233 may indicate a break below the lower support line.
–Please check this weekly chart of GBP/USD.
–Strategies for Trading GBP/USD (British Pound-Dollar): s mentioned above, our overall outlook for GBP/USD stays bearish but initially we stay neutral to expect some volatile sideway moves and even the possibilities of some further upward consolidation can’t be ignored.
–We are avoiding longs for GBP/USD right now, considering the overall bearish outlook.
–As mentioned above, initially we will be watching for the breaks of mentioned resistance and supports for the next week's trade decisions.
– [By forexabode.]
Image
Code: Select all
https://docs.google.com/spreadsheet/pub?key=0AhxKzvQ2GlM8dDBqYWl6XzlEbFZDWFVob0FMbG9nbGc&output=html

See also ↓↓↓
~~~>_http://img16.imageshack.us/img16/6202/12jul21.pdf
^^^ORvvv
~~~>_https://docs.google.com/open?id=0B9cvIxidsTjvdlFOalNHS3c3bnM
^^^ORvvv
A d d i t i o n a l l y ↑↑↑
FOREX MetaTrader Expert Advisors
Point & Figure :) :( Chart in Forex
User avatar
MDunleavy
 
Posts: 284
Joined: Fri Oct 30, 2009 1:43 am

Re: Point and Figure for Forex. Any pair.Charts.

Postby MDunleavy » Wed Aug 01, 2012 12:25 am

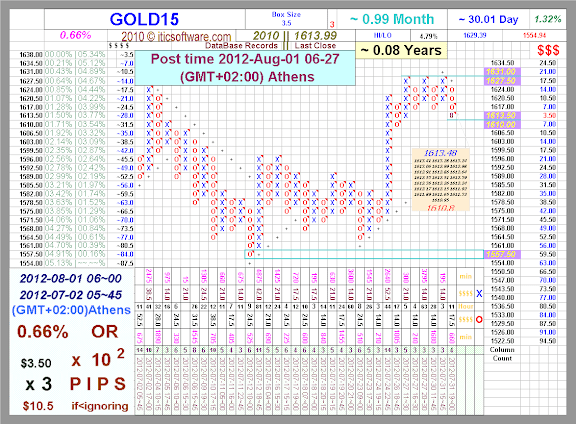
-GOLD: Although GOLD rallied sharply to close higher the past week, it remains trapped in a range between the 1,544.35 and the 1,640.45 levels.
-In order for the commodity to extend its upside it will have to break and hold above the 1,640.45 level, its range top.
-This if seen will open up further upside towards the 1,670.70 level and then the 1,700.00 level.
-Its weekly RSI is bullish and pointing higher suggesting further strength.
-The alternative scenario will be for the commodity to return to the 1,546.95 level on price failure where a violation will aim at the 1,527.05 level where a breach will resume its broader medium term weakness and then pave the way for further declines towards the 1,500.00 level.
-Price hesitation could occur here but if that level gives way, expect the commodity to decline further towards 1,478.05 level.
-All in all, GOLD continues to hold on to its broader medium term downside though trading in a range[Written by FXTechStrategy]

Image
>>>Click for larger picture in new window!<<<
~~~~~~~~~~~~~~~~~~~~~~~~~~~~~~~~~~
vvv Click to learn more! vvv
Code: Select all
https://docs.google.com/spreadsheet/pub?key=0AhxKzvQ2GlM8dDBqYWl6XzlEbFZDWFVob0FMbG9nbGc&output=html

See also vvv
~~~>_https://docs.google.com/open?id=0B9cvIxidsTjvczdYMzY1eGpWbXM
^^^ORvvv
~~~>_http://img819.imageshack.us/img819/7263/12jul30.pdf
A d d i t i o n a l l y^^^
FOREX MetaTrader Expert Advisors
Point & Figure :) :( Chart in Forex
User avatar
MDunleavy
 
Posts: 284
Joined: Fri Oct 30, 2009 1:43 am

Re: Point and Figure for Forex. Any pair.Charts.

Postby MDunleavy » Mon Aug 27, 2012 5:36 am

—The Australian dollar showed some movement in both directions but was almost unchanged over the week, as AUD/USD closed at 1.0399.
—Highlights of the upcoming week include Building Approvals and Private Capital Expenditure.
—The pair continues to trade in a narrow range following mixed economic releases in both the US and Australia, as the pair showed some fluctuation but was unable to sustain any breakout.
—I am neutral on AUD/USD.
—After impressive gains this summer, the aussie has been in a holding pattern for the past few weeks.
—Given the turmoil in Europe and mixed data out of the US and Australia, the choppiness could continue.
—However, if the US economy produces more weak data and there is further talk of QE intervention, look for the Australian dollar to make some gains.[Written by forexcrunch]
Image
> > Click to learn more! < <
Code: Select all
https://docs.google.com/spreadsheet/pub?key=0AhxKzvQ2GlM8dDBqYWl6XzlEbFZDWFVob0FMbG9nbGc&output=html


See also ↓↓↓
~~~>_https://docs.google.com/open?id=0BxxKzvQ2GlM8YzEyYWE0ZDUtZjI5My00MjA3LWJkOGItYzIyZjg0NjFhMmJj
^^^ORvvv
~~~>_http://img99.imageshack.us/img99/5194/12aug27.pdf
A d d i t i o n a l l y ↑↑↑
FOREX MetaTrader Expert Advisors
Point & Figure :) :( Chart in Forex
User avatar
MDunleavy
 
Posts: 284
Joined: Fri Oct 30, 2009 1:43 am

Re: Point and Figure for Forex. Any pair.Charts.

Postby MDunleavy » Sun Sep 09, 2012 1:06 pm

–Euro/dollar had a positive week, riding on the determination of the ECB in using its firepower to counter the Spanish crisis.
–The upcoming week is even more important, with the German constitutional court’s ruling needed to enable the bailouts.
–There are quite a few additional regular indicators and special events.
–Will the rally continue?.
–I am neutral on EUR/USD.
–After the huge rally that sent the pair to the highest levels since May, there is room for some correction.
–The rise came on a better than expected ECB decision, and high hopes for QE3 in the US.
–These hopes could lead to a disappointment, countering the big steps that Europe is taking to counter the crisis.
–Written by Forexcrunch.
↓↓↓Click to learn more!↓↓↓
Code: Select all
https://docs.google.com/spreadsheet/pub?key=0AhxKzvQ2GlM8dDBqYWl6XzlEbFZDWFVob0FMbG9nbGc&output=html


Image

See also ↓↓↓
~~~>_http://img684.imageshack.us/img684/9896/12sep08.pdf
^^^ORvvv
~~~>_https://docs.google.com/file/d/0B9cvIxidsTjvSVVYaWM5N2dYQ1k/preview
A d d i t i o n a l l y ↑↑↑
FOREX MetaTrader Expert Advisors
Point & Figure :) :( Chart in Forex
User avatar
MDunleavy
 
Posts: 284
Joined: Fri Oct 30, 2009 1:43 am

Re: Point and Figure for Forex. Any pair.Charts.

Postby MDunleavy » Mon Sep 24, 2012 1:18 am

–The GBP/USD pair rose during the session on Friday and even managed to break through the 1.63 level at one point.
–However, by the end of the day we saw a pullback that formed a shooting star.
–This pair has been overbought for a while, and as such a pullback would be welcomed by many of the buyers at this point.
–We still see the 1.60 level was massively supportive at this point time, and hope that a pullback is a chance to start buying this market somewhere closer to that level.
–However, we managed to break the top of the shooting star from Friday, then of course is a massively bullish signal as well.
–Even if we do see a breakdown of price over the next day or two, we are not interested in selling as the central bank equation of this currency pair is pretty straightforward: the Federal Reserve is looking to expand its quantitative easing, and the Bank of England is looking to sit still with its rates.
–Because of this, there is a positive swapped going long this pair. [Written by fxempire]
↓↓↓ Click to learn more! ↓↓↓
Code: Select all
https://docs.google.com/spreadsheet/pub?key=0AhxKzvQ2GlM8dDBqYWl6XzlEbFZDWFVob0FMbG9nbGc&output=html

Image

See also
~~~> _https://docs.google.com/file/d/0B9cvIxidsTjvSGdHNEQwMDY5LTQ/preview
↓↓↓ ORvvv ↑↑↑
~~~> _http://img525.imageshack.us/img525/354/12sep23.pdf
A d d i t i o n a l l y
FOREX MetaTrader Expert Advisors
Point & Figure :) :( Chart in Forex
User avatar
MDunleavy
 
Posts: 284
Joined: Fri Oct 30, 2009 1:43 am

Re: Point and Figure for Forex. Any pair.Charts.

Postby MDunleavy » Mon Oct 08, 2012 12:34 am

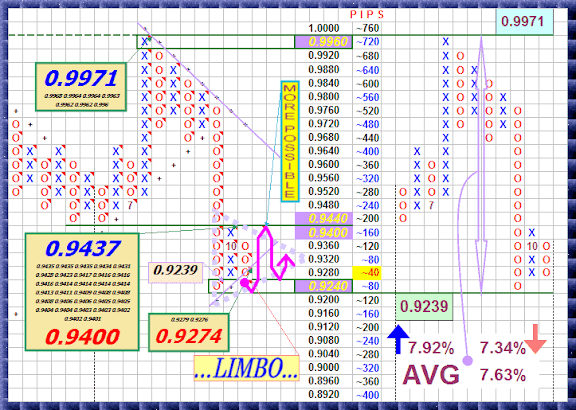
–USDCHF: With USDCHF reversing almost all of its corrective recovery gains the past week, the big risk is for it to return to the 0.9238 level.
–If this occurs in the new week, further declines will shape up towards the 0.9193 level, its May 07’2012 low with breach targeting the 0.9100 level and ultimately the 0.9000 level, its big psycho level.
–Its weekly RSI is bearish and pointing lower supporting this view.
–On the upside, it will have to return above the 0.
–9424 level to annul its current weakness and resume its bullish offensive towards its Sept 10'2012 high at 0.9482.
–A breach will open up further upside gain towards the 0.9606 level.
On the whole, the pair remains biased to the downside in the short term.
[Written by traderslaboratory]
↓↓↓ Click to learn more! ↓↓↓
Code: Select all
https://docs.google.com/spreadsheet/pub?key=0AhxKzvQ2GlM8dDBqYWl6XzlEbFZDWFVob0FMbG9nbGc&output=html

Image
See also
~~~>_https://docs.google.com/open?id=0B9cvIxidsTjvRzZvZ1pFS1N1ZGs
↓↓↓ ORvvv ↑↑↑
~~~>_http://img15.imageshack.us/img15/8383/12oct06.pdf
A d d i t i o n a l l y
FOREX MetaTrader Expert Advisors
Point & Figure :) :( Chart in Forex
User avatar
MDunleavy
 
Posts: 284
Joined: Fri Oct 30, 2009 1:43 am

PreviousNext

Return to Forex Trader Journals


cron