Forex Analysis & Reviews: Trading Recommendations and Analysis for EUR/USD on October 27. Statistics Did Not Awaken the MarketAnalysis of EUR/USD 5M
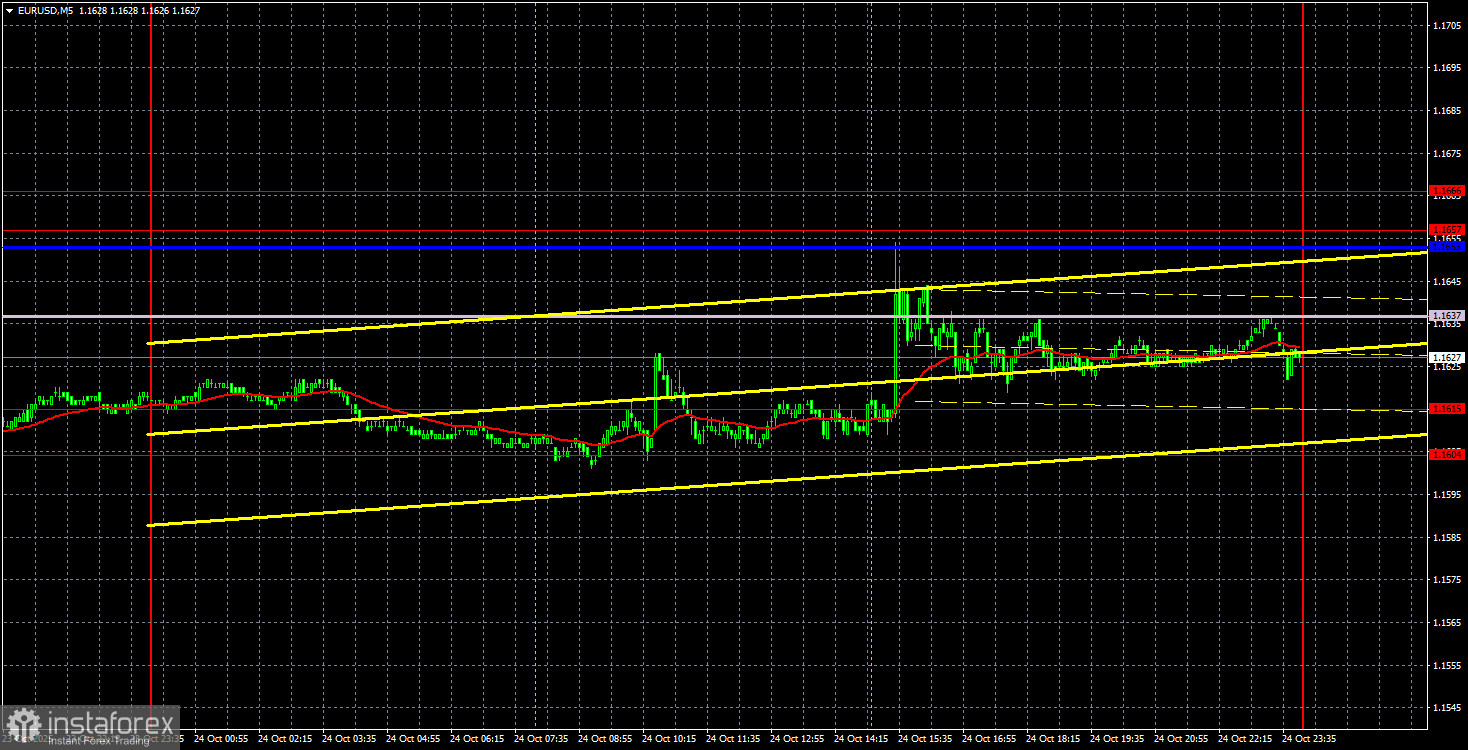
The EUR/USD currency pair traded very little on Friday. At this time, traders should focus not on macroeconomic reports or fundamental backgrounds, but on the volatility indicator and the sideways trend on the daily timeframe. The volatility indicator shows very few trades in the market now, with practically no movement. Therefore, making gains with any trading signals or macroeconomic events is extremely difficult. The sideways trend on the daily timeframe demonstrates illogical movements within a sideways channel. Thus, the fundamentals and macroeconomics do not influence the current movements of the pair. On Friday, at least four interesting reports were released in the Eurozone, and four in the United States. Eight reports in total, and the market traded with a volatility of around 40 pips. The European reports could have provided significant support to the euro, as all four business activity indices came in above forecasts, while the American reports could have weighed on the euro, as two of the most important reports were worse than expected. However, by the end of the day, the European currency had only appreciated by 10 pips. In recent weeks, numerous factors could have triggered a rise in the pair, yet all were ignored. On the 5-minute timeframe, the movements were such that identifying trading signals made little sense. Throughout the day, the price traded between the 1.1604 level and the Kijun-sen line, which we set at 1.1653, as the sideways trend is now visible on the hourly timeframe as well. Even if we do not take into account the new value of the Kijun-sen line, the range just above is 1.1657-1.1666. Trading between levels and lines with a distance of only 10 pips was impractical.
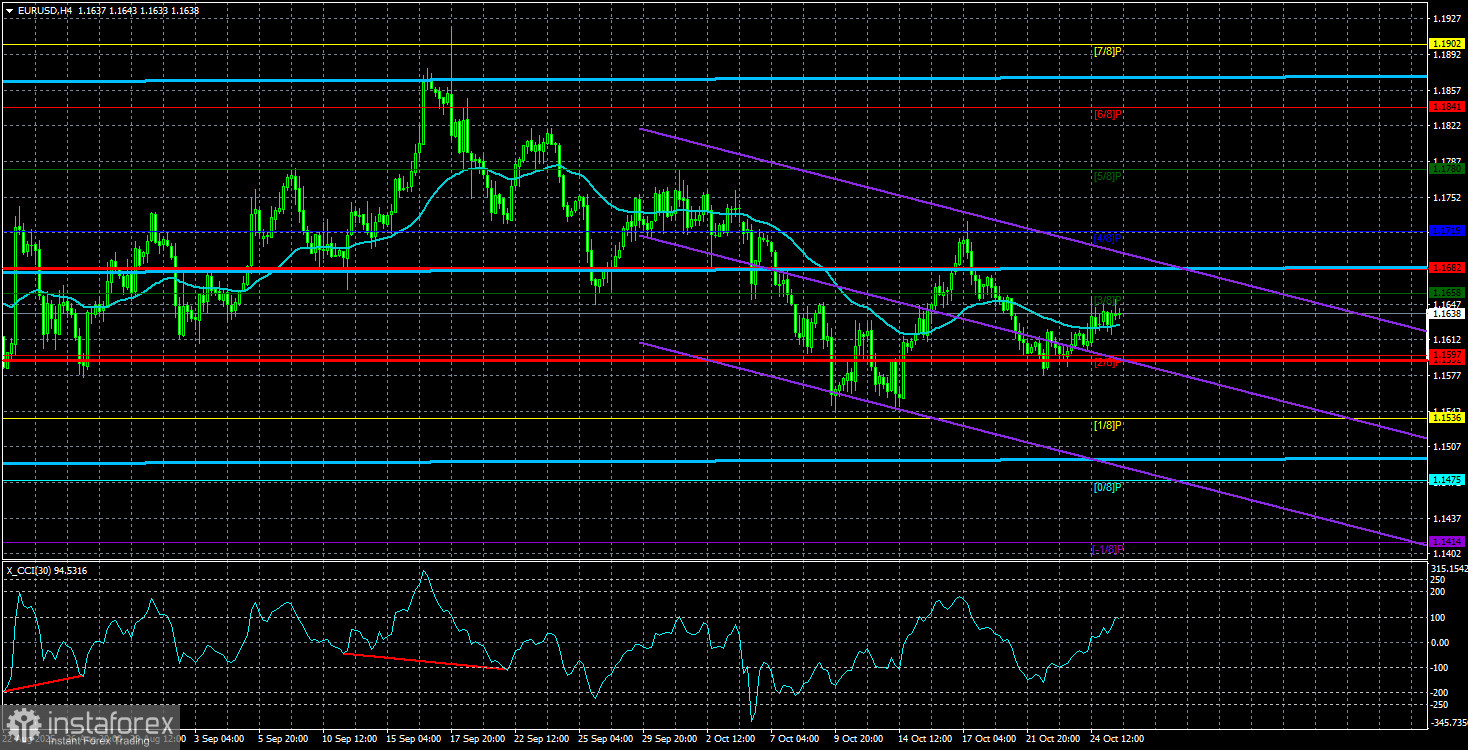
The latest COT report is dated September 23. Since then, no further COT reports have been published due to the U.S. government shutdown. The illustration above clearly shows that the net position of non-commercial traders has long been "bullish," with bears only managing to slip into a position of superiority at the end of 2024, but they quickly lost it again. Since Trump took office for the second time, the dollar has been on a downward trend. While we cannot say with 100% certainty that the decline of the U.S. currency will continue, current developments around the world suggest this outcome. We still do not see any fundamental factors supporting the strengthening of the euro, but there are enough factors for the U.S. dollar to decline. The global downtrend persists, but what significance does it have given where prices have moved over the past 17 years? Once Trump concludes his trade wars, the dollar could begin to strengthen, but recent events have shown that the conflict will continue in one form or another. The possible loss of the Federal Reserve's independence is another strong pressure factor on the U.S. currency. The indicator's red and blue lines continue to signal a "bullish" trend. During the last reporting week, the number of longs in the "Non-commercial" group decreased by 800, while shorts increased by 2,600. Consequently, the net position decreased by 3,400 contracts over the week. However, this data is already outdated and holds little significance.
Analysis of EUR/USD 1H
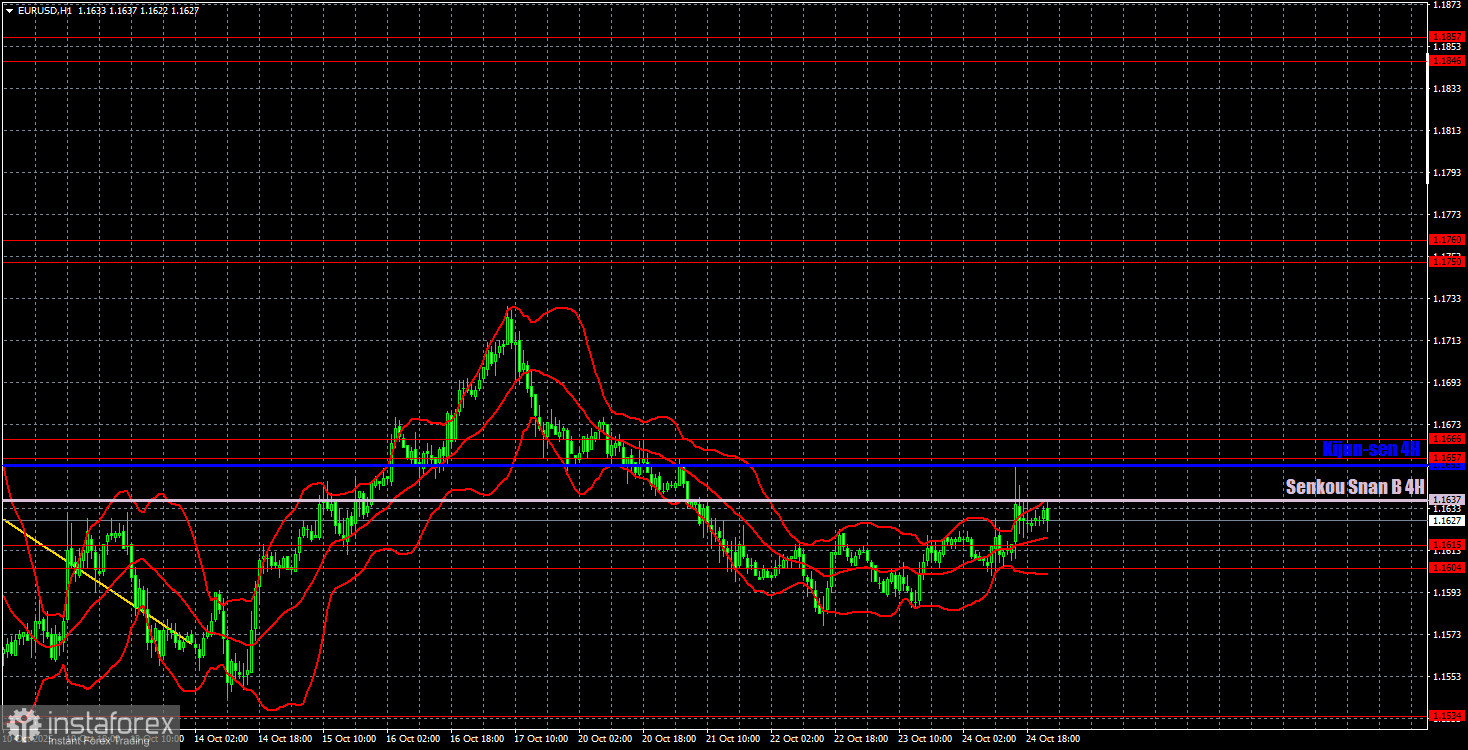
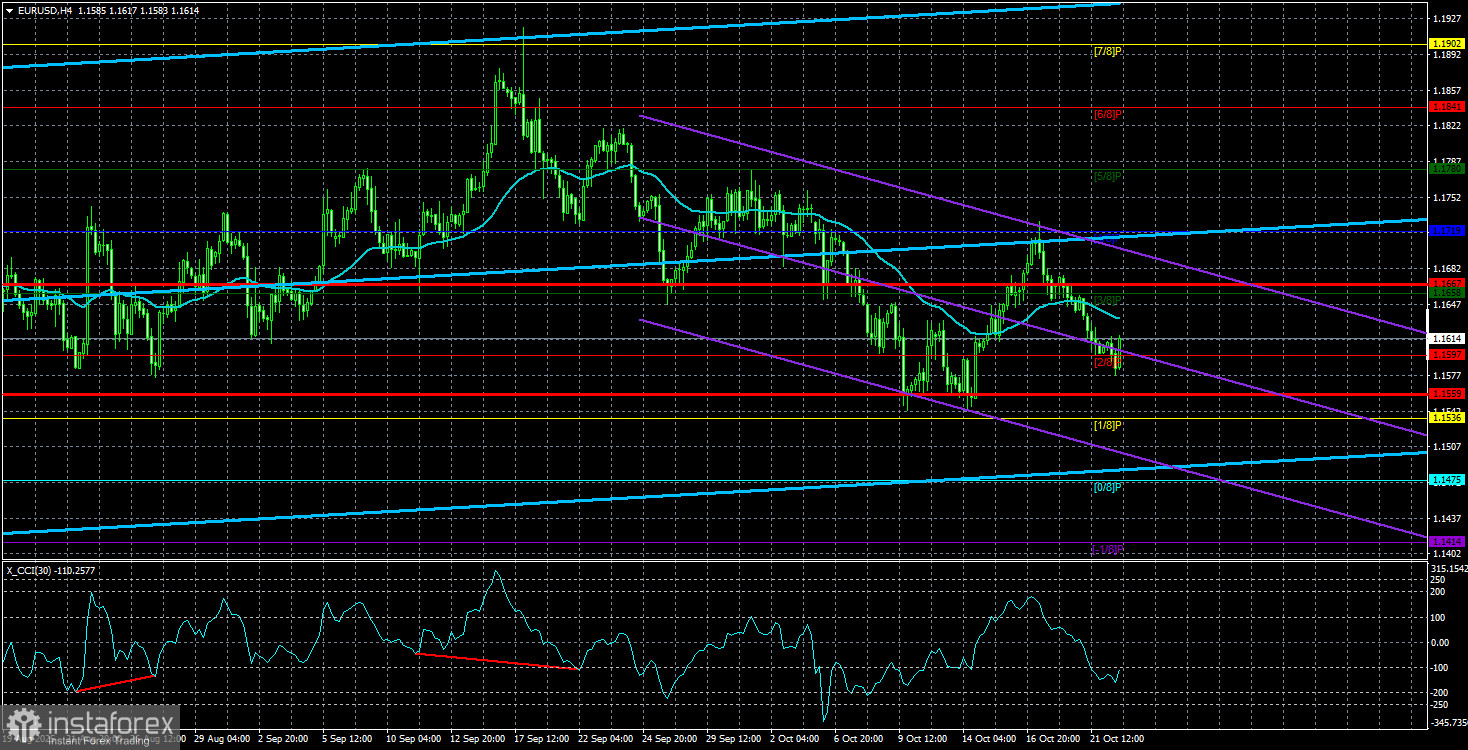
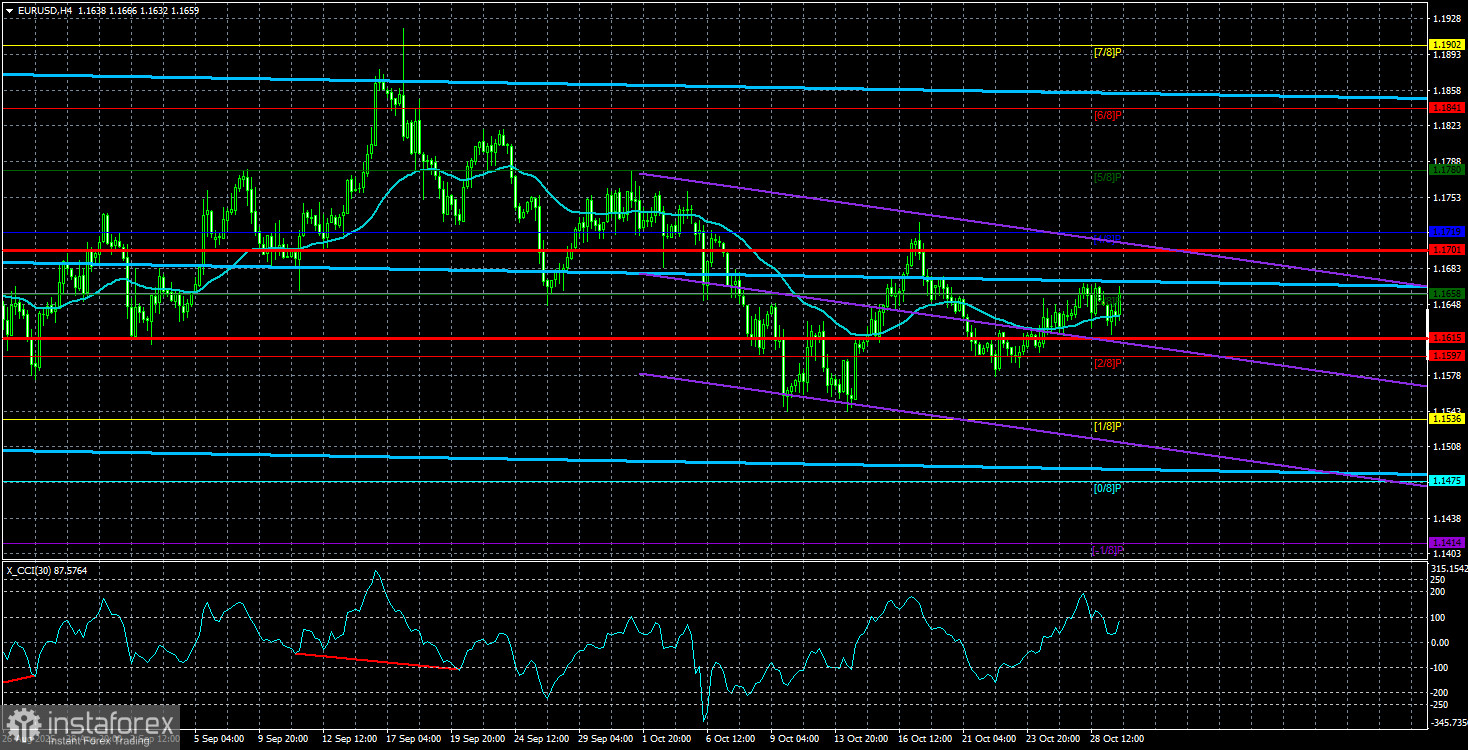
On the hourly timeframe, the EUR/USD pair might have completed its downward trend as early as the week before last. However, in recent days, the euro has been steadily declining, and it remains quite challenging to find explanations for this that do not border on science fiction. I believe the main reason for the irrational, illogical movements is the sideways trend on the daily timeframe. This sideways trend persists. For October 27, we highlight the following levels for trading: 1.1234, 1.1274, 1.1362, 1.1426, 1.1534, 1.1604-1.1615, 1.1657-1.1666, 1.1750-1.1760, 1.1846-1.1857, 1.1922, 1.1971-1.1988, as well as the Senkou Span B line (1.1637) and Kijun-sen line (1.1653). The Ichimoku indicator lines may move during the day, which should be considered when determining trading signals. Don't forget to place a Stop Loss at breakeven if the price moves in the correct direction by 15 pips. This will protect against potential losses if the signal turns out to be false.
Analysis are provided by InstaForex.
Read more:
https://ifxpr.com/47Jxdc4