29.11.2016
Euro
General overview
All eyes were on Mario Draghi’s speech on Monday. Investors expected to hear from the regulator new guidelines regarding the further economy course and the potential consequences following the Brexit vote.
Current situation
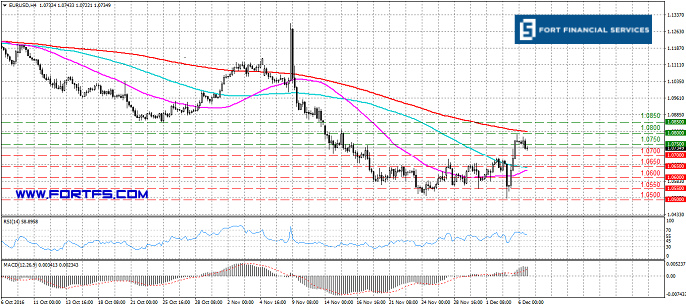
Bears seem to have returned to the game. Last week recovery lost its strengthened around 1.0700. The pair retreated from its recent highs and returned below 1.0650 post-Europe open. Sellers drove the price towards the level 1.0600 during the European hours. The price broke the 200-EMA downwards and met a barrier around the 50 and 100 EMAs in the 1 hour chart. The 200-EMA pointed lower while the 100-EMA turned neutral and the 50-EMA turned higher. The resistance is at 1.0650, the support comes in at 1.0600.
MACD grew which indicates the sellers’ positions weakening. RSI turned south.
Trading recommendations
A return below 1.0650 put on hold bulls’ plans. The bearish momentum is getting strength now. A bearish continuation through 1.0600 should lead to a continued slide towards 1.0550 as the first probable target.

Pound
General overview
The pound edged lower on Monday amid EUR/GBP cross strength.
Current situation
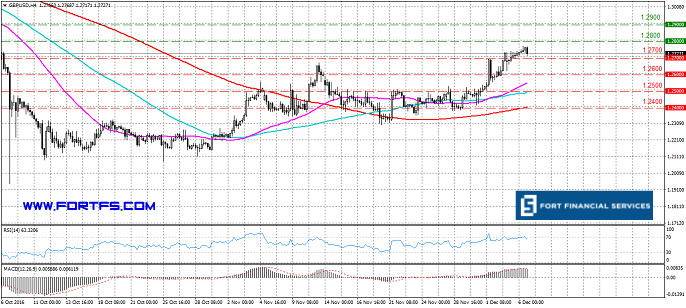
The pound bounced off the upper limit of its sideway channel on Monday. The price sharply fell towards 1.2400 in late Europe trades. After testing the level 1.2400 the price slowed down struggling with the level ahead of the NY opening. The sterling broke the 50-EMA and was stopped by the 100-EMA in the 4 hours chart. All moving averages were neutral in the mentioned timeframe. The resistance lies at 1.2500, the support comes in at 1.2400.
The MACD histogram decreased which indicates the sellers’ strength. RSI moved towards the oversold readings.
Trading recommendations
If the bearish tone persists we expect a breakout of the level 1.2400 and move towards 1.2300.

Yen
General overview
The dollar weakened against the yen as the uncertainty regarding the future events (OPEC meeting, Non-farm Payrolls and referendum in Italy) made investors close their deals.
Current situation
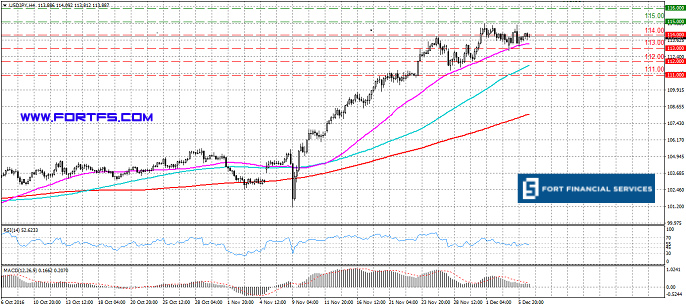
The price remained in an upward channel on Monday. The USD/JPY stayed around its lower limit, making timid steps to recover during the Asian session. The pair accelerated its growth during the European hours. The pair recovered to 113.00 ahead of the NA session. According to the 1 hour chart the price broke the 100-EMA upwards in the mid-Europe session. The price approached and tested the 50-EMA in the late Europe session. The 100 and 200 EMAs kept heading higher while the 50-EMA turned neutral in the same chart. The resistance is highlighted at 113.00, the support comes in at 112.00.
MACD grew which indicates the buyers’ positions strength. RSI moved higher.
Trading recommendations
We favor a return to the growth this week. The first bulls' target is the level 113.00. Should this mark be reached successfully, a further extension towards 114.00 could be observed further.

NZD/USD
General overview
The New Zealand dollar fell against its American counterpart amid oil prices drop and dollar’s return in the driver’s seat.
Current situation
After touching the level 0.7100 the kiwi stopped its growth. Buyers lost their legs around the level and gave place to sellers. Bears drove the pair to 0.7050 and touched the level ahead of the NA session. The NZD/USD hovered about the 50-EMA in the 4 hours chart. The 50-EMA was neutral and presented a solid support for the price. The 100-EMA crossed the 200-EMA and both lines kept heading lower. The resistance is at 0.7100, the support comes in at 0.7050.
MACD indicator is at the centerline. If the histogram enters the negative territory, that will indicate sellers’ growing strength. If MACD returns into the positive area the buyers will take control over the market. RSI bounced off the overbought area and headed towards the oversold readings.
Trading recommendations
A daily close below 0.7050 will ease the current upward momentum. A loss of 0.7050 may trigger further weakness towards 0.7000.

XAU/USD
General overview
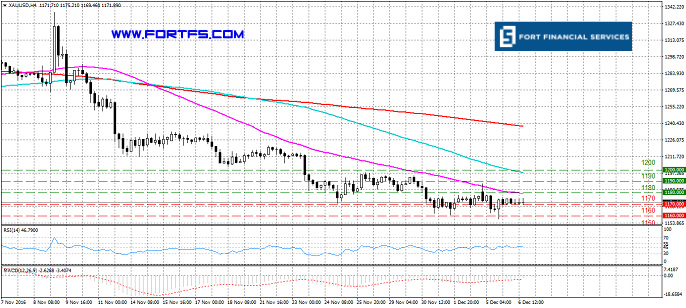
The risk on sentiment weighed on gold prices marking them move away from the recent highs. Moreover market participants preferred to stay out of deals ahead of the upcoming risks events later in the week.
Current situation
The price failed to advance beyond 1200 dollars per ounce and retreated almost immediately after testing the level. Sellers managed to lead the price from 1200 to 1190 which was broken in the mid-Europe session. Having broken the level the yellow metal continued advancing south. After breaking the 50-EMA the price met a barrier around the 100-EMA in the 1 hour chart. The 100-EMA rejected the precious metal downwards. The price spent the second part of the day between the 100 and 50 EMAs. The resistance exists at 1190, the support stands at 1180 dollars per ounce.
MACD traded to the downside while the RSI stayed neutral/negative.
Trading recommendations
Inability to break above 1200 points to buyers’ weakness. A downtrend will start as soon, as the pair drops below the support level 1190. A move lower may generate negative signals and risk further easing towards 1170 dollars per ounce.

Brent
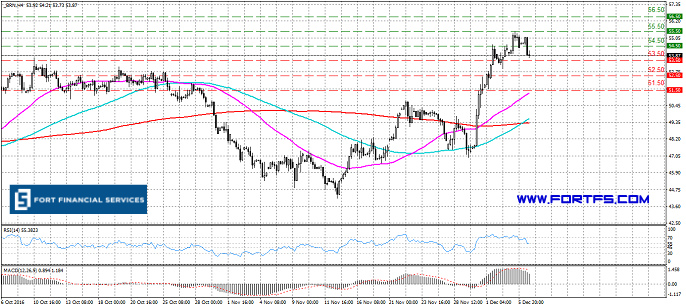
General overview
Despite the yesterday’s growth Brent futures remained in the red as markets still doubt over OPEC output deal.
Current situation
Oil prices gapped lower at the open on Monday. The price jumped from 46.85 to 46.00. After touching the level 46.00 the benchmark bounced upwards and filled the gap in the mid-Europe session. Brent tested and broke the level 47.50 ahead of the NY session opening. The price broke the bullish 200-EMA upwards in the 4 hours chart. After crossing the 100-EMA the 50-EMA extended its decline while the 100-EMA is changing its upward direction to the downward one. The resistance lies at 48.50, the support comes in at 47.50 dollars per barrel.
The MACD histogram grew which indicates buyers’ strength. RSI bounced from the oversold levels and advanced higher.
Trading recommendations
A failure to break below 46.50 may lead to a renewed buying interest. A fresh bullish pressure may push the price to the mark 48.00. A consolidation above the mark will neutralize the current downward momentum sending the market towards 48.50.

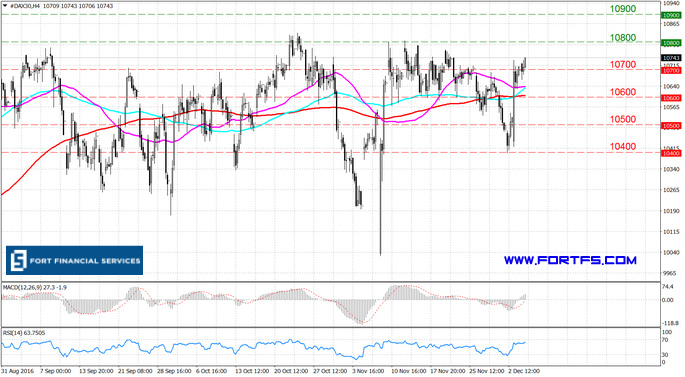
DAX
Current situation
DAX gapped lower at the open on Monday. The price jumped from 10700 to 10680 and continued advancing south after the gap. The benchmark extended its losses towards 10600 in the European session. After snapping the level the price bounced and remained above the level ahead of the NY opening. The price bounced off the 50-EMA and tested the 100 and 200 EMAs in the 4 hours chart. The resistance exists at 10600, the support stands at 10500.
MACD entered the negative area. RSI advanced south which confirms the current downward movement.
Trading recommendations
A sharp breakout below 10600 could spark a further incline towards 10500 in the coming days.

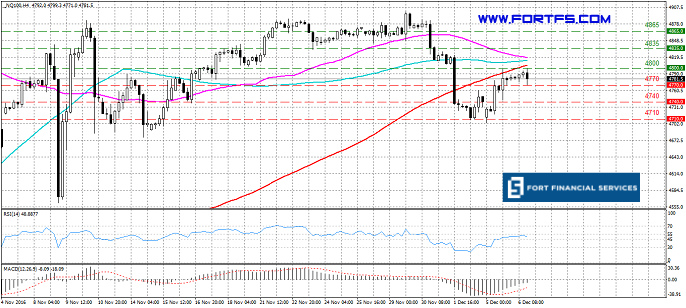
NASDAQ
Current situation
NASDAQ gapped lower at the open on Monday. After the gap the index stayed in a flat, trading range-bound-to lower. Sellers tried to leave a flat post-Europe open but failed and the price returned in the range. NASADQ hovered above the 50-EMA in the 4 hours chart. The 50 and 100 EMAs maintained their bullish slopes while the 200-EMA remained neutral. The resistance is at 4865, the support comes in at 4830.
MACD decreased which indicates the buyers’ positions weakening. RSI traded to the downside.
Trading recommendations
We believe the benchmark will maintain its bearish tone in the near-term. A clear break below 4830 would indicate that the bearish phase has resumed. After the break sellers will aim at 4800.

*Analytical review is presented by the leading analyst of the broker Fort Financial Services, Alexander Kofman