DAILY OVERVIEW
Trend : -
Ambush Zone : -
Target 1 : -
Target 2 : -
Stop : -
Comments
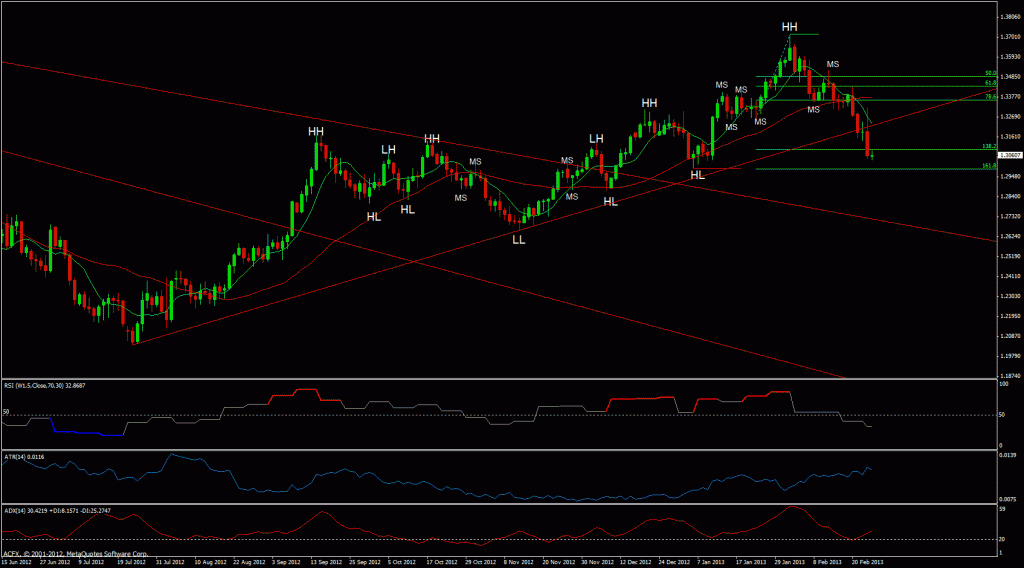
EURUSD did trade higher off the lows and at one point was up over 120 points on the day which actually exceeds one daily Average True Range only for Euro to rapidly lose value during the New York session and brake down aggressively through the down trend line.
Technically EURUSD is swing long as it is still trading above the last isolated HL of the 4th January which is at the 1.3000 area. It would not be a surprise if this downward momentum is halted around this significant price level however the aggressiveness of the move down has to be allowed for especially after the break of trend line support.
As the current price level is extended from the 8 period moving averages we are monitoring the possibility that EURUSD trades back to the area of this average which also coincides with the bottom of the uptrend line where we would expect to see a reaction that either rejects this price level and we see a possible downward bounce off resistance or EURUSD breaches and closes above resistance. Alternatively through the force of its own momentum EURUSD continues to trade lower from this current level in the direction of 1.3000 areas.
Definitions
Trend : Current trend as defined by technical Swing Analysis
HH : Higher High
HL : Higher Low
LL : Lower Low
LH : Lower High
CofT : Change of Trend
Daily Technical Analysis for GBPUSD as at 26th February 2013
DAILY OVERVIEW
Trend : Short
Ambush Zone : -
Target 1 : -
Target 2 : -
Stop : -
Comments
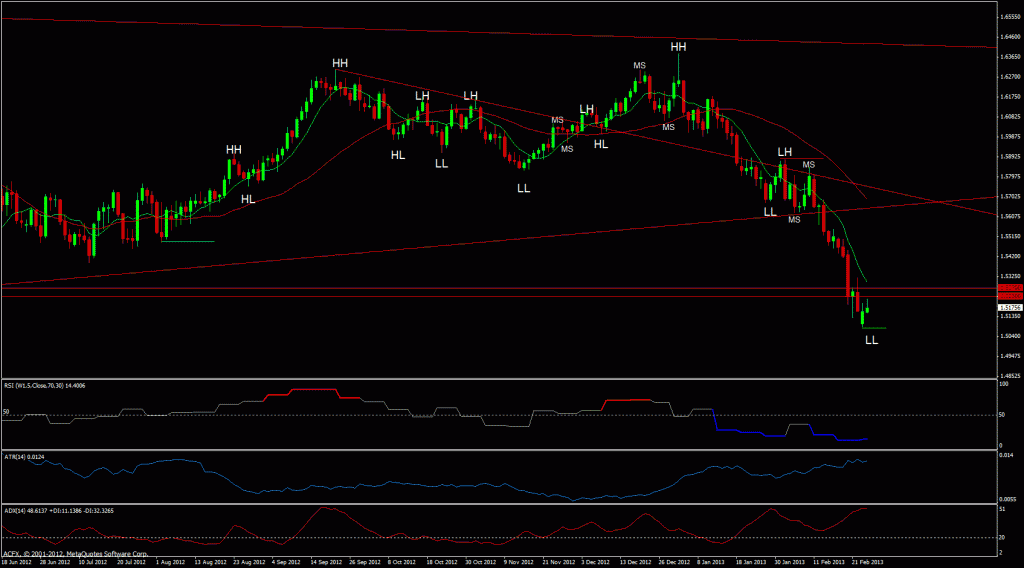
GBPUSD continues to trade beneath prior support but is this morning attempting to trade back up towards this area. This may offer the possibility for bears add additional shorts.
Definitions
Trend : Current trend as defined by technical Swing Analysis.
HH : Higher High
HL : Higher Low
LL : Lower Low
LH : Lower High
CofT : Change of Trend
Daily Technical Analysis for USDJPY as at 26th February 2013
DAILY OVERVIEW
Trend : Long
Ambush Zone : -
Target 1 : -
Target 2 : -
Stop : -
Comments
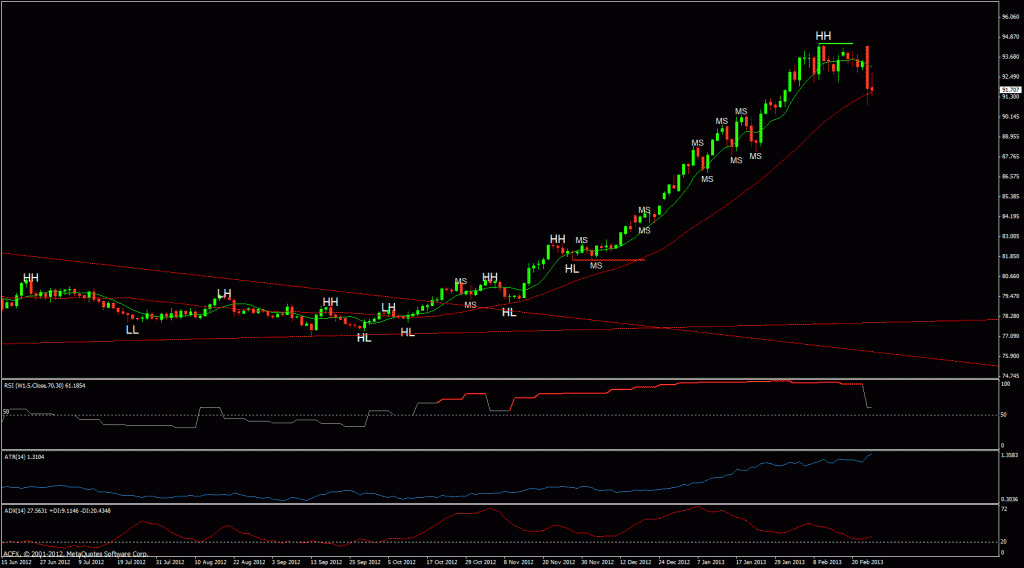
Yesterday morning initial upward momentum reversed and collapsed in what was one of the biggest moves of the past 12 months. The loss of value in the USD was significant as it is completely opposite to what happened with both the EURUSD and USDCHF and possibly points to a bigger picture that includes what is happening to both the US Bond and Equities markets.
Although we are still Swing Positive the aggressiveness of the move has to be allowed for therefore more down side momentum should not be a surprise.
Alternatively that USDJPY has actually bounced off the 34 period moving averages could see a reaction that pushes the price higher at least to the 8 period moving averages.
Definitions
Trend : Current trend as defined by technical Swing Analysis
HH : Higher High
HL : Higher Low
LL : Lower Low
LH : Lower High
CofT : Change of Trend
Daily Technical Analysis for USDCHF as at 26th February 2013
DAILY OVERVIEW
Trend : Short
Ambush Zone : 0.9205 – 0.9310
Target 1 : 0.9020
Target 2 : 0.8930
Stop : >0.9390
Comments
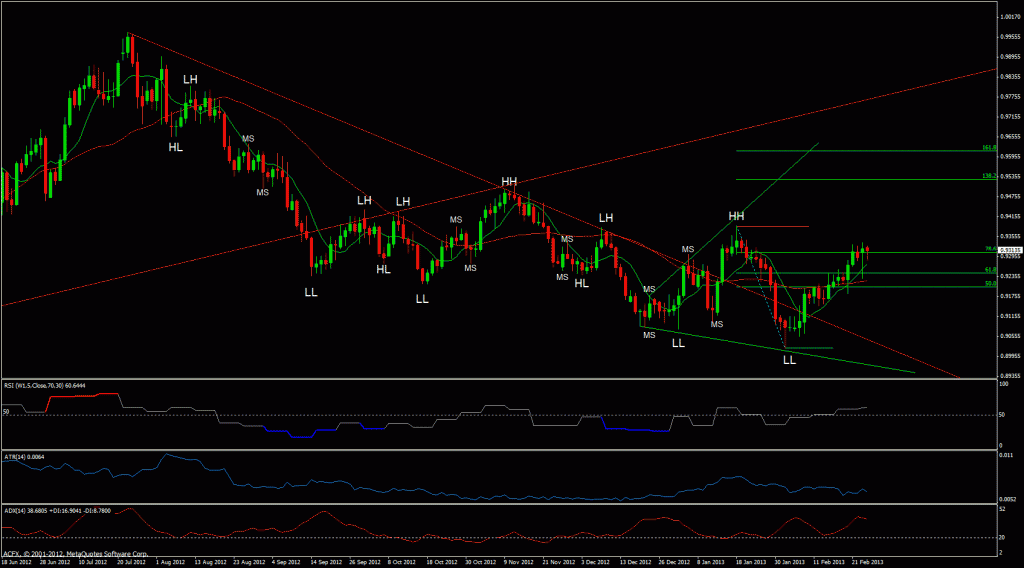
Yesterday morning’s initial sell off in USDCHF was strong with a 70 pip down move which is roughly in line with one daily Average True Range move. However as with EURUSD the weakness in the USD was reversed during the New York session. We continue to monitor the price action to see if USDCHF can follow through higher during the London session. A failure to push higher will of course give the bears encouragement to short these levels.
Definitions
Trend : Current trend as defined by technical Swing Analysis
HH : Higher High
HL : Higher Low
LL : Lower Low
LH : Lower High
CofT : Change of Trend
Daily Technical Analysis for Gold as at 26th February 2013
DAILY OVERVIEW
Trend : Short
Ambush Zone : -
Target 1 : -
Target 2 : -
Stop : -
Comments
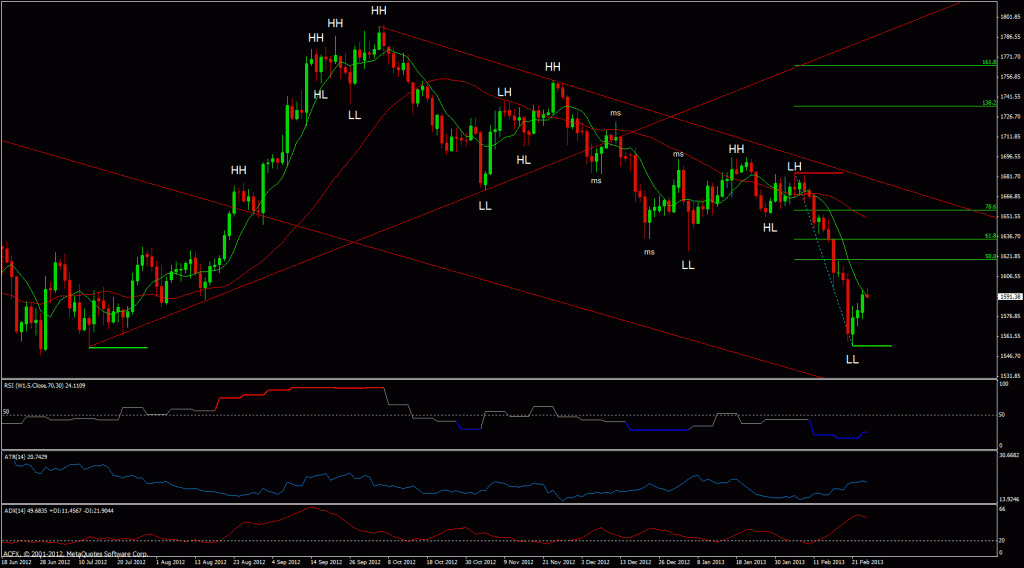
As mentioned yesterday we pin pointed the 8 period moving averages as the initial target area where additional shorts could possibly be considered. This morning Gold has reached this target and is showing initial signs of negativity. We are monitoring the price action at this levels for confirmation of this negative rotation.
Definitions
Trend : Current trend as defined by technical Swing Analysis
HH : Higher High
HL : Higher Low
LL : Lower Low
LH : Lower High
CofT : Change of Trend
Daily Technical Analysis for Oil (WTI) as at 26th February 2013
DAILY OVERVIEW
Trend : Long
Ambush Zone : -
Target 1 : -
Target 2 : -
Stop : -
Comments
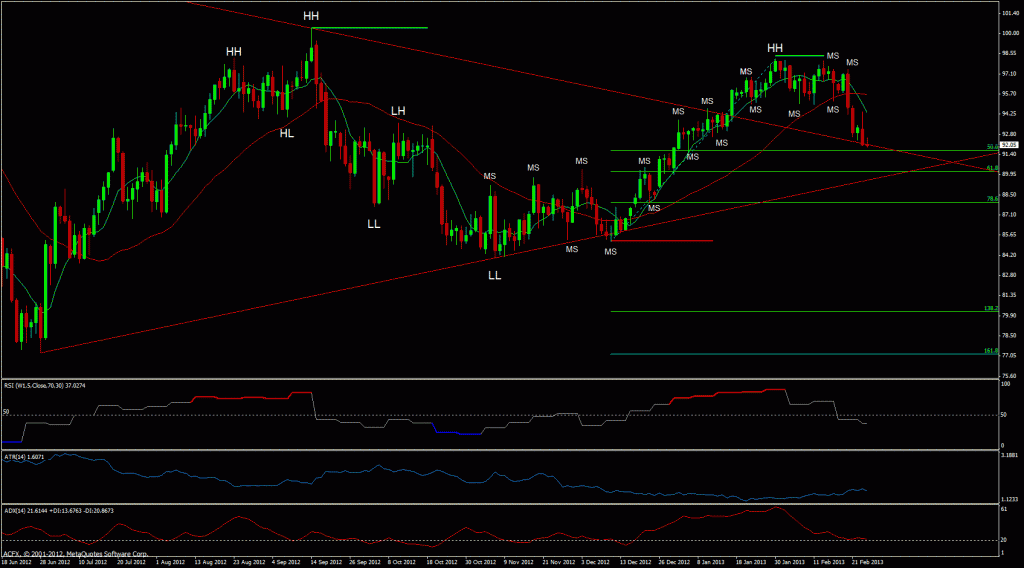
Oil has traded lower but has not significantly breached the downward sloping trend line. We continue to monitor the price action at these levels so as to identify the possibility that Oil is building a base where it can at least trade up to the 8 period moving averages. Alternatively a break of support may see Oil move to the Fibonacci area where the price action will be monitored for a possible positive rotation.
Definitions
Trend : Current trend as defined by technical Swing Analysis
HH : Higher High
HL : Higher Low
LL : Lower Low
LH : Lower High
CofT : Change of Trend

