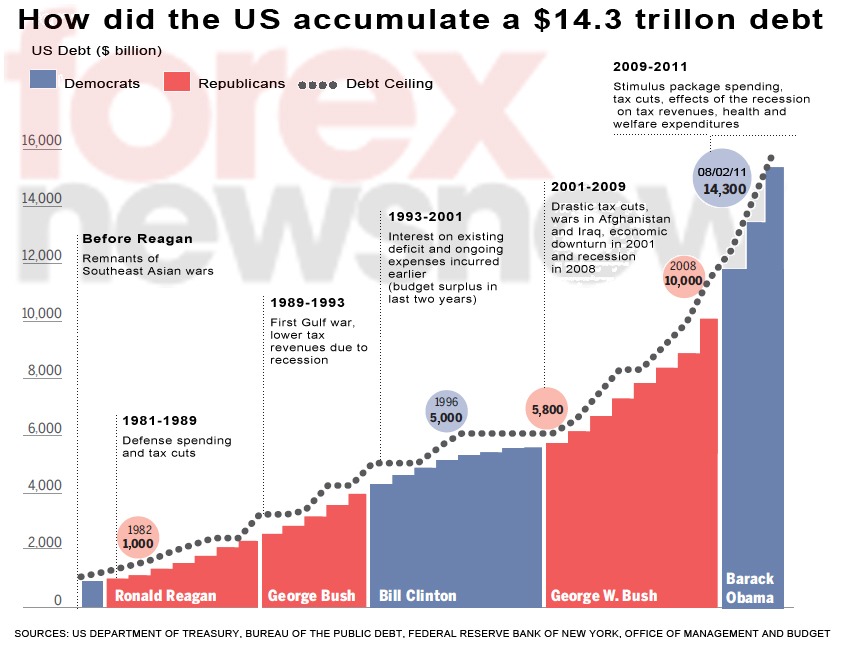
US Debt Crisis: Chart of US Debt History at a Glance
This article was published on ForexNewsNow.
People all over the world breathed a sigh of relief today as the US Congress managed to approve an agreement on a two-stage plan to raise the legal US debt limit a few hours before the US Treasury’s August 2nd deadline.
Now that the potential catastrophe has been averted, it is interesting to take a look at how the US managed to accumulate such a massive debt.
Below you will find a timeline showing when and how the US was spending more than it was taking in during the previous 30 years.
The chart traces the trajectory of US public debt from President Reagan to Obama.

For more exclusive Online Forex News, follow us on Twitter or join us on Facebook.
People all over the world breathed a sigh of relief today as the US Congress managed to approve an agreement on a two-stage plan to raise the legal US debt limit a few hours before the US Treasury’s August 2nd deadline.
Now that the potential catastrophe has been averted, it is interesting to take a look at how the US managed to accumulate such a massive debt.
Below you will find a timeline showing when and how the US was spending more than it was taking in during the previous 30 years.
The chart traces the trajectory of US public debt from President Reagan to Obama.

For more exclusive Online Forex News, follow us on Twitter or join us on Facebook.