LiteForex Market Analytics

Forex broker related topics and discussions

LiteForex Market Analytics

Postby LiteForexTeam » Thu May 23, 2013 1:03 pm

This section will be dedicated to analytics and forecast of the financial market from LiteForex Company.

EUR/USD: Technical analysis of 23.05

1. Current trend
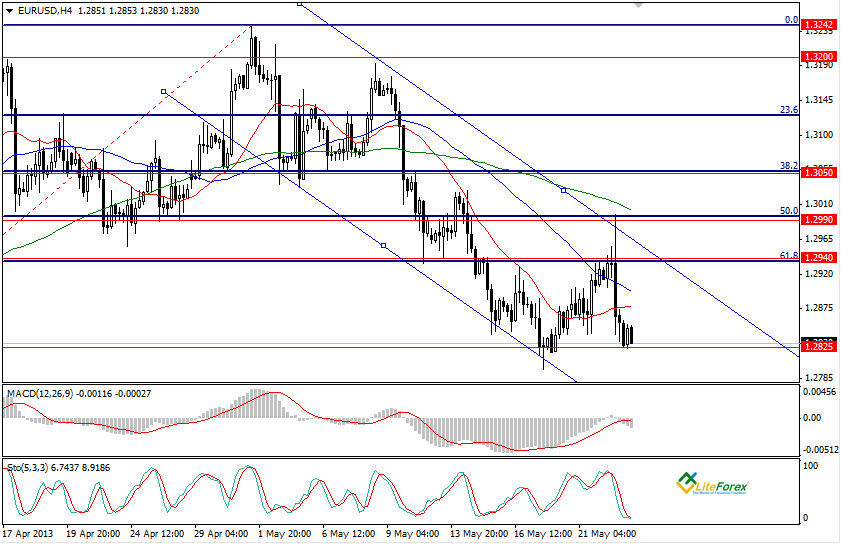
Look at the four-hour chart of the pair EUR/USD. Since the beginning of the month the pair has moved in the downward channel. Yesterday the “bulls” tried to leave the channel and change the trend; however they failed, as resistance levels, which coincided with Fibonacci 50.1 and 61.8 blocked the way. Most indicators show further decline in rate. All three moving average lines are lined up in the downward order. The signal line and histogram are in the negative zone. Stochastic is in the oversold zone; both lines of the indicator are directed downward, indicating the decline.

2. Levels of support and resistance
The nearest support level is 1.2825. Next after it will be 1.2760 – it is the key level and if it is broken down, the price will go further down. Resistance levels are 1.2940 and 1.2990, which have recently prevented the rise in price.

3. Trading tips
The most feasible scenario is the decline of rate up to the level of 1.2760. It is also possible that the price will move in the channel of 1.2940 -1.2825; therefore it makes sense to set sell limits at the upper boundary.

Image

Ilya Lashenko
Analyst of LiteForex Group of Companies
LiteForex Representative
LiteForexTeam
 
Posts: 1249
Joined: Thu May 23, 2013 12:53 pm

Re: LiteForex Market Analytics

Postby LiteForexTeam » Mon Jul 08, 2013 10:10 am

GBPUSD: expected rebound up to 1.5000

1. Current trend of GBPUSD


Last Friday the pair was still declining because of the positive statistics of the Nonfarm Payrolls. In spite of the estimated 162 000 the figures had reached the level of 195 000. Favorable figures consolidated American dollar and GBPUSD fell to the new local minimum 1.4855. After an abrupt descent investors are apprehensive about depositing to the oversold pound. However if we consider future macroeconomic data, the pound will have an opportunity to restore its position. Leaders of Bank of England are going to broach an issue of changing of monetary policy. The majority makes a stand against increasing the volume of asset purchase program, referring to positive macroeconomic statistics and British economic recovery.

2. Important levels: support and resistance

In the near future it is probable for the pair to go down and to reach key support level. The fall will be followed by a considerable rebound up to 1.5000, 1.5050. Many analytics and investors assume the consolidation up to 1.5200 to the begging of August. We also can not ignore the possibility of resistance level of 1.4840 breakdown. This scenario is highly probable if The Bank of England decides to enlarge the asset purchase program or if the third round of Quantitative easing of FRS curtails.

3. Best entry/exit points

It is suggested to open long positions with Take Profits at 1.5000-1.5050.

4. Supporting facts

MACD histogram on the four-hour chart is in the negative zone under the zero lineand is directed downwards. It means the “bearish” trend will continue.

http://www.liteforex.com/uploads/other/5bca1fdae025fc4e697f1cbcd3c0a357.png

Dmitry Likhachev
Analyst of LiteForex Group of Companies
LiteForex Representative
LiteForexTeam
 
Posts: 1249
Joined: Thu May 23, 2013 12:53 pm

Re: LiteForex Market Analytics

Postby LiteForexTeam » Thu Jul 11, 2013 6:24 am

Forex: Ichimoku Clouds. Review of USDCAD

USDCAD, H4

Let’s look at the four-hour chart. Tenkan-Sen line is below Kijun-Sen line and they are both horizontal. Chinkou Span line is below the price chart, current Kumo-cloud is descending. Since yesterday the pair has been falling, but this morning we can see a small rebound. The closest resistance level is Tenkan-Sen line (1.0433). One of the previous extremums of Chinkou Span line is expected to be a support level at 1.0195.

Image

USDCAD, D1

On the daily chart Tenkan-sen line is above Kijun-sen, but the blue one is directed downwards. Chinkou Span line approaches the price chart from above; current Kumo-cloud is ascending. After long rise the pair has collapsed and broken down Tenkan-Sen and Kijun-Sen levels. The next obstacle for the price on its way down will be the upper border of the cloud at 1.0279-1.0263. The closest resistance level is Kijun-Sen line (1.0372).

Image

Key levels

Support levels: 1.0195, 1.0279-1.0263.
Resistance levels: 1.0433, 1.0372.

Trading tips

On the four-hour chart the price has slowed down, but we expect a new “bearish” impetus. On the chart with higher timeframe a confirming signal to sell will appear as soon as Tenkan-Sen and Kijun-Sen lines are crossed or Chinkou Span line crosses the price chart.

Anastasiya Glushkova
Analyst of LiteForex Group of Companies
LiteForex Representative
LiteForexTeam
 
Posts: 1249
Joined: Thu May 23, 2013 12:53 pm

Re: LiteForex Market Analytics

Postby LiteForexTeam » Fri Jul 12, 2013 4:39 am

Forex: Ichimoku Clouds. Review of AUDUSD

AUDUSD, H4

On the four-hour chart Tenkan-sen line is above Kijun-sen, the red line is directed upwards, but the blue one stays horizontal. Chinkou Span line is above the price chart, current Kumo is ascending. Since yesterday the price has been fluctuating within a channel corresponding to the cloud. A strong resistance level is flat Kumo top at 0.9191. The resistance level is Senkou Span A line (0.9127).
Image

AUDUSD, D1

Let’s look at the daily chart. Tenkan-sen line is below Kijun-sen, and the price is squeezed between them. Chinkou Span line is below the price chart, current Kumo is descending. Kijun -sen line remains the closest resistance level at 0.9351. One of the previous minimums of Chinkou Span line is expected to be a resistance level at 0.8816.
Image

Key levels
Support levels: 0.8816, 0.9127.
Resistance levels: 0.9191, 0.9351.


Trading tips

On the four-hour chart the price is still within the cloud borders, it is not advisable to open new trades. The further movement of the price will be determined by the breakdown of one of the cloud borders. The chart of the higher timeframe confirms the descending trend.

Anastasiya Glushkova
Analyst of LiteForexGroup of Companies
LiteForex Representative
LiteForexTeam
 
Posts: 1249
Joined: Thu May 23, 2013 12:53 pm

Re: LiteForex Market Analytics

Postby LiteForexTeam » Fri Jul 12, 2013 9:11 am

GBPUSD: Reversal of the trend

1. Current trend

This Thursday British currency was strengthening. Startled by the Bernanke’s speech investors were buying pound. Demand of dollar has decreased. Negative statistics on labor market has affected American currency. Unemployment claims haven’t confirmed the forecast and had risen up to 360 000. Under the pressure of these facts the pair GBPUSD hit 1.5200. Today we anticipate European news — an industrial production index. Among the macroeconomic statistics from US we highlight Producer Price Index, Consumer Sentiment Index and we’re waiting for the speech of FOMC member Bullard.

2. Important levels: support and resistance

The pair has consolidated around resistance level at 1.5200; we expect further descending correction towards support levels 1.5100-1.5050. A strong rise is highly unlikely. Despite the prolongation of QE program dollar is supported by positive economic statistics and won’t probably fall. The reversal of the trend seems to be the most obvious scenario. After slight decline the pair will go all the way up to 1.5310.

3. Best exit/entry points

We suggest to open long trades with Take Profits at 1.5310. Pending orders can be placed at 1.5100-1.5050 with Take Profits at 1.5300.

4. Supporting facts

MACD histogram on the four-hour chart has moved to positive zone, it is above signal line and is directed upwards. This is a sign of trend reversal.

Image

Dmitry Likhachev
Analyst of LiteForex Group of Companies
LiteForex Representative
LiteForexTeam
 
Posts: 1249
Joined: Thu May 23, 2013 12:53 pm

Re: LiteForex Market Analytics

Postby LiteForexTeam » Tue Jul 23, 2013 5:04 am

Forex: Ichimoku Clouds. Review of GBPUSD

GBPUSD, H4

On the four-hour chart Tenkan-sen line is above Kijun-sen, and they are both horizontal. Chinkou Span line is above the price chart, current Kumo is ascending. Since last week the pair has been rising strongly. Tenkan-sen (1.5320) and Kijun-sen (1.5231) lines are support levels. One of the previous maximums of Chinkou Span line is expected to be a resistance level at 1.5433.
Image

GBPUSD, D1

Let’s look at the daily chart. Last week Tenkan-sen line is below Kijun-sen line and they are directed towards each other. Chinkou Span is approaching the price chart from below. After considerable fall the pair reversed, broke through Tenkan-sen and Kijun-sen lines and hit flat bottom of the cloud. Senkou Span B line becomes a strong resistance level at 1.5379. Kijun-sen line is the closest support level at 1.5268.

Image

Key levels
Support levels: 1.5320, 1.5231, 1.5268.
Resistance levels: 1.5433, 1.5379.


Trading tips

On the four-hour chart we can see a development of upwards movement. Long trades can be opened with Take Profit orders at 1.5433. On the daily chart the price has slowed down before flat bottom of the cloud. The breakthrough of this level will produce a signal to buy. However if the price bounce off this line, the pair will go down to 1.5268.
Anastasiya Glushkova
Analyst of LiteForexGroup of Companies
LiteForex Representative
LiteForexTeam
 
Posts: 1249
Joined: Thu May 23, 2013 12:53 pm

Re: LiteForex Market Analytics

Postby LiteForexTeam » Tue Jul 23, 2013 7:26 am

XAUUSD: gold regains lost positions
1. Current trend

Gold has grown since the beginning of this trading week, steadily consolidating above the level of 1300.00 USD per troy ounce. Gold is a traditional safe haven against risks of inflation and weakening in the national currencies. Precious metal will in the advantageous position if governments continue to pursue monetary easing policy. Amid victory of the ruling party in Japanese election and due to comments by Ben Bernanke, gold has strengthened positions and is likely to continue growth.
Technical indicators show that gold has all chances for further rise. All three moving average lines are directed upward. The signal line and histogram of MACD indicator are in the positive zone. Stochastic is in the oversold zone, both of its lines are directed downward, suggesting a chance of correction.


2. Levels of support and resistance
Pushing off from resistance level of 1340.00, the price is moving down to the level of 1321.00. Next support level is 61.6% of Fibonacci. The main target of the “bulls” is the level of 1370.00, which coincides with the level of 38.2% Fibonacci.

3. Trading tips
At the moment, the pair may experience downward correction to 1321.00 or lower up to 1300.00. It makes sense to place limit buy order at these levels. Buy orders can be placed if gold exceeds the level of 1340.00.

Image

Ilya Lashenko
Analyst of LiteForex Group of Companies
LiteForex Representative
LiteForexTeam
 
Posts: 1249
Joined: Thu May 23, 2013 12:53 pm

Re: LiteForex Market Analytics

Postby LiteForexTeam » Wed Jul 24, 2013 5:19 am

NZDUSD: pair will continue to rise

1. Current trend

The pair NZDUSD has started this week with a growth and hit two-month maximum at 0.8010 on Tuesday. This level corresponding to the upper border of the ascending channel hasn’t been broken through. The price is being corrected now due to the unfavorable date on China manufacturing index. Its rate in July is 47,7 points, but the experts expected it to be 48,6 points.


2. Support and resistance; entry/exit points
Regardless sudden downward correction “bullish” movement is most probable today. The price may rise up to 0.8010, 0.8050 and even 0.8100 levels. We recommend to open long trades at 0.7990 with Take profits at 0.8100.

3. Technical indicators

On the four-hour chart Bollinger Bands do not show any important divergence and are directed upwards. Upper line of the indicator corresponds to the border of an uprising channel. Price chart can’t break through MA which is also a support level. MACD histogram is in overbought zone and has crossed the signal line from above. It can be a sigh of temporary fall but not the reverse of the trend. Stocahstic lines have crossed giving a signal to short-term sell.

Image

Dmitriy Zolotov
Analyst of LiteForex Group of Companies
LiteForex Representative
LiteForexTeam
 
Posts: 1249
Joined: Thu May 23, 2013 12:53 pm

Re: LiteForex Market Analytics

Postby LiteForexTeam » Wed Jul 24, 2013 6:13 am

EURUSD: data from China has weaken the pair

1. Current trend

This Tuesday pair EURUSD has risen and reached resistance level at 1.3240, but the level hasn’t been overcome. The pair has started downward correction due to the negative statistics on China manufacturing index. Its rate in July is 47,7, which are the worst figures since three years ago. Unfavorable news from Heavenly Empire confirms the fears of investors. Economic recession of one of the world powers can affect USA as well as European countries. Today we anticipate flash manufacturing index of Eurozone and new home sales in USA.

2. Support and resistance;
The pair is trading around 1.3200 level. Today we expect the price to go up to 1.3240 and 1.3320. However temporary slide-down to Bollinger Bands MA at 1.3170 is also possible. Then the price can reverse and start to rise. We would recommend to open long positions with Take Profit orders at 1.3320. Short-term sell trades can be opened at 1.3200.
3. Technical indicators

On the four-hour chart Bollinger Bands do not show any important divergence and are directed upwards. Price chart is directed towards MA; it can be a sign of decrease to 1.3170 level. MACD histogram is in overbought zone, its volumes are increasing. Stochastic lines have crossed giving a signal of temporary fall.
Image

Dmitriy Zolotov
Analyst of LiteForex Group of Companies
LiteForex Representative
LiteForexTeam
 
Posts: 1249
Joined: Thu May 23, 2013 12:53 pm

Re: LiteForex Market Analytics

Postby LiteForexTeam » Thu Jul 25, 2013 7:34 am

EUR/USD: general analysis

1. Current trend

At the opening of European session the pair fell to support level at 1.3175, and after that was trading near the level of 1.3200. The data on Eurozone released today was above experts’ expectations: index of business climate and current assessment index in Germany have overshoot projections.
Index of inflation and money supply M3 are at the level of 2.3%. These facts have triggered short-term rise up to 30-35 points. Another driver of the rise of the pair will be US statistics. Mr. Bernanke’s optimism in terms of recovery of the US economy might have been slightly exaggerated and it will not be able to provide appropriate support to the USD.
The data which is scheduled for the release today is as follows: number of initial claims for unemployment benefits, volume of orders for durable goods, business activity index in manufacturing sector. Experts believe that all indices will show negative performance.

2. Levels of support and resistance


The pair is once again testing resistance level of 1.3255; however it has failed to consolidate above this level. If this level is broken down the price will go up to the local highs of 1.3306.


3. Trading tips


We would recommend to open long positions with the short-term target of 1.3306. In the long-term the movement may reach the level of 1.3360, following the rollback to the line 1.3255.


Image

Kamil Avad
Analyst of LiteForex Group of Companies
LiteForex Representative
LiteForexTeam
 
Posts: 1249
Joined: Thu May 23, 2013 12:53 pm

Next

Return to Forex Brokers