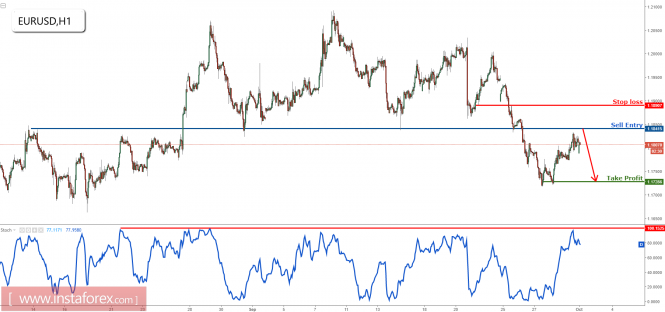
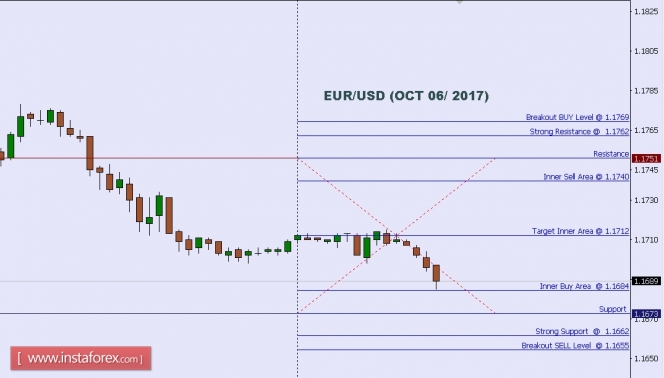
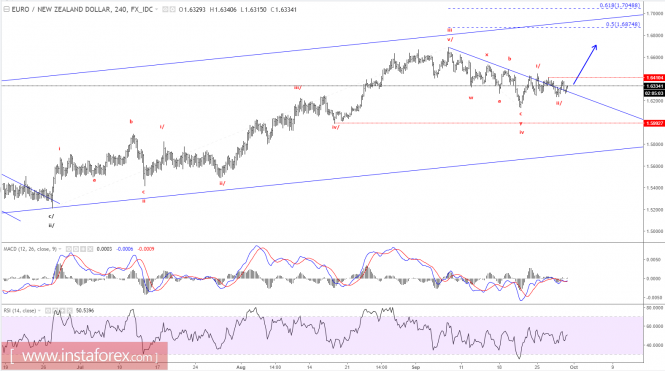
Instaforex Analysis

Forex broker related topics and discussions

Re: Instaforex Analysis

Postby IFX Gertrude » Fri Sep 29, 2017 1:55 am

Elliott wave analysis of EUR/NZD for September 29, 2017

Image

Wave summary:
We continue to look for more upside pressure towards 1.6875, but we need a break above minor resistance at 1.6410 to get the next "GO" higher. As long as the minor resistance at 1.6410 is able to cap the upside, we should look for a minor dip to 1.6311 before turning up again.
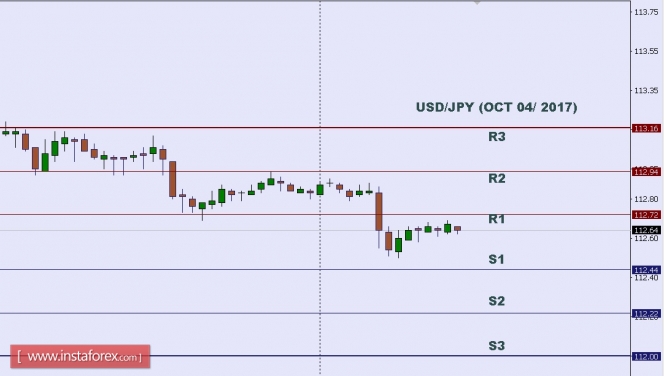
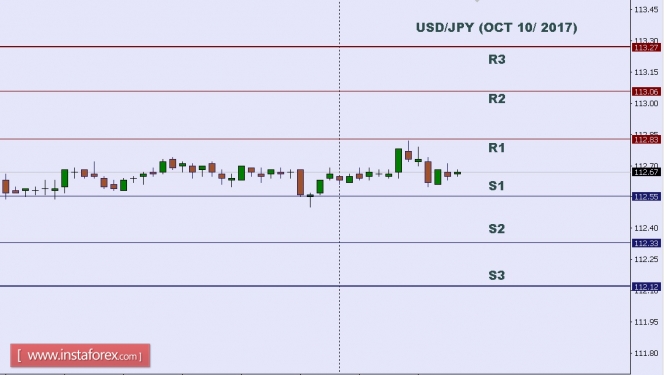
R3: 1.6451
R2: 1.6410
R1: 1.6340
Pivot: 1.6300
S1: 1.6278
S2: 1.6222
S3: 1.6200

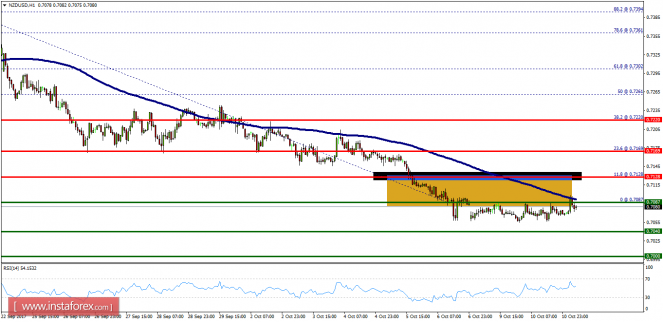
Trading recommendation:
We will buy EUR again at 1.6300 or upon a break above 1.6365.

Analysis are provided byInstaForex.
Best regards, PR Manager

Learn more about InstaForex Company at http://instaforex.com
IFX Gertrude
 
Posts: 5198
Joined: Wed Nov 07, 2012 6:25 am

Re: Instaforex Analysis

Postby IFX Gertrude » Mon Oct 02, 2017 1:41 am

EUR/USD approaching major resistance, prepare to sell

Image

The price is approaching major resistance at 1.1841 (Fibonacci retracement, Fibonacci extension, horizontal overlap resistance) and we expect to see a strong reaction off this level to push the price down to at least 1.1728 support (Fibonacci extension, horizontal swing low support, Elliott wave theory).

Stochastic (34,3,1) is seeing major resistance from the 100% level and we're starting to see a nice reversal take place.

Sell below 1.1841. Stop loss is at 1.1890. Take profit is at 1.1728.

Analysis are provided byInstaForex.
Best regards, PR Manager

Learn more about InstaForex Company at http://instaforex.com
IFX Gertrude
 
Posts: 5198
Joined: Wed Nov 07, 2012 6:25 am

Re: Instaforex Analysis

Postby IFX Gertrude » Tue Oct 03, 2017 2:17 am

Technical analysis of EUR/USD for Oct 03, 2017

Image

When the European market opens, some Economic Data will be released, such as PPI m/m and Spanish Unemployment Change. The US will release the Economic Data, too, such as Total Vehicle Sale, so, amid the reports, EUR/USD will move in a low to medium volatility during this day.

TODAY'S TECHNICAL LEVEL:
Breakout BUY Level: 1.1789.
Strong Resistance:1.1782.
Original Resistance: 1.1771.
Inner Sell Area: 1.1760.
Target Inner Area: 1.1732.
Inner Buy Area: 1.1704.
Original Support: 1.1693.
Strong Support: 1.1682.
Breakout SELL Level: 1.1675.

Analysis are provided byInstaForex.
Best regards, PR Manager

Learn more about InstaForex Company at http://instaforex.com
IFX Gertrude
 
Posts: 5198
Joined: Wed Nov 07, 2012 6:25 am

Re: Instaforex Analysis

Postby IFX Gertrude » Wed Oct 04, 2017 1:56 am

Technical analysis of USD/JPY for Oct 04, 2017

Image

In Asia, Japan today will not release any Economic Data, but the US will release some Economic Data, such as Crude Oil Inventories, ISM Non-Manufacturing PMI, Final Services PMI, and ADP Non-Farm Employment Change. So, there is a probability the USD/JPY will move with medium volatility during this day.

TODAY'S TECHNICAL LEVEL:
Resistance. 3: 113.16.
Resistance. 2: 112.94.
Resistance. 1: 112.72.
Support. 1: 112.44.
Support. 2: 112.22.
Support. 3: 112.00.

Analysis are provided byInstaForex.
Best regards, PR Manager

Learn more about InstaForex Company at http://instaforex.com
IFX Gertrude
 
Posts: 5198
Joined: Wed Nov 07, 2012 6:25 am

Re: Instaforex Analysis

Postby IFX Gertrude » Wed Oct 04, 2017 1:57 am

Technical analysis of USD/JPY for Oct 04, 2017

Image

In Asia, Japan today will not release any Economic Data, but the US will release some Economic Data, such as Crude Oil Inventories, ISM Non-Manufacturing PMI, Final Services PMI, and ADP Non-Farm Employment Change. So, there is a probability the USD/JPY will move with medium volatility during this day.

TODAY'S TECHNICAL LEVEL:
Resistance. 3: 113.16.
Resistance. 2: 112.94.
Resistance. 1: 112.72.
Support. 1: 112.44.
Support. 2: 112.22.
Support. 3: 112.00.

Analysis are provided byInstaForex.
Best regards, PR Manager

Learn more about InstaForex Company at http://instaforex.com
IFX Gertrude
 
Posts: 5198
Joined: Wed Nov 07, 2012 6:25 am

Re: Instaforex Analysis

Postby IFX Gertrude » Thu Oct 05, 2017 2:19 am

Technical analysis of EUR/USD for Oct 05, 2017

Image

When the European market opens, some Economic Data will be released, such as ECB Monetary Policy Meeting Accounts, French 10-y Bond Auction, Spanish 10-y Bond Auction, and Retail PMI. The US will release the Economic Data, too, such as Natural Gas Storage, Factory Orders m/m, Trade Balance, Unemployment Claims, and Challenger Job Cuts y/y, so, amid the reports, EUR/USD will move in a low to medium volatility during this day.

TODAY'S TECHNICAL LEVEL:
Breakout BUY Level: 1.1812.
Strong Resistance:1.1805.
Original Resistance: 1.1794.
Inner Sell Area: 1.1783.
Target Inner Area: 1.1755.
Inner Buy Area: 1.1727.
Original Support: 1.1716.
Strong Support: 1.1705.
Breakout SELL Level: 1.1698.

Analysis are provided byInstaForex.
Best regards, PR Manager

Learn more about InstaForex Company at http://instaforex.com
IFX Gertrude
 
Posts: 5198
Joined: Wed Nov 07, 2012 6:25 am

Re: Instaforex Analysis

Postby IFX Gertrude » Fri Oct 06, 2017 2:28 am

Technical analysis of EUR/USD for Oct 06, 2017

Image

When the European market opens, some Economic Data will be released, such as Italian Retail Sales m/m, French Trade Balance, French Gov Budget Balance, and German Factory Orders m/m. The US will release the Economic Data, too, such as Consumer Credit m/m, Unemployment Rate, Non-Farm Employment Change, and Average Hourly Earnings m/m, so, amid the reports, EUR/USD will move in a medium to high volatility during this day.

TODAY'S TECHNICAL LEVEL:
Breakout BUY Level: 1.1769.
Strong Resistance:1.1762.
Original Resistance: 1.1751.
Inner Sell Area: 1.1740.
Target Inner Area: 1.1712.
Inner Buy Area: 1.1684.
Original Support: 1.1673.
Strong Support: 1.1662.
Breakout SELL Level: 1.1655.

Analysis are provided byInstaForex.
Best regards, PR Manager

Learn more about InstaForex Company at http://instaforex.com
IFX Gertrude
 
Posts: 5198
Joined: Wed Nov 07, 2012 6:25 am

Re: Instaforex Analysis

Postby IFX Gertrude » Mon Oct 09, 2017 1:49 am

EUR/USD testing strong resistance, prepare to sell

Image

The price has bounced up perfectly from our buying area previously and is fast approaching our profit target. We turn bearish today looking to sell below 1.11744 resistance (Fibonacci retracement, horizontal pullback resistance) for a push down to at least 1.1653 support (Fibonacci extension).

Stochastic (21,5,3) is seeing major resistance below 95% and we expect a corresponding reaction from this level.

Sell below 1.1744. Stop loss is at 1.1793. Take profit is at 1.1653.

Analysis are provided byInstaForex.
Best regards, PR Manager

Learn more about InstaForex Company at http://instaforex.com
IFX Gertrude
 
Posts: 5198
Joined: Wed Nov 07, 2012 6:25 am

Re: Instaforex Analysis

Postby IFX Gertrude » Tue Oct 10, 2017 1:30 am

Technical analysis of USD/JPY for Oct 10, 2017

Image

In Asia, Japan will release the Economy Watchers Sentiment and Current Account data, and the US will release some Economic Data, such as IBD/TIPP Economic Optimism and NFIB Small Business Index. So, there is a probability the USD/JPY will move with ... volatility during this day.

TODAY'S TECHNICAL LEVEL:
Resistance. 3: 113.27.
Resistance. 2: 113.06.
Resistance. 1: 112.83.
Support. 1: 112.55.
Support. 2: 112.33.
Support. 3: 112.12.

Analysis are provided byInstaForex.
Best regards, PR Manager

Learn more about InstaForex Company at http://instaforex.com
IFX Gertrude
 
Posts: 5198
Joined: Wed Nov 07, 2012 6:25 am

Re: Instaforex Analysis

Postby IFX Gertrude » Wed Oct 11, 2017 2:20 am

Technical analysis of NZD/USD for October 11, 2017

Image

Overview:
The NZD/USD didn't make significant movement yesterday. There are no changes in my technical outlook. The bias remains bearish in the nearest term testing 0.7000 or higher. Immediate support is seen around 0.7087. The NZD/USD pair fell from the level of 0.7128 towards 0.7087. Now, the price is set at 0.7069 to act as a minor support. It should be noted that volatility is very high for that the NZD/USD pair is still moving between 0.7128 and 0.7040 in coming hours. Furthermore, the price has been set below the strong resistance at the levels of 0.7169 and 0.7220, which coincides with the 23.6% and 38.2% Fibonacci retracement level respectively. Additionally, the price is in a bearish channel now. Amid the previous events, the pair is still in a downtrend. From this point, the NZD/USD pair is continuing in a bearish trend from the new resistance of 0.7128. Thereupon, the price spot of 0.7128/0.7087 remains a significant resistance zone. Therefore, a possibility that the NZD/USD pair will have downside momentum is rather convincing and the structure of a fall does not look corrective. In order to indicate a bearish opportunity below 1.0020, sell below 0.7128 or 0.7087 with the first targets at 0.7040 and 0.7000 (support 3). However, the stop loss should be located above the level of 0.7169.

Analysis are provided byInstaForex.
Best regards, PR Manager

Learn more about InstaForex Company at http://instaforex.com
IFX Gertrude
 
Posts: 5198
Joined: Wed Nov 07, 2012 6:25 am

PreviousNext

Return to Forex Brokers