Instaforex Analysis

Forex broker related topics and discussions

Re: Instaforex Analysis

Postby IFX Gertrude » Mon Jul 17, 2017 1:29 am

The dollar remained without support

The US dollar finished the week with large-scale sales, never seeing a single factor that could support it. The formal reason for the decline in investor confidence was the report of the Bureau of Labor Statistics on inflation, but this was not the only reason.

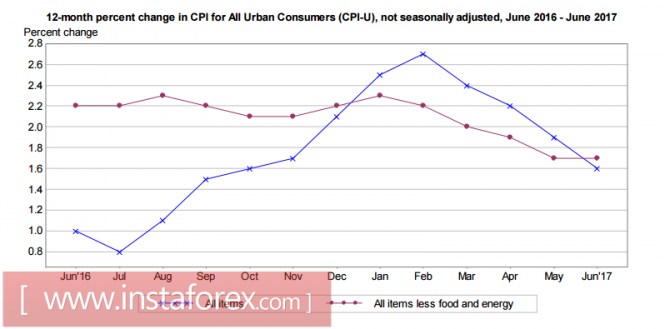
Consumer prices remained unchanged in June while annual inflation slowed to 1.6% from 1.9% a month earlier. Both indicators were worse than expected.

Image

Also an unpleasant surprise was the decline in retail sales for the second month in a row. Experts expected a slight increase. The slowdown in consumer activity is an alarming factor as it indicates that incoming signals, one after another, about slower economic growth are not accidental and will likely cause a crisis to develop.

The preliminary value of the consumer confidence index according to the University of Michigan was significantly lower than expected at 93.1 points in July against the forecast of 95.0 points and last month's figure of 95.1 points. The subindex of expectations are declining at the fastest rate, indicating that consumers are preparing for a deterioration in the outlook for the coming months.

The GDPNow model from the Federal Reserve Bank of Atlanta forecasts the US GDP growth for the second quarter at 2.4%. This is higher than the result of the first quarter but significantly below expectations. The first estimate, which was presented in May, came out at 4.3%. At the time, it seemed that the positive momentum in the economy will develop but for two months in a row, the key macroeconomic indicators are worse than forecasts.

Image

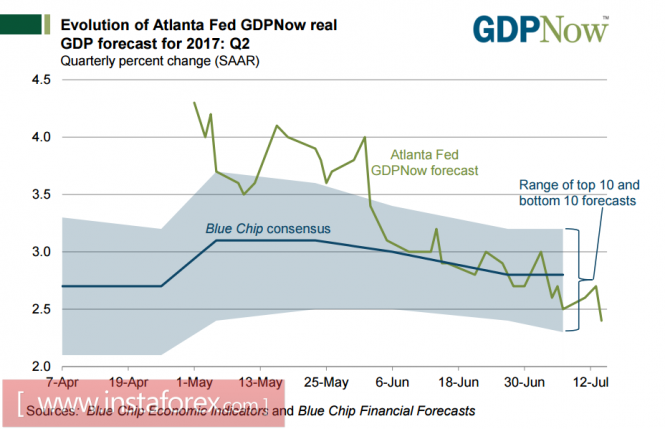
The Federal Reserve Bank of New York expects that GDP growth will be at 1.9% in Q2. However, this estimate may be too optimistic. At any rate, Fed Chairman Janet Yellen, speaking in Congress, said that achieving an economic growth of 3% "will be pretty hard." Recalling the basic scenario by the Congressional Budget Office (CBO), the average annual growth is set at 4%. Even in this case, the budget deficit in the next ten years will grow to 1.5 trillion dollars and reach a GDP of 5.2%. Weaker growth will significantly accelerate the development of a negative scenario. It can only be overcome through swift and decisive reforms while the situation develops in the opposite way. As indicated in the report of the Ministry of Finance published on Thursday, the budget deficit in June amounted to 90.233 billion dollar within the nine months of the current fiscal year. The negative balance grew by 31% and reached 523 billion. There is no reason to expect that the situation may change as the collection of taxes is reduced. Against the background of a drop in consumer activity, there is no chance of an increase of tax collection.

Actually, it was the reassessment of the player's prospects for the development of the situation that caused the dollar to fall sharply on Friday. It's not just a matter of low inflation. The fact is that even optimistic models (and the optimistic CBO forecast) do not see good exit scenarios. The Fed may begin to reduce the balance sheets in the coming months. In any case, the preparation of public opinion for this step is being carried out purposefully. Yesterday, the head of the Federal Reserve Bank of Dallas, Robert Kaplan, said that it is necessary to start reducing the Fed's balance sheet "very soon", possibly in September. Low inflation, in his opinion, is temporary. He also added that the achievement of full employment will contribute to higher prices.

The beginning of the reduction in the balance of the Fed means terminating the practice of refinancing revenues. In other words, the Fed will gradually reduce the repayment of government debts which, against the background of a growing budget deficit and a reduction in the collection of taxes, can have extremely unpleasant consequences for the Trump administration. In September, the government should already receive a result regarding the level of borrowing from the Congress. This will exhaust the latest resources for financing current activities and will make them face the prospect of technical default. However, in order for the Congress to meet Trump and raise the ceiling of national debt, it will be necessary to convince him of the feasibility plans for reforming the tax and health policies. It is necessary to present these plans formally.

Thus, for the dollar, there is still no reason to resume growth.

Analysis are provided byInstaForex.
Best regards, PR Manager

Learn more about InstaForex Company at http://instaforex.com
IFX Gertrude
 
Posts: 5198
Joined: Wed Nov 07, 2012 6:25 am

Re: Instaforex Analysis

Postby IFX Gertrude » Tue Jul 18, 2017 1:43 am

Technical analysis of EUR/USD for July 18, 2017

Image

When the European market opens, some Economic Data will be released, such as ZEW Economic Sentiment and German ZEW Economic Sentiment. The US will release the Economic Data, too, such as NAHB Housing Market Index and Import Prices m/m, so, amid the reports, EUR/USD will move in a low to medium volatility during this day.

TODAY'S TECHNICAL LEVEL:
Breakout BUY Level: 1.1528.
Strong Resistance:1.1521.
Original Resistance: 1.1510.
Inner Sell Area: 1.1499.
Target Inner Area: 1.1472.
Inner Buy Area: 1.1445.
Original Support: 1.1434.
Strong Support: 1.1423.
Breakout SELL Level: 1.1416.

Analysis are provided byInstaForex.
Best regards, PR Manager

Learn more about InstaForex Company at http://instaforex.com
IFX Gertrude
 
Posts: 5198
Joined: Wed Nov 07, 2012 6:25 am

Re: Instaforex Analysis

Postby IFX Gertrude » Wed Jul 19, 2017 1:50 am

Technical analysis of NZD/USD for July 19, 2017

Image

Overview:
The NZD/USD pair is showing signs of strength following a breakout of the highest level of 0.7307. On the H1 chart. the level of 0.7307 coincides with 61.8% of Fibonacci, which is expected to act as minor support today. Since the trend is above the 61.8% Fibonacci level, the market is still in an uptrend. So, major support is seen at the level of 0.7307. Furthermore, the trend is still showing strength above the moving average (100). Thus, the market is indicating a bullish opportunity above the above-mentioned support levels, for that the bullish outlook remains the same as long as the 100 EMA is headed to the upside. Therefore, strong support will be found at the level of 0.7307 providing a clear signal to buy with a target seen at 0.7372. If the trend breaks the minor resistance at 0.7372, the pair will move upwards continuing the bullish trend development to the level 0.7400 in order to test the daily resistance 1. However, it would also be sage to consider where to place a stop loss; this should be set below the second support of 0.7287.

Analysis are provided byInstaForex.
Best regards, PR Manager

Learn more about InstaForex Company at http://instaforex.com
IFX Gertrude
 
Posts: 5198
Joined: Wed Nov 07, 2012 6:25 am

Re: Instaforex Analysis

Postby IFX Gertrude » Thu Jul 20, 2017 1:57 am

Technical analysis of USD/JPY for July 20, 2017

Image

In Asia, Japan will release the BOJ Press Conference, All Industries Activity m/m, BOJ Policy Rate, BOJ Outlook Report, Monetary Policy Statement, and Trade Balance data, and the US will release some Economic Data, such as Natural Gas Storage, CB Leading Index m/m, Philly Fed Manufacturing Index, and Unemployment Claims. So, there is a probability the USD/JPY will move with low to medium volatility during this day.

TODAY'S TECHNICAL LEVEL:
Resistance. 3: 112.43.
Resistance. 2: 112.21.
Resistance. 1: 112.01.
Support. 1: 111.73.
Support. 2: 111.51.
Support. 3: 111.29.

Analysis are provided byInstaForex.
Best regards, PR Manager

Learn more about InstaForex Company at http://instaforex.com
IFX Gertrude
 
Posts: 5198
Joined: Wed Nov 07, 2012 6:25 am

Re: Instaforex Analysis

Postby IFX Gertrude » Fri Jul 21, 2017 1:48 am

Technical analysis of USD/CHF for July 21, 2017

Image

Overview:

The USD/CHF pair.
Pivot: 0.9590.
The swissy fell from the level of 0.9665 to bottom at 0.9523. The USD/CHF pair has faced strong support at the level of 0.9523 (the double bottom). Current price is around the spot of 0.9520. So, the strong support has been already faced at the level of 0.9523 and the pair is likely to try to approach it in order to test it again and form a double bottom. Hence, the USD/CHF pair is continuing to trade in a bullish trend from the new support level of 0.9523; to form a bullish channel. According to the previous events, we expect the pair to move between 0.9523 and 0.9665. Also, it should be noted major resistance is seen at 0.9665, while immediate resistance is found at 0.9590. Then, we may anticipate potential testing of 0.9665 to take place soon. Moreover, if the pair succeeds in passing through the level of 0.9665, the market will indicate a bullish opportunity above the level of 0.9665. A breakout of that target will move the pair further upwards to 0.9746. Buy orders are recommended above the area of 0.9523 with the first target at the level of 1.9590 and continue towards the levels of 0.9665 and 0.9746. However, if the USD/CHF pair fails to break out through the resistance level of 1.9590; the market will decline further to the level of 0.9453.

Analysis are provided byInstaForex.
Best regards, PR Manager

Learn more about InstaForex Company at http://instaforex.com
IFX Gertrude
 
Posts: 5198
Joined: Wed Nov 07, 2012 6:25 am

Re: Instaforex Analysis

Postby IFX Yvonne » Mon Jul 24, 2017 3:14 am

NZD/USD Intraday technical levels and trading recommendations for July 24, 2017

Image

Daily Outlook

The NZD/USD pair has been trending up within the depicted bullish channel since January 2016.

In November 2016, early signs of bullish weakness were expressed on the chart when the pair failed to record a new high above 0.7400.

A bearish breakout of the lower limit of the channel took place in December 2016. In February 2017, the depicted short-term downtrend was initiated in the depicted supply zone (0.7310-0.7380).

However, a recent bullish breakout above the downtrend line took place in May 22. Since then, the market has been bullish as depicted on the chart.

The price zone of 0.7150-0.7230 (SUPPLY ZONE in confluence with 61.8% Fibonacci level) stood as a temporary resistance zone until a bullish breakout was expressed above 0.7230.

This resulted in a quick bullish advance towards the next supply zone around 0.7310-0.7380 which is being temporarily breached to the upside.

Now the price zone of 0.7310-0.7380 turns to be a newly-established demand-zone to be watched for possible bullish rejection if any bearish pullback occurs.

InstaForex analytical reviews will make you fully aware of market trends!
Being an InstaForex client, you are provided with a large number of free services for efficient trading.
Best Regards,
PR Manager
InstaForex Companies Group
User avatar
IFX Yvonne
 
Posts: 287
Joined: Sat Mar 02, 2013 12:23 am

Re: Instaforex Analysis

Postby IFX Yvonne » Tue Jul 25, 2017 3:12 am

AUD/USD prepare to sell on break of key support

The price is hovering above key support at 0.7871 (Fibonacci retracement, horizontal swing low support) and we prepare to sell once price breaks this key level. Our profit target is a push down to next key support level at 0.7741 (Fibonacci retracement, horizontal pullback support).

RSI (55) is seeing bearish momentum within its bearish descending channel.

Sell below 0.7871. Stop loss is at 0.7937. Take profit is at 0.7741.

Image

InstaForex analytical reviews will make you fully aware of market trends!
Being an InstaForex client, you are provided with a large number of free services for efficient trading.
Best Regards,
PR Manager
InstaForex Companies Group
User avatar
IFX Yvonne
 
Posts: 287
Joined: Sat Mar 02, 2013 12:23 am

Re: Instaforex Analysis

Postby IFX Yvonne » Wed Jul 26, 2017 3:29 am

USD/CHF profit target reached perfectly, prepare to sell

The price has shot up perfectly and reached our profit target from yesterday. We prepare to sell below major resistance at 0.9530 (Fibonacci retracement, Fibonacci extension, horizontal pullback resistance) for a push down to at least 0.9436 support (Fibonacci extension, horizontal swing low support).

Stochastic (55,5,3) is right on major resistance at 95%.

Sell below 0.9530. Stop loss is at 0.9563. Take profit is at 0.9436.

Image

InstaForex analytical reviews will make you fully aware of market trends!
Being an InstaForex client, you are provided with a large number of free services for efficient trading.
Best Regards,
PR Manager
InstaForex Companies Group
User avatar
IFX Yvonne
 
Posts: 287
Joined: Sat Mar 02, 2013 12:23 am

Re: Instaforex Analysis

Postby IFX Gertrude » Thu Jul 27, 2017 2:00 am

Technical analysis of EUR/USD for July 27, 2017

Image

When the European market opens, some Economic Data will be released, such as Private Loans y/y, M3 Money Supply y/y, GfK German Consumer Climate, and Spanish Unemployment Rate. The US will release the Economic Data, too, such as Natural Gas Storage, Prelim Wholesale Inventories m/m, Goods Trade Balance, Durable Goods Orders m/m, Unemployment Claims, and Core Durable Goods Orders m/m, so, amid the reports, EUR/USD will move in a low to medium volatility during this day.

TODAY'S TECHNICAL LEVEL:
Breakout BUY Level: 1.1787.
Strong Resistance:1.1780.
Original Resistance: 1.1769.
Inner Sell Area: 1.1758.
Target Inner Area: 1.1730.
Inner Buy Area: 1.1702.
Original Support: 1.1691.
Strong Support: 1.1680. Breakout SELL Level: 1.1673.

Analysis are provided byInstaForex.
Best regards, PR Manager

Learn more about InstaForex Company at http://instaforex.com
IFX Gertrude
 
Posts: 5198
Joined: Wed Nov 07, 2012 6:25 am

Re: Instaforex Analysis

Postby IFX Gertrude » Fri Jul 28, 2017 1:09 am

Technical analysis of USD/CHF for July 28, 2017

Image

Overview:

The USD/CHF pair broke resistance which turned to a strong support at the level of 0.9579 yesterday. The level of 0.9579 coincides with 38.2% of Fibonacci, which is expected to act as a major support today. Since the trend is above the 38.2% Fibonacci level, the market is still in an uptrend. From this point, the USD/CHF pair is continuing in a bullish trend from the new support of 0.9575. Currently, the price is in a bullish channel. According to the previous events, we expect the USD/CHF pair to move between 0.9579 and 0.9728. In the H4 chart, resistance is seen at the levels of 0.9666 and 0.9728. Also, it should be noticed that the level of 0.9666 represents the daily pivot point. Therefore, a strong support will be formed at the level of 0.9575 providing a clear signal to buy with the targets seen at 0.9666. If the trend breaks the support at 0.9666 (the first resistance), the pair will move upwards continuing the development of the bullish trend to the level 0.9728 in order to test the daily resistance 2. However, the stop loss is to be placed below the level of 0.952.

Analysis are provided byInstaForex.
Best regards, PR Manager

Learn more about InstaForex Company at http://instaforex.com
IFX Gertrude
 
Posts: 5198
Joined: Wed Nov 07, 2012 6:25 am

PreviousNext

Return to Forex Brokers


cron