Instaforex Analysis

Forex broker related topics and discussions

Re: Instaforex Analysis

Postby IFX Gertrude » Wed Dec 16, 2020 2:47 am

Forex Analysis & Reviews: Forecast for AUD/USD on December 16, 2020

AUD/USD
The Australian dollar took advantage once again of the delay in the offensive of the US currency (or does not believe in it) and went up to 26 points yesterday. But this growth in technical terms has not changed anything, the price divergence with the Marlin oscillator remains, the upper and the lower targets remain unchanged. Today, the Fed's FOMC is more likely to announce a reduction in the QE program or at least an intention to do so in January. Such a statement should cool the ardor of speculators. We are waiting for the decline of the Australian to the nearest support of 0.7500 (low of December 2017), then to 0.7440.

Image

Based on the four-hour chart, the Marlin oscillator does not reduce confidence in the downward trend section, declining in its own channel. The Kruzenshtern line is approaching the target level of 0.7500, this level is of particular importance and its overcoming can provoke an accelerated fall in the price.

Image

Analysis are provided byInstaForex.
Best regards, PR Manager

Learn more about InstaForex Company at http://instaforex.com
IFX Gertrude
 
Posts: 5198
Joined: Wed Nov 07, 2012 6:25 am

Re: Instaforex Analysis

Postby IFX Gertrude » Thu Dec 17, 2020 2:28 am

Forex Analysis & Reviews: Ichimoku cloud indicator analysis of Gold

Gold price is once again moving higher above the key resistance of $1,850. If bulls manage to hold above $1,850 and break above recent highs at $1,874, we should then expect a move towards $1,900 and higher.

Image

Gold price has made an important higher low at $1,820 and is now breaking above the Ichimoku cloud once again. This is a bullish sign. Support is at $1,847 and next at $1,820. Gold bulls need to defend these two levels. Breaking below $1,820 will bring Gold price below $1,800. However so far this is not the most probable scenario. The most probable scenario for now is a move above $1,874 towards $1,913-31. Both tenkan-sen (Red line indicator) and the kijun-sen (yellow line indicator) are below price. The Chikou span (black line indicator) is above the candlestick body. This is also bullish. All signs in the 4 hour chart support the bullish case.

Analysis are provided byInstaForex.
Best regards, PR Manager

Learn more about InstaForex Company at http://instaforex.com
IFX Gertrude
 
Posts: 5198
Joined: Wed Nov 07, 2012 6:25 am

Re: Instaforex Analysis

Postby IFX Gertrude » Fri Dec 18, 2020 12:57 am

Forex Analysis & Reviews: Forecast for USD/JPY on December 18, 2020

USD/JPY
Yesterday, the yen moved under the target level of 103.18, but failed to settle below it. This morning the price is already above this level and it may not fall towards the target of 102.35. In order to move to the first target along the MACD line in the 104.10 area, there are still no conditions on the lower timeframe. The situation is neutral.

Image

The growth rates are higher, and being able to settle above the embedded price channel line (104.42), paves the way for the price to reach the upper line of the price channel in the 105.70 area, but it is too early to talk about it. There is a 60% probability that the price can return to the area under 103.18 and continue to decline to the target of 102.35.

Image

The four-hour chart shows that the first reversal signal will appear when the signal line of the Marlin oscillator goes into the positive area, and in order to do so the price needs to rise by about 30 points, which will correspond to the price of 103.60, and this is already close to the MACD line (107.75). When making a decision to buy, we recommend that you wait until the price goes above this indicator line. The current situation is not trading.

Analysis are provided byInstaForex.
Best regards, PR Manager

Learn more about InstaForex Company at http://instaforex.com
IFX Gertrude
 
Posts: 5198
Joined: Wed Nov 07, 2012 6:25 am

Re: Instaforex Analysis

Postby IFX Gertrude » Mon Dec 21, 2020 3:46 am

Forex Analysis & Reviews: Technical Analysis of ETH/USD for December 21, 2020


Image

Crypto Industry News:
A recently released US Department of Justice audit of the practices of the Federal Bureau of Investigation (FBI) in relation to Darknet criminal investigations found law enforcement in a mess - with an overarching "cryptocurrency support strategy."

According to the public version of the audit released on Thursday, the FBI's current efforts to investigate the Dark Web are - perhaps ironically - hampered by a "decentralized" set of practices, policies and training programs, and fragmented intelligence leading to "redundant" efforts.

In particular, the audit found that there are two separate virtual currency teams to assist with investigations into the Dark Web, both of which are funded by the Department of Justice's Asset Forfeiture Fund. In addition, "rising costs and continued funding from the Fund caused a dispute between the two Virtual Currency Teams on resource prioritization" and many felt the teams were carrying out overlapping work.

The fund receives a portion of its funds by seizing and selling property and assets, including cryptocurrencies, related to criminal investigations. The Department of Justice has issued five recommendations to streamline investigations and policies on the Darknet, many of which focus on centralizing procedures to reduce "ambiguous or overlapping investigative obligations". This includes the recommendation to "develop a timeframe to obtain feedback from the rest of the FBI and complete the development of cryptocurrency support strategies across the FBI." The report also indicated that such a schedule was approaching.

Technical Market Outlook:
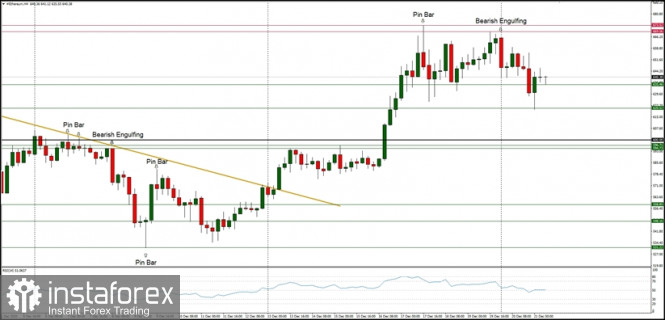
After the ETH/USD pair had made a new swing high at the level of $673.52, the bulls experienced slight problems with momentum. The market has made a Pin Bar candle at the top of the rally at the H4 time frame chart, so now the local pull-back is in progress. The bearish have managed to push the price to the level of $620.52 before the bounce. The momentum has declined, but is still strong and positive, so the bulls might attack the level of $700 again soon. The next technical resistance is seen at the level of $673.52 and the technical support is located at $635.46 and $620.52.

Weekly Pivot Points:
WR3 - $777.02
WR2 - $722.62
WR1 - $678.76
Weekly Pivot - $626.41
WS1 - $580.02
WS2 - $527.98
WS3 - $482.35

Trading Recommendations:
The up trend on the Ethereum continues and the next long term target for ETH/USD is seen at the level of $700, so any correction or local pull-back should be used to open the buy orders. Nevertheless, the momentum has decreased recently on the lower time frames and volatility is not that great either. The bulls has hit the 38% Fibonacci retracement located at the level of $587.87 on the weekly time frame chart, but the current up trend is still active. This scenario is valid as long as the level of $360 is broken.

Analysis are provided byInstaForex.
Best regards, PR Manager

Learn more about InstaForex Company at http://instaforex.com
IFX Gertrude
 
Posts: 5198
Joined: Wed Nov 07, 2012 6:25 am

Re: Instaforex Analysis

Postby IFX Gertrude » Tue Dec 22, 2020 3:29 am

Forex Analysis & Reviews: Forecast for EUR/USD on December 22, 2020

EUR/USD
The euro fell by 126 points on Monday and by the end of the day it practically won back the entire fall. The fall was bought out in large volumes by the largest players in order to avoid an uncontrolled collapse. All this happened on the news about the readiness of British Prime Minister Boris Johnson to back down in the fishing dispute with the EU, setting the quota at 66% of the current volume.

Image

The daily chart shows that the reversal divergence of the price and the oscillator remains. Marlin continued to move down, trying to get out of the growth zone. The downside target at 1.2040 that was formed by the price channel line is still present. However, there is a possibility of forming a double divergence. At the same time, the price will try to rush to the target level of 1.2330 and only then will it reverse into a medium-term decline.

Image

The four-hour chart shows that the price fell below the MACD line, then went back above it, and is currently preparing to move below it. Also, the Marlin oscillator, after the signal line went into the negative area, returned to the growth area and intends to fall again. The condition for accomplishing this move is for the price to fall below the MACD line, under 1.2205. If this condition is not met, then the double divergence option is implemented.

Analysis are provided byInstaForex.
Best regards, PR Manager

Learn more about InstaForex Company at http://instaforex.com
IFX Gertrude
 
Posts: 5198
Joined: Wed Nov 07, 2012 6:25 am

Re: Instaforex Analysis

Postby IFX Gertrude » Wed Dec 23, 2020 2:45 am

Forex Analysis & Reviews: Forecast for EUR/USD on December 23, 2020

EUR/USD
Yesterday, the single European currency fell by 80 pips. Trading volumes were above average, which can already indicate direct sales of the euro. The option with double divergence, which we allowed yesterday, is canceled, since the signal line of the Marlin oscillator has already come close to the border with a negative trend and the transition beyond it will give a new impetus to the decline. The target of the decline is determined by the range 1.1985-1.2040, it is determined by the indicator line of the MACD and the embedded line of the price channel of the weekly timeframe. Breaking the range opens the target of 1.1885 (October 21 high).

Image

On the four-hour scale, the price is fixed under the lines of the balance indicator (red) and MACD (blue) indicator, the Marlin oscillator is declining. We are waiting for the development of a downward trend in the target area.

Image

Analysis are provided byInstaForex.
Best regards, PR Manager

Learn more about InstaForex Company at http://instaforex.com
IFX Gertrude
 
Posts: 5198
Joined: Wed Nov 07, 2012 6:25 am

Re: Instaforex Analysis

Postby IFX Gertrude » Fri Dec 25, 2020 1:24 am

JAPAN'S HOUSING STARTS FALL AT SLOWER PACE

Image

Japan's housing starts continued to decline in November albeit at a slower pace, data from the Ministry of Land, Infrastructure, Transport and Tourism showed on Friday.

Housing starts were down 3.7 percent on year, following October's 8.3 percent decline. This was also better than the expected decrease of 4.9 percent.

Annualized housing starts rose to 820,000 in November from 802,000 in the previous month.

Further, data showed that construction orders received by the big 50 contractors decreased 4.7 percent on a yearly basis, bigger than the 0.1 percent fall posted in October.

News are provided by
InstaForex
.
Best regards, PR Manager

Learn more about InstaForex Company at http://instaforex.com
IFX Gertrude
 
Posts: 5198
Joined: Wed Nov 07, 2012 6:25 am

Re: Instaforex Analysis

Postby IFX Gertrude » Fri Dec 25, 2020 1:41 am

Forex Analysis & Reviews: Forecast for USD/JPY on December 25, 2020

USD/JPY
USD/JPY gained 13 points within the trading range of the last three days. Today the Japanese trading floors are open, at the moment the pair is quoted at 103.54, that is, it is already 14 points lower than yesterday's close. Japanese investors seem to be preparing for a negative turn of events from the opening of the new week. We keep our previous forecast that the price will move under the 103.18 level and its successive decline to 102.35.

Image

The four-hour chart shows that the signal line of the Marlin oscillator has already reached the top of its own wedge. Exit from the wedge, respectively, we wait downward, the oscillator will soon leave the negative zone and accelerate the fall.

Image

Analysis are provided byInstaForex.
Best regards, PR Manager

Learn more about InstaForex Company at http://instaforex.com
IFX Gertrude
 
Posts: 5198
Joined: Wed Nov 07, 2012 6:25 am

Re: Instaforex Analysis

Postby IFX Gertrude » Mon Dec 28, 2020 2:27 am

Forex Analysis & Reviews: Forecast for EUR/USD on December 28, 2020

EUR/USD
No significant changes in the market over the past four holidays. The market is thin, and after tense expectations about Brexit, investors want to be compensated for their efforts. Therefore, the price breakdown, which we expected earlier, is possible. If there is no breakout, then we are waiting for calmer movement to the first target of 1.1995 - this is the support of the MACD line on the daily chart. For a more stable decline in price, the transition of the Marlin oscillator to the zone of negative values is not enough. This may happen after the quotes drop below 1.2150.

Image

The four-hour chart shows that the euro's general sentiment is for it to fall, but the signal line of the Marlin oscillator is bent up suspiciously strongly, indicating an intention to enter the positive zone. If this happens, then the price will also surpass the MACD indicator line to the upside, which will entail some more growth in the free roaming area, because the market remains thin. Until it ceases to freely roam around (which will not be long), we are waiting for the downward trend to resume for all indicators.

Image

Analysis are provided byInstaForex.
Best regards, PR Manager

Learn more about InstaForex Company at http://instaforex.com
IFX Gertrude
 
Posts: 5198
Joined: Wed Nov 07, 2012 6:25 am

Re: Instaforex Analysis

Postby IFX Gertrude » Tue Dec 29, 2020 2:41 am

Forex Analysis & Reviews: Forecast for EUR/USD on December 29, 2020

EUR/USD
The euro gained 32 points on Monday, staying in the range of December 22nd. There are fewer signs of a downside breakout. Perhaps there won't be one, the price will spend the final days of 2020 in the range of 18-21. The price divergence with the Marlin oscillator is still present, the first significant target is determined by the MACD line at 1.1990.

Image

The four-hour chart shows that the price winds up on the MACD line, which is also a sign that the price is in the range. The signal line of the Marlin oscillator is similarly curved around the zero neutral line. If the price moves below 1.2180, it will be a sign of the first attempt to break through.

Image

Analysis are provided byInstaForex.
Best regards, PR Manager

Learn more about InstaForex Company at http://instaforex.com
IFX Gertrude
 
Posts: 5198
Joined: Wed Nov 07, 2012 6:25 am

PreviousNext

Return to Forex Brokers


cron