Instaforex Analysis

Forex broker related topics and discussions

Re: Instaforex Analysis

Postby IFX Gertrude » Thu Aug 13, 2020 2:51 am

Control zones for EURUSD on 08/13/20

We are testing the WCZ 1/2 1.1811-1.1802 today, which is a defining moment when building a trading plan. If today's trade closes below the zone, then sales of the instrument will come to the fore, and the first target of the fall will be the current week's low.

Image

Working in a downward direction will make it possible for us to continue forming a downward compensatory pattern, the goal of which is to return to the monthly control zone in July.

If today's trade closes above the WCZ 1/2, it will enable us to look for purchases at tomorrow's European session. The growth target will be the weekly CZ 1.1911-1.1893. Working in an upward direction will not violate the accumulation zone that has already formed. The main growth boundary is still the monthly high.

Image

.Daily CZ - daily control zone. The area formed by important data from the futures market, which changes several times a year.

Weekly CZ - weekly control zone. The zone formed by important marks of the futures market, which changes several times a year.

Monthly CZ - monthly control zone. The zone, which is a reflection of the average volatility over the past year.

Analysis are provided byInstaForex.
Best regards, PR Manager

Learn more about InstaForex Company at http://instaforex.com
IFX Gertrude
 
Posts: 5198
Joined: Wed Nov 07, 2012 6:25 am

Re: Instaforex Analysis

Postby IFX Gertrude » Fri Aug 14, 2020 2:47 am

Forecast for EUR/USD on August 14, 2020

EUR/USD
The euro's 28 points gain from yesterday plunged into a wide range of uncertainty and wandered through 1.1710-1.1906. The Marlin oscillator is directed downwards on the daily chart, and the price is exactly at the 1.1806 target level. The price could reach the upper border of the price channel at 1.1906 without a critical upward reversal of the oscillator. The price may even cross this border and a double divergence will not form according to the oscillator, which creates increased uncertainty for the currency pair.

Image

For a medium-term downward movement, it is no longer enough for the price to gain a foothold below the 1.1806 level, it should consolidate below the lower border of the 1.1710 range.

The situation is no less uncertain on the four-hour chart. The Marlin oscillator is in the growth zone, the price is above the balance line, but below the MACD line.

Trading the euro today and even on Monday is associated with increased risk.

Analysis are provided byInstaForex.
Best regards, PR Manager

Learn more about InstaForex Company at http://instaforex.com
IFX Gertrude
 
Posts: 5198
Joined: Wed Nov 07, 2012 6:25 am

Re: Instaforex Analysis

Postby IFX Gertrude » Mon Aug 17, 2020 2:33 am

Forecast for EUR/USD on August 17, 2020

EUR/USD The euro continued to develop in the uncertain range of 1.1712-1.1903 on Friday. The euro will continue to increase if the price goes above the upper limit of the price channel at 1.1903, and in this case, the target range will be 1.2040/55. Historically, the range corresponds to the low of July 2012. The price reaching the specified range can also mean that a double diverenge on the Marlin oscillator can form. That is, the euro growing by two figures will not cancel the main scenario of a currency reversal in the medium and long term.

Image

The price falling below the lower border of the range will mean that it is out of the free roaming zone and the first target will be the level of 1.1620, then 1.1490. The price divergence with the Marlin oscillator will increase, the signal line will enter the zone of negative values, and this will lead to an accelerated fall in the euro.

Image

The price consolidated above the MACD indicator line on the four-hour chart, Marlin is also in the growth zone, which together maintains an increased probability of growth to 1.1903. Nevertheless, since the price is in the free roaming zone, it can once again go under this line, as it was on August 13-14. We are waiting for the development of events.

Analysis are provided byInstaForex.
Best regards, PR Manager

Learn more about InstaForex Company at http://instaforex.com
IFX Gertrude
 
Posts: 5198
Joined: Wed Nov 07, 2012 6:25 am

Re: Instaforex Analysis

Postby IFX Gertrude » Tue Aug 18, 2020 3:01 am

Forecast for USD/JPY on August 18, 2020

USD/JPY
The Japanese yen sharply accelerated the pace of its strengthening (decline on the chart) after breaking the MACD line on a daily chart. There are about 20 points left to the nearest goal along the 105.45 price channel. The signal line of the Marlin oscillator has entered the negative trend zone, which creates the risk of continuing to pull down the price to the second target of 104.60.

The price has consolidated below the MACD indicator line on the four-hour chart, which also increases the likelihood of overcoming the 105.45 level. But the Marlin oscillator is already entering the oversold zone, which may be a signal for a reversal from the first target level of 105.45.

So: if the price settles below the 105.45 level, we are waiting for the price to fall to the second target of 104.60, consolidating the price above 106.12 will mean restoring growth to 106.70 with a repeated attempt to overcome 107.00.

Analysis are provided byInstaForex.
Best regards, PR Manager

Learn more about InstaForex Company at http://instaforex.com
IFX Gertrude
 
Posts: 5198
Joined: Wed Nov 07, 2012 6:25 am

Re: Instaforex Analysis

Postby IFX Gertrude » Wed Aug 19, 2020 2:51 am

Analysis and trading recommendations for the EUR/USD pair on August

Trading recommendations for EUR / USD on August 19 Analysis of transactions Bulls were active at the level of 1.1895 yesterday, as a result of which the quote reached the target level of 1.1933. Such brought profit of about 35 pips within the day.

Image

This sharp rise in the euro came after US Treasury Secretary Steven Mnuchin said that there was no expected progress in the negotiations between Republicans and Democrats with regards to a new stimulus package.

Image

Set up buy deals when the quote reaches the price level of 1.1954 (green line on the chart), targeting a rise towards the level of 1.1999. The increase may occur, on the grounds of good inflation data in the eurozone. Take profit at the level of 1.1999. Meanwhile, sell positions after the quote hits a price level of 1.1911 (red line on the chart), aiming a drop to a price of 1.1858. However, such a scenario has a low chance of occurring since aside from inflation data, the latest Fed protocol will also be published today, the contents of which is forecast to put additional pressure on the US dollar. Nonetheless, take profit at the level of 1.1858.

Analysis are provided byInstaForex.
Best regards, PR Manager

Learn more about InstaForex Company at http://instaforex.com
IFX Gertrude
 
Posts: 5198
Joined: Wed Nov 07, 2012 6:25 am

Re: Instaforex Analysis

Postby IFX Gertrude » Thu Aug 20, 2020 2:40 am

Forecast for GBP/USD on August 20, 2020

GBP/USD After the British pound gained 135 points on Wednesday and Thursday, this growth was offset by a fall of 140 points. This figure of two extreme candlesticks is called the pattern of rails, a reversal pattern. Also, the Marlin Oscillator formed a divergence with the price.

Image

The closest target for the pound is the 61.8% Fibonacci level at 1.3026, where the British currency has already found support in the period from August 3 to 13. That is, the level is strong enough, and breaking it will send the price to the second target of 1.2912 (76.4% Fibonacci). The main struggle will unfold on the daily MACD line in the 1.2812 area, which is also the price peak from June 10. Overcoming this level reveals the scenario of a medium-term fall of the British currency.

Image

The price settled below the Fibonacci level of 50.0% on the four-hour chart and below the MACD indicator line, which clears the way for the price to 1.3026.


Analysis are provided byInstaForex.
Best regards, PR Manager

Learn more about InstaForex Company at http://instaforex.com
IFX Gertrude
 
Posts: 5198
Joined: Wed Nov 07, 2012 6:25 am

Re: Instaforex Analysis

Postby IFX Gertrude » Fri Aug 21, 2020 2:19 am

Technical Analysis of EUR/USD for August 21, 2020

Technical Market Outlook:
The EUR/USD pair has bounced from the level of 1.1803 which is still a technical support for the price and had retraced 50% of the last wave down already. The momentum is positive and the market is bouncing from the oversold conditions, so another wave up is still on the table befroe the week ends. The next target for bulls is seen at the level of 1.1908 - 1.1915 and the immediate technical support is located at the level of 1.1822, 1.1813, 1.1803 and 1.1790. The larger time frmae trend remains up.

Weekly Pivot Points:
WR3 - 1.2065
WR2 - 1.1962
WR1 - 1.1908
Weekly Pivot - 1.1808
WS1 - 1.1753
WS2 - 1.1661
WS3 - 1.1600

Trading Recommendations:
On the EUR/USD pair the main trend is up, which can be confirmed by 8 weekly up candles on the weekly time frame chart and 3 monthly up candles on the monthly time frame chart. This means any corrections should be used to buy the dips. The key long-term technical support is seen at the level of 1.1445. The key long-term technical resistance is seen at the level of 1.2555.

Image

Analysis are provided byInstaForex.
Best regards, PR Manager

Learn more about InstaForex Company at http://instaforex.com
IFX Gertrude
 
Posts: 5198
Joined: Wed Nov 07, 2012 6:25 am

Re: Instaforex Analysis

Postby IFX Gertrude » Mon Aug 24, 2020 2:27 am

Technical Analysis of EUR/USD for August 24, 2020

Technical Market Outlook:
The EUR/USD pair dropped below 61% Fibonacci retracement level again and made a new local low at the level of 1.1754. The market is still in a horizontal trading range, so the bulls still have a chance to bounce higher. The next target for them is seen at the level of 1.1822 and 1.1882. In order to make a new high, the bulls will have to break through the short-term trend line resistance seen at the level of 1.1900. The immediate technical support is located at the level of 1.1720 and 1.1710. The larger time frame trend remains up.

Weekly Pivot Points:
WR3 - 1.2107
WR2 - 1.2031
WR1 - 1.1883
Weekly Pivot - 1.1825
WS1 - 1.1682
WS2 - 1.1616
WS3 - 1.1470

Trading Recommendations:
On the EUR/USD pair the main trend is up, which can be confirmed by 8 weekly up candles on the weekly time frame chart and 3 monthly up candles on the monthly time frame chart. This means any corrections should be used to buy the dips. The key long-term technical support is seen at the level of 1.1445. The key long-term technical resistance is seen at the level of 1.2555.

Image

Analysis are provided byInstaForex.
Best regards, PR Manager

Learn more about InstaForex Company at http://instaforex.com
IFX Gertrude
 
Posts: 5198
Joined: Wed Nov 07, 2012 6:25 am

Re: Instaforex Analysis

Postby IFX Gertrude » Tue Aug 25, 2020 3:15 am

Technical Analysis of ETH/USD for August 25, 2020

Crypto Industry News:

Coinbase and Apple are still not getting along months after Coinbase warned customers it might remove the app from the Apple Store.

Coinbase CEO Brian Armstrong tweeted that Apple continues to block some cryptocurrency features, including the ability to make money and unlimited decentralized applications (dApp) of the browser:

"Apple has been very restrictive and hostile to cryptocurrencies over the years. They still block some features now, including the ability to make money with cryptocurrency through task execution and unlimited Dapp browsers," Armstrong said.

In December, Coinbase warned its customers that it might be necessary to remove the dApp browser from its app to comply with Apple App Store policies. At the time, both Apple and the Google Play Store with Android apps wanted to remove dApps from their network.

Apple, especially its App Store, has been under fire recently due to unfair terms it imposes on app developers and publishers. The Wall Street Journal, The New York Times and game developer Epic Games have called on Apple to find fairer conditions for developers.

Technical Market Outlook:
The ETH/USD pair has hit the target seen at the level of $407.03 - $414.11 with a local top at the level of $409.67 and then was capped. Currently, the price is trading below the level of $400 and the next target for bears is seen at the level of $396.45 (itraday techncial support). The momentum keeps increasing as the market bounces from the oversold conditions as well. All the bigger time frame charts looks very bullish and the up trend should be continued after the correction is completed.

Weekly Pivot Points:
WR3 - $491.79
WR2 - $470.70
WR1 - $424.12
Weekly Pivot - $402.20
WS1 - $357.21
WS2 - $333.72
WS3 - $286.54

Trading Recommendations:
The weekly and monthly time frame trend on the ETH/USD pair remains up and there are no signs of trend reversal, so buy orders are preferred in the mid-term. All the dynamic corrections are still being used to buy the dips. The next mid-term target for bulls is seen at the level of $500. The key mid-term technical support is seen at the level of $364.95.

Image

Analysis are provided byInstaForex.
Best regards, PR Manager

Learn more about InstaForex Company at http://instaforex.com
IFX Gertrude
 
Posts: 5198
Joined: Wed Nov 07, 2012 6:25 am

Re: Instaforex Analysis

Postby IFX Gertrude » Wed Aug 26, 2020 2:20 am

Technical Analysis of ETH/USD for August 26, 2020

Crypto Industry News:
The People's Bank of China plans to use its digital currency at the 2022 Winter Olympics in Beijing.

According to a Reuters report, Sun Guofeng, head of the PBoC's monetary policy department, said the bank did not have a schedule to introduce digital currency. However, according to Sun's statement, the PBoC will likely launch it ahead of the 2022 Winter Olympics as they plan to use it at an international sporting event.

The news comes as China is ramping up pilot projects for the digital yuan. Currently, China's central bank is testing its digital currency in Shenzhen, Suzhou, Xiongan and Chengdu. The bank also planned to introduce a digital currency for pilot tests in other regions, including Beijing, Tianjin, Hebei and the Greater Bay area of Hong Kong.

A recent official statement from the bank also noted that the digital yuan was only tested for small retail transactions. Debunking rumors about the impossibility of converting digital currency into banknotes, the central bank also clarified that digital yuan is legal tender that users can convert into banknotes at a 1: 1 ratio.

While there is still too little information on the Chinese digital currency to say anything about its launch and use cases, it is fairly obvious that the bank is making rapid progress towards its introduction.

Technical Market Outlook:
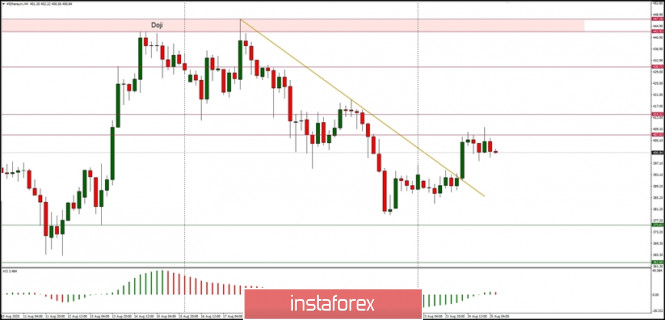
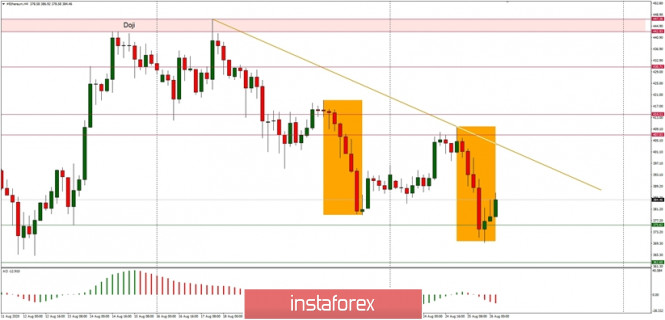
The ETH/USD pair has made another lower low at the level of $369.51, which was in line with 1:1 market geometry target for correction. Currently, the bulls are trying to bounce higher towards the level of $400 in order to reclaim it again, but if they fail, then a new local low should be made. The intraday technical support is seen at the level of $375.62 and the nearest technical resistance is seen at the level of $385.98. All the bigger time frame charts looks very bullish and the up trend should be continued after the correction is completed.

Weekly Pivot Points: WR3 - $491.79
WR2 - $470.70
WR1 - $424.12
Weekly Pivot - $402.20
WS1 - $357.21
WS2 - $333.72
WS3 - $286.54

Trading Recommendations:
The weekly and monthly time frame trend on the ETH/USD pair remains up and there are no signs of trend reversal, so buy orders are preferred in the mid-term. All the dynamic corrections are still being used to buy the dips. The next mid-term target for bulls is seen at the level of $500. The key mid-term technical support is seen at the level of $364.95.

Image

Analysis are provided byInstaForex.
Best regards, PR Manager

Learn more about InstaForex Company at http://instaforex.com
IFX Gertrude
 
Posts: 5198
Joined: Wed Nov 07, 2012 6:25 am

PreviousNext

Return to Forex Brokers


cron