Instaforex Analysis

Forex broker related topics and discussions

Re: Instaforex Analysis

Postby IFX Bella » Wed Mar 13, 2024 8:53 am

Indicator Analysis of GBP/USD on March 13, 2024

Image

Today, the price may move upward from the level of 1.2789 (closing of yesterday's daily candle) to the 14.6% pullback level at 1.2837 (yellow dotted line). In the case of testing this level, a continued upward movement is possible to the historical resistance level at 1.2847 (blue dotted line). Alternatively, from the level of 1.2789 (closing of yesterday's daily candle), the price may move upward to the 14.6% pullback level at 1.2837 (yellow dotted line). In the case of testing this level, a downward movement is possible to the historical resistance level at 1.2772 (blue dotted line).

Analysis are provided byInstaForex.

Read more: https://ifxpr.com/3wRMzLL
IFX Bella
 
Posts: 97
Joined: Sat Dec 08, 2012 12:39 am

Re: Instaforex Analysis

Postby IFX Bella » Thu Mar 14, 2024 6:57 am

Forex Analysis & Reviews: GBP/USD. March 14th. The UK GDP provided positive results, but traders have taken a new break

Image

On the hourly chart, the GBP/USD pair traded exclusively horizontally on Wednesday. It traded in the range of 1.2788–1.2801. There were no advantages for either bears or bulls on Wednesday, and neither category of traders attempted to take active action during the day. Thus, the zone of 1.2788–1.2801 cannot currently be considered a source of trading signals. The pair failed to rebound from it or consolidate above it.

The wave situation has been clear recently. The bulls have launched an active offensive, and we have already seen three consecutive upward waves. The last upward wave managed to break through the previous peak from February 22nd, so there are currently no signs of a trend change to "bearish." The sideways movement seems to be over since the pound has risen above all the peaks of the past few months. However, the risk of a resumption of sideways movement remains if bears launch their offensive from current levels. The last downward wave is too weak compared to the previous upward wave. The pair needs to decline at least to the level of 1.2584 to show the first sign of a trend change to "bearish." Alternatively, the new upward wave should not break the peak on March 8th. On Wednesday, the GDP volume for January was announced in the UK. The British economy grew by 0.2%, as traders expected. Industrial production decreased by 0.2% in volume, which was below market expectations. However, the first report did not help the pound resume its growth, and the second report did not provide sufficient grounds for bears to launch an offensive. There were no significant events in America yesterday. Today, we expect several reports from the US, but trader activity is currently extremely low, so I do not expect strong exchange rate fluctuations.

On the 4-hour chart, the pair consolidated above the corrective level of 61.8% (1.2745), which allows us to count on further growth towards the level of 1.3044. The pound has risen very strongly over the past few weeks, practically without informational support. The strength of the bulls may be waning. There are no emerging divergences observed in any of the indicators today. A rebound of quotes from the level of 1.2745 may increase the pair's chances of continuing to rise, but a consolidation below this level will work in favor of the US dollar and improve the chances of bears.

On Thursday, the economic events calendar contains only three interesting but not the most important entries. The impact of the information background on market sentiment today may be weak. Forecast for GBP/USD and trader advice: Sales of the pound today can be considered when closing below the level of 1.2745 on the 4-hour chart with targets in the range of 1.2705–1.2715 and the level of 1.2620. Purchases were possible on a rebound on the 4-hour chart from the level of 1.2745 to a target of 1.2876.

Analysis are provided byInstaForex.

Read more: https://ifxpr.com/4ae5lLy
IFX Bella
 
Posts: 97
Joined: Sat Dec 08, 2012 12:39 am

Re: Instaforex Analysis

Postby IFX Bella » Fri Mar 15, 2024 8:39 am

Forex Analysis & Reviews: EUR/USD. March 15th. The bears have launched a long-awaited offensive


Image


The EUR/USD pair made a new reversal in favor of the American currency on Thursday and resumed its downward movement after closing below the ascending trend channel. Thus, the decline in quotes may continue down to the Fibonacci level of 38.2%–1.0866. A rebound of the pair's rate from this level will benefit the European currency and may lead to some growth towards the corrective level of 50.0%–1.0918. Consolidation of quotes below 1.0866 will increase the pair's chances of further decline towards the next corrective level of 23.6%–1.0801.


The wave situation remains quite clear. The last completed upward wave confidently broke the peak of the previous wave (from February 22). Thus, we currently have a "bullish" trend, and there are no signs of its completion. Currently, a new downward wave is beginning to form but to determine a shift in sentiment to "bearish," a breakthrough of zone 1.0785–1.0801 is required. Until this moment, we observe only a corrective wave, after which the "bullish" trend may resume. The waves are currently quite large, but daily trader activity is not at its highest level. I believe that the support zone of 1.0785–1.0801 is a good target for traders. The news background on Thursday was interesting. We learned that retail sales volumes in the US turned out to be slightly below market expectations, but at the same time, the Producer Price Index surged by 0.6% in February, which does not bode well for the US economy as inflation may continue to rise, as it did in February. However, such a value is positive for the American currency, as the Fed may now adhere to a hawkish policy longer than traders expect. At the same time, the ECB may start easing monetary policy as early as June.


Forecast for EUR/USD and trader recommendations: Sales of the pair were possible upon a rebound from the level of 1.0959 on the 4-hour chart, with targets at 1.0918 and 1.0866. The first target has been hit, and the second one may be hit today. New sales are possible upon closing below the level of 1.0866 with a target of 1.0801. Buying the pair is possible upon a rebound from the level of 1.0866 on the hourly chart with targets at 1.0918 and 1.0959. Or upon a rebound from the lower line of the channel on the 4-hour chart.


Analysis are provided byInstaForex.

Read more: https://ifxpr.com/4cjZR42
IFX Bella
 
Posts: 97
Joined: Sat Dec 08, 2012 12:39 am

Re: Instaforex Analysis

Postby IFX Bella » Mon Mar 18, 2024 6:40 am

Forex Analysis & Reviews: Indicator Analysis of EUR/USD on March 18, 2024


Image


Today, the price may move upward from the level of 1.0887 (closing of Friday's daily candlestick) to 1.0917, the 50% pullback level (red dotted line). In the case of testing this level, a continued upward movement is possible with a target of 1.0939, the historical resistance level (blue dotted line). Alternatively, from the level of 1.0887 (closing of Friday's daily candlestick), the price may move downward to 1.0871, the 38.2% pullback level (blue dotted line). In the case of testing this level, an upward movement is possible to 1.0917, the 50% pullback level (red dotted line).


Analysis are provided byInstaForex.

Read more: https://ifxpr.com/3Pl7gWz
IFX Bella
 
Posts: 97
Joined: Sat Dec 08, 2012 12:39 am

Re: Instaforex Analysis

Postby IFX Bella » Tue Mar 19, 2024 7:05 am

Forex Analysis & Reviews: Overview of the GBP/USD pair. March 19th. Ahead of the Fed meeting


Image

The GBP/USD pair broke out of the flat and attempted to resume the uptrend. But we still expect a resumption of the downward movement with targets at 1.2543 and 1.2512. The market still very reluctantly buys the dollar and sells the pound, completely ignoring the fundamental and macroeconomic background. This week, it can easily interpret the received information in favor of the pound, even if it is in favor of the dollar. Formally, long positions can be considered when the price is above the moving average, but now the long-awaited consolidation below the moving average has occurred. Therefore, we support any sales of the pair. Explanations for the illustrations: Linear regression channels - help determine the current trend. If both are pointing in the same direction, it means the trend is currently strong. The moving average line (settings 20.0, smoothed) - determines the short-term trend and the direction in which trading should be conducted now. Murray levels - target levels for movements and corrections. Volatility levels (red lines) - the probable price channel in which the pair will spend the next day, based on current volatility indicators. CCI indicator - its entry into oversold territory (below -250) or overbought territory (above +250) indicates that a trend reversal towards the opposite direction is approaching.


Analysis are provided by InstaForex.


Read more: https://ifxpr.com/43k0uXb
IFX Bella
 
Posts: 97
Joined: Sat Dec 08, 2012 12:39 am

Re: Instaforex Analysis

Postby IFX Bella » Wed Mar 20, 2024 4:16 am

Forex Analysis & Reviews: EUR/USD and GBP/USD: Technical analysis on March 20


Image


Higher Timeframes During the previous trading session, bearish players reached and were able to test the crucial milestone of 1.0839, which consolidated several significant levels across different timeframes. However, the day's outcome was once again fixed within the attraction zone of 1.0876 – 1.0862. As a result, the primary task for bearish players remained the same. New bearish targets and plans can only emerge after bearish players manage to overcome the supports at 1.0876 – 1.0862 – 1.0839 and consolidate below. For bullish players, the benchmarks remain unchanged, situated around 1.0909 – 1.0915 – 1.0918 (daily short-term trend + upper boundaries of the daily and weekly Ichimoku clouds).


Image


H4 – H1 On lower timeframes, a corrective upward movement is currently unfolding, with the weekly long-term trend (1.0895) serving as the main reference point. It should be noted that the key level of lower timeframes today is positioned above the current zone of influence of higher timeframes, so a breakthrough and trend reversal could align with the possibilities of higher timeframes, creating good conditions for changing the current balance of power. The next targets for the upward movement within the day will be the resistances of the classic pivot points R2 (1.0901) and R3 (1.0925). The development of bearish sentiments within the day in the current situation may involve passing through the supports of classic pivot points (1.0859 – 1.0841 – 1.0817 – 1.0799). ***


Image


H4 – H1 The main advantage on lower timeframes currently continues to favor bearish players. Targets for resuming the decline within the day today are located at the levels of 1.2705 – 1.2679 – 1.2640 – 1.2614 (classic pivot points). However, if the current corrective upward movement persists, then for a change in the current balance of power, bullish players must break through and reverse the weekly long-term trend (1.2746). Afterward, they will encounter resistances of classic pivot points (1.2770 – 1.2809), reinforced by resistances from higher timeframes (1.2755-79). *** The technical analysis of the situation uses: Higher timeframes - Ichimoku Kinko Hyo (9.26.52) + Fibonacci Kijun levels Lower timeframes - H1 - Pivot Points (classic) + Moving Average 120 (weekly long-term trend)


Analysis are provided by InstaForex.

Read more: https://ifxpr.com/3IIX9XZ
IFX Bella
 
Posts: 97
Joined: Sat Dec 08, 2012 12:39 am

Re: Instaforex Analysis

Postby IFX Bella » Thu Mar 21, 2024 7:05 am

Forex Analysis & Reviews: Analysis and trading tips for EUR/USD on March 21

Image


Analysis of transactions and tips for trading EUR/USD Further growth became limited because the test of 1.0857 occurred during the sharp rise of the MACD line from zero. Then, a good market movement arose after the Fed's decision, bringing around 50 pips of profit. The Fed said they would stick to their path of reducing interest rates even though they encountered obstacles on the way to low and stable inflation. This led to a decline in dollar and purchases of euro. The upward trend in EUR/USD will continue today as long as Manufacturing PMI, Service PMI, and Composite PMI data for the eurozone exceed expectations.


Image


For long positions: Buy when euro hits 1.0946 (green line on the chart) and take profit at the price of 1.1003. Growth will occur after very good statistics from Germany and the eurozone, especially in the manufacturing sector. When buying, make sure that the MACD line lies above zero or rises from it. Euro can also be bought after two consecutive price tests of 1.0921, but the MACD line should be in the oversold area as only by that will the market reverse to 1.0946 and 1.1003. For short positions: Sell when euro reaches 1.0921 (red line on the chart) and take profit at the price of 1.0875. Pressure will increase in the case of unsuccessful bullish activity around the daily high and weak data. When selling, make sure that the MACD line lies under zero or drops down from it. Euro can also be sold after two consecutive price tests of 1.0946, but the MACD line should be in the overbought area as only by that will the market reverse to 1.0921 and 1.0875.

Analysis are provided by InstaForex.

Read more: https://ifxpr.com/3vkPEn1
IFX Bella
 
Posts: 97
Joined: Sat Dec 08, 2012 12:39 am

Re: Instaforex Analysis

Postby IFX Bella » Fri Mar 22, 2024 6:40 am

Forex Analysis & Reviews: Indicator Analysis of EUR/USD on March 22, 2024

Image

Today, the price may move downward from the level of 1.0860 (closing of yesterday's daily candlestick) to 1.0836, the historical support level (blue dotted line).


In the case of testing this level, an upward movement is possible, with a target of 1.0864, the 38.2% pullback level (red dotted line). Alternatively, from the level of 1.0860 (closing of yesterday's daily candlestick), the price may move downward to 1.0836, the historical support level (blue dotted line). In the case of testing this level, a continued downward movement is possible with a target of 1.0804, the 61.8% pullback level (blue dotted line).


Analysis are provided by InstaForex.

Read more: https://ifxpr.com/43s42GS
IFX Bella
 
Posts: 97
Joined: Sat Dec 08, 2012 12:39 am

Re: Instaforex Analysis

Postby IFX Bella » Mon Mar 25, 2024 8:50 am

Forex Analysis & Reviews: USD/JPY. March 25th. Bulls fear the new tightening of the Bank of Japan's policy


Image

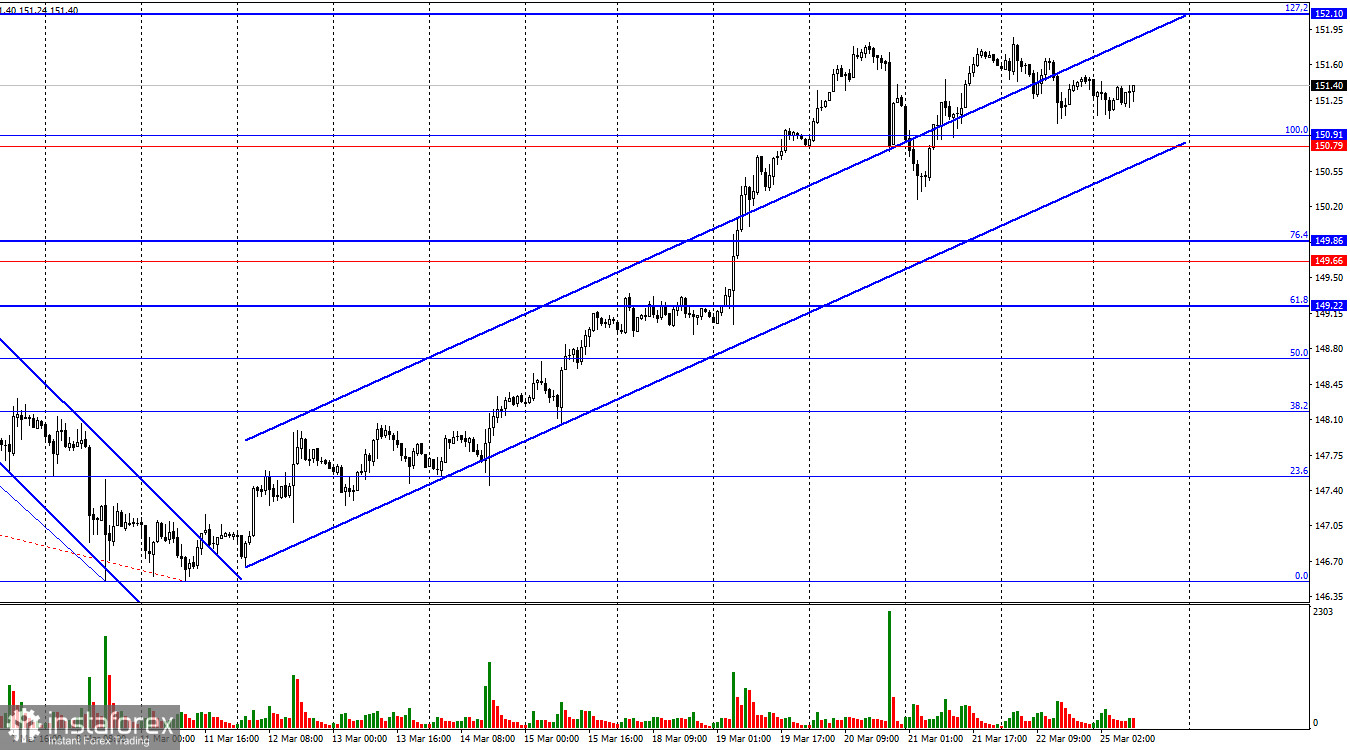
On the hourly chart, the USD/JPY pair on Friday failed to continue its upward trend towards the corrective level of 127.2%152.10. However, traders also failed to return to the support zone of 150.79150.91. Today, a rebound from the zone of 150.79150.91 will allow for a new upward movement towards 152.10, while consolidation below the ascending trend channel will favor the Japanese currency and lead to some decline towards the Fibonacci level of 76.4%149.86.

Image


The wave situation recently fully supports the bulls. Exactly three waves were formed downwards (one being corrective), so a new "bullish" trend is forming. The new upward wave easily broke the peak of the previous wave. Thus, I have no reason to speak of the end of the "bullish" trend. For signs of its completion to appear, a new downward wave is required to break the low from March 11. Alternatively, the next upward wave should not break the last peak, which has yet to form, as the current wave still needs to be completed. On Friday, there was virtually no news in Japan or the USA, which explained the low activity of traders. However, over the weekend, it became known that the Bank of Japan may continue to tighten its monetary policy at its upcoming meetings, as it is quite concerned about the current Japanese yen exchange rate. The problem lies in the significant discrepancy between the Fed and the Bank of Japan rates, but the American regulator still needs to be ready to ease its stance. Therefore, if the Japanese regulator wants to stabilize the yen exchange rate, it must raise its interest rate. The "bullish" trend persists, but bulls have recently been contemplating the prospects and are not ready to get rid of the yen recklessly.


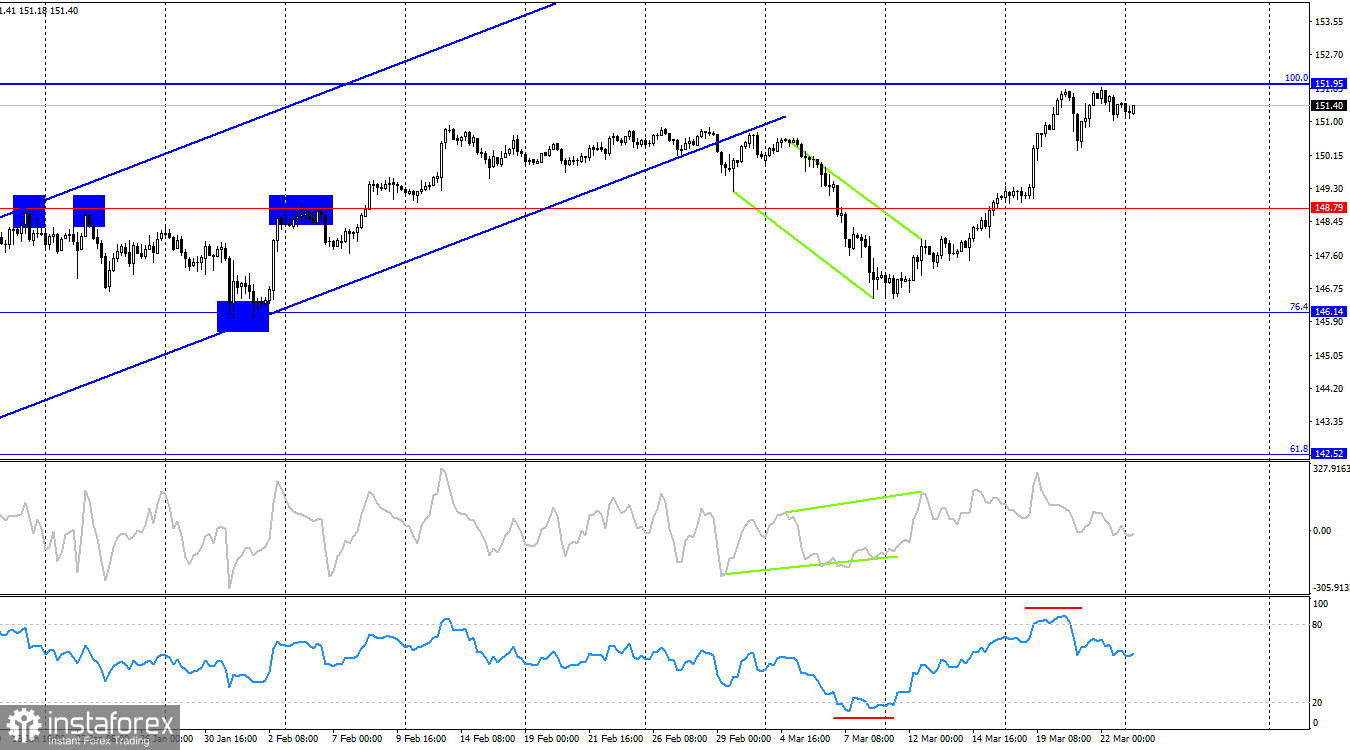
On the 4-hour chart, the pair continues toward the corrective level of 100.0%-151.95. After consolidating below the ascending trend corridor, bears were in a more advantageous position for a couple of days, but on the hourly chart, bulls are now in the lead. Consolidation of the pair's rate above the level of 151.95 will increase the likelihood of further growth towards the next Fibonacci level of 127.2%158.66. Commitments of Traders (COT) report: The sentiment of the "non-commercial" trader category became even more "bearish" during the last reporting week. The number of long contracts held by speculators increased by 11,351 units, while the number of short contracts increased by 25,041. The overall sentiment of major players remains "bearish," and the advantage of sellers is huge. There is almost a threefold gap between the number of long and short contracts: 66,000 versus 182,000. The yen still has excellent prospects for further decline. Still, the significant gap between long and short contracts may also indicate the proximity of the end of the "bearish" trend for the Japanese currency. In other words, bullish speculators may start to retreat from the market. On the 4-hour chart, we already see a significant break in the "bullish" trend, but the dollar may continue to rise in the short term.


Analysis are provided by InstaForex.

Read more: https://ifxpr.com/3vu9wUT
IFX Bella
 
Posts: 97
Joined: Sat Dec 08, 2012 12:39 am

Re: Instaforex Analysis

Postby IFX Bella » Tue Mar 26, 2024 7:51 am

Forex Analysis & Reviews: EUR/USD and GBP/USD: Technical analysis on March 26

Image

EUR/USD

Higher Timeframes At the opening of the new trading week, bullish players took the initiative. Yesterday, they slightly recovered their positions and executed a retest of the weekly levels (1.0829-39). Now, it is crucial what the outcome of the impending ascent will be. Perhaps the retest will conclude, and bears who took a pause will return to the market, or another scenario may prevail, wherein the bulls continue the ascent and test the accumulation zone of the next resistances at 1.0862 - 1.0876.

GBP/USD

Image


Higher timeframes Bears failed to maintain their momentum; yesterday, the opponents seized the initiative. As a result, the pair returned to the daily cloud (1.2629-62). If bulls prevail in the current confrontation, plans for the liquidation of the death cross of the daily Ichimoku cloud will become relevant again; the levels of the cross can now be marked at the boundaries of 1.2698 - 1.2733 - 1.2771. Currently, the strengthening is represented by the weekly short-term trend (1.2705). If bears regain their momentum in the market, they will have to start with a new attempt to test the support zone at 1.2589 - 1.2566 - 1.2582, which combines monthly and weekly levels.

Analysis are provided by InstaForex.

Read more: https://ifxpr.com/3vrhA8S
IFX Bella
 
Posts: 97
Joined: Sat Dec 08, 2012 12:39 am

PreviousNext

Return to Forex Brokers