Instaforex Analysis

Forex broker related topics and discussions

Re: Instaforex Analysis

Postby IFX Gertrude » Wed Mar 01, 2023 12:42 am

Forex Analysis & Reviews: Technical Analysis of Intraday Price Movement of USD/CAD Commodity Currency Pairs, Wednesday March 01 2023

Image

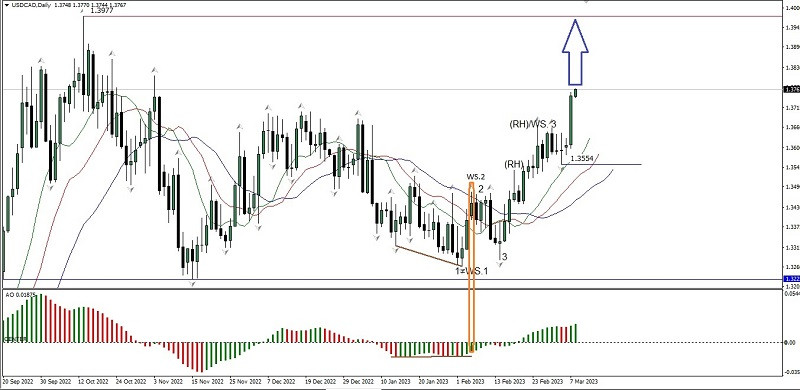
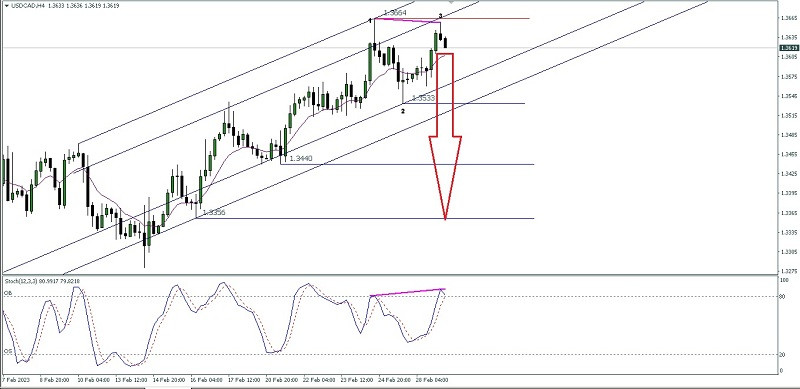
If we look on the 4 hour chart The Loonie then there will be 2 important things:
1. The appearance of Bearish 123 pattern.
2. There is a hidden deviation between Price movement with Stochastic Oscillator indicator.

Based on two things above then as long as USD/CAD back to break above the level 1,3658 on the nearest time has the potential to go down to test the level of 1,3533. If this level successfully broken then level 1,3440 will become the next main target to pursue and level 1,3356 will be the second target to test later.

(Disclaimer)
*The market analysis posted here is meant to increase your awareness, but not to give instructions to make a trade.

Analysis are provided by InstaForex.

Read More https://ifxpr.com/3EHwd9G
Best regards, PR Manager

Learn more about InstaForex Company at http://instaforex.com
IFX Gertrude
 
Posts: 5198
Joined: Wed Nov 07, 2012 6:25 am

Re: Instaforex Analysis

Postby IFX Gertrude » Thu Mar 02, 2023 1:48 am

FOREX ANALYSIS & REVIEWS: TECHNICAL ANALYSIS OF DAILY PRICE MOVEMENT OF NASDAQ 100 INDEX, THURSDAY MARCH 02 2023.

Image

Nasdaq 100 Index on the daily chart seems continue the decline and currently trying to break below its Bearish Ross Hook at the level 11913.5 where it is also confirmed by the price movement that moves below EMA 10 and MACD indicator which intersects downwards where this all shows that the momentum from #NDX is in a bearish condition so that if this (RH) level is successfully broken down then #NDX has the potential to continue its decline to the level of 11546.3 as the first target and if the momentum and volatility are also supportive then no It is impossible for the 11246.8 level to become the second target with a note that during the descent towards these target levels there was no significant upward correction, especially to break above the 12236.7 level because if this level is successfully penetrated upwards then the downward scenario described previously has the potential not to occur. realized.

(Disclaimer)
*The market analysis posted here is meant to increase your awareness, but not to give instructions to make a trade.

Analysis are provided by InstaForex.

Read More https://ifxpr.com/3kERidX
Best regards, PR Manager

Learn more about InstaForex Company at http://instaforex.com
IFX Gertrude
 
Posts: 5198
Joined: Wed Nov 07, 2012 6:25 am

Re: Instaforex Analysis

Postby IFX Gertrude » Fri Mar 03, 2023 1:14 am

FOREX ANALYSIS & REVIEWS: FORECAST FOR USD/JPY ON MARCH 3, 2023

The yen is moving up so far, according to our main scenario, to the 137.75 target level. But the technical pressure on the pair is increasing every day. The signal line of the Marlin oscillator is being pushed down, against the rising price. The pair might not reach the 137.75 target.

Image

The pair can continue to rise if the dollar continues a massive attack in all markets, including commodities, then the oscillator's decline will transform before it rises further. And then the price could overcome the target level of 137.75 and the rally will continue to reach 138.90 (July 21, 2022 high).

Image

There is a double divergence on the four-hour chart. If the price goes under the MACD line, below the 136.28 mark, it will also correspond to the move of the Marlin oscillator into the downtrend area. The downtrend will be fueled even more, once the price hits the 134.00 target. A full-fledged growth will start once the price surpasses yesterday's high (137.10).

Risk Warning: CFDs are complex instruments and come with a high risk of losing money rapidly due to leverage. 77.95% of retail investor accounts lose money when trading CFDs with this provider. You should consider whether you understand how CFDs work and whether you can afford to take the high risk of losing your money.

Analysis are provided by InstaForex.

Read More https://ifxpr.com/3IXaJrS
Best regards, PR Manager

Learn more about InstaForex Company at http://instaforex.com
IFX Gertrude
 
Posts: 5198
Joined: Wed Nov 07, 2012 6:25 am

Re: Instaforex Analysis

Postby IFX Gertrude » Mon Mar 06, 2023 1:28 am

FOREX ANALYSIS & REVIEWS: TECHNICAL ANALYSIS OF DAILY PRICE MOVEMENT OF EUR/GBP CROSS CURRENCY PAIRS, MONDAY MARCH 06, 2023.

Image

On the daily chart EUR/GBP cross currency pairs you can see that the price movement is moving in a downward channel and the appearance of deviations between price movements and the MACD indicator strengthens the potential for a decline in EUR/GBP in the future where currently the 0.8754 level will try to be broken down if this level is successfully broken down and there is no upward correction that passes level 0.8928, EUR/GBP in the next few days will potentially fall down to the 0.8721 level as the first target and the 0.8546 level as the second target.

(Disclaimer)
*The market analysis posted here is meant to increase your awareness, but not to give instructions to make a trade.

Analysis are provided by InstaForex.

Read More https://ifxpr.com/3JhadF8
Best regards, PR Manager

Learn more about InstaForex Company at http://instaforex.com
IFX Gertrude
 
Posts: 5198
Joined: Wed Nov 07, 2012 6:25 am

Re: Instaforex Analysis

Postby IFX Gertrude » Tue Mar 07, 2023 12:29 am

FOREX ANALYSIS & REVIEWS: FORECAST FOR USD/JPY ON MARCH 7, 2023

Yesterday's attempts to win back positions against the dollar were suppressed, and the pair ended the day above Friday's closing level by 9 points. The Marlin oscillator is persistently decreasing on the daily chart, but it also creates the potential for the oscillator to move into the overbought zone. We still have an uptrend, and the target is the nearest embedded line of the price hyperchannel around 137.75.

Image

If the price overcomes yesterday's low (135.38), it can continue to fall to the bottom line of the price channel around 134.00.

Image

On the four-hour chart, the price is under the balance and MACD indicator lines. The Marlin oscillator reverses upward, but it still needs to move into the positive area to support the bulls. In order for the pair to continue rising, the price needs to break through the MACD line at 136.53.

(Disclaimer)
*The market analysis posted here is meant to increase your awareness, but not to give instructions to make a trade.

Analysis are provided by InstaForex.

Read More https://ifxpr.com/3L1K3HB
Best regards, PR Manager

Learn more about InstaForex Company at http://instaforex.com
IFX Gertrude
 
Posts: 5198
Joined: Wed Nov 07, 2012 6:25 am

Re: Instaforex Analysis

Postby IFX Gertrude » Wed Mar 08, 2023 3:11 am

FOREX ANALYSIS & REVIEWS: TECHNICAL ANALYSIS OF DAILY PRICE MOVEMENT OF USD/CAD COMMODITY CURRENCY PAIRS, WEDNESDAY, MARCH 08 2023.

Image

There is a few interesting things on the daily chart USD/CAD commodity currency pairs:
1. The appearance of three Wiseman signal.
2. There is a deviation between price movement with Awesome Oscillator indicator.
3. The price moves above the open Alligator gaping upwards.
4. The appearance of Bullish 123 pattern follow by 2 or Ross Hook (RH).
Based on the facts above we can predicted in a few days ahead that the Loonie will try to tested level 1,3977. However if on its way to to those levels suddenly corrected down below the level of 1,3554 the Bulls scenario that has been described earlier will become invalid and cancel by itself.

(Disclaimer)
*The market analysis posted here is meant to increase your awareness, but not to give instructions to make a trade.

Analysis are provided by InstaForex.

Read More https://ifxpr.com/3kYBFOM
Best regards, PR Manager

Learn more about InstaForex Company at http://instaforex.com
IFX Gertrude
 
Posts: 5198
Joined: Wed Nov 07, 2012 6:25 am

Re: Instaforex Analysis

Postby IFX Gertrude » Thu Mar 09, 2023 3:12 am

FOREX ANALYSIS & REVIEWS: ELLIOTT WAVE ANALYSIS OF UNG FOR MARCH 9, 2023

Image

UNG continues to follow our count to the letter and we are now close to testing the 61.8% corrective target of the rally from 7.16 to 9.99 at 8.23. This is likely enough to set the stage for the next impulsive rally higher towards 16.40 and 20.56 as the next upside targets.

A rally likely that in UNG warns the Natural Gas prices will lift off too and that inflation isn't under control as many politicians and economists like to tell us, so be alert as to when the next impulsive rally is ready to take off.

(Disclaimer)
*The market analysis posted here is meant to increase your awareness, but not to give instructions to make a trade.

Analysis are provided by InstaForex.

Read More https://ifxpr.com/41WjZDX
Best regards, PR Manager

Learn more about InstaForex Company at http://instaforex.com
IFX Gertrude
 
Posts: 5198
Joined: Wed Nov 07, 2012 6:25 am

Re: Instaforex Analysis

Postby IFX Gertrude » Fri Mar 10, 2023 12:38 am

FOREX ANALYSIS & REVIEWS: FORECAST FOR EUR/USD ON MARCH 10, 2023

Yesterday, the euro managed to develop a correction so that it can reach the target level of 1.0595 this morning. The price returned to the consolidation range of the second half of December 2022, and can stay there until the release of the US employment data. Also, the price may settle below 1.0595, as the trading volumes have noticeably decreased in recent days.

Image

We expect today's Nonfarm Payrolls to be good as weekly jobless claims are coming in at a consistently low 196,000 on average over the past month. A month earlier, the average was 189,000 and then, in January, Nonfarm Payrolls showed an increase of 517,000 new jobs. Forecast for February is 205,000, the data is likely to be better than forecast. I expect the euro to fall to the target range of 1.0443/70.

On the four-hour chart, the price has stopped rising in the area where the MACD indicator line coincides with the target resistance of 1.0595. The signal line of the Marlin oscillator closely approached the zero neutral line.There is a high probability that the price will reverse to the downside. In the main bearish scenario, the price can also climb above the resistance, but this will be a false breakout.

Image

(Disclaimer)
*The market analysis posted here is meant to increase your awareness, but not to give instructions to make a trade.

Analysis are provided by InstaForex.

Read More https://ifxpr.com/3mKmWaM
Best regards, PR Manager

Learn more about InstaForex Company at http://instaforex.com
IFX Gertrude
 
Posts: 5198
Joined: Wed Nov 07, 2012 6:25 am

Re: Instaforex Analysis

Postby IFX Gertrude » Mon Mar 13, 2023 2:10 am

FOREX ANALYSIS & REVIEWS: TRADING SIGNAL FOR GBP/USD FOR MARCH 13 - 14, 2023: BUY ABOVE 1.2052 OR SELL AFTER PULLBACK AT 1.2140 (200 EMA - GAP

Image

Early in the European session, the British pound is trading around 1.2071 above the 200 EMA above the 21 SMA. We can see that the GBP/USD pair opened this week's trade with a bullish gap.

The market sentiment is bullish and is being supported by the 200 EMA. It is likely to continue to rise in the next few hours and reach the maximum of 1.2140, the level seen on February 21 and 28.

This zone between the levels of 1.2140 -1.2161 (daily resistance_1) could act as a strong barrier for the British pound since in February, it acted as strong resistance twice.

In case of a pullback towards 1.2140 - 1.2161, we could sell with targets of 1.2085 (3/8 Murray) and 1.2050 (200 EMA).

If the British pound falls below the 200 EMA and trades on 4-hour charts below this level, we can expect it to fill the gap left around 1.2030 and reach support at 2/8 Murray at 1.19162.

In the event that the British pound trades below 4/8 Murray located at 1.2207 or any technical rebound in this area, we could see a signal to sell. In this case, the pair could reach 1.2000 in the next few days and even could fall to 1.1840 (1/8 Murray).

(Disclaimer)
*The market analysis posted here is meant to increase your awareness, but not to give instructions to make a trade.

Analysis are provided by InstaForex.

Read More https://ifxpr.com/3ZZMnTZ
Best regards, PR Manager

Learn more about InstaForex Company at http://instaforex.com
IFX Gertrude
 
Posts: 5198
Joined: Wed Nov 07, 2012 6:25 am

Re: Instaforex Analysis

Postby IFX Gertrude » Tue Mar 14, 2023 1:04 am

FOREX ANALYSIS & REVIEWS: FORECAST FOR GBP/USD ON MARCH 14, 2023

The pound continued its irrepressible growth yesterday, adding one and a half figures and overcoming the target level of 1.2155. It did not settle above this level, and this morning, it fell below it.

Image

Most likely, the price can now head to close the opening gap of the week (1.2028). The Marlin oscillator has marked the beginning of the reversal. On the four-hour chart, there are no obvious reversal signs yet, the signal line of the oscillator should decrease even more. The first step will be the price settling under 1.2155.

Image

If the price is able to exceed yesterday's high of 1.2198, it may continue to rise to the MACD line around 1.2272 on the daily chart.

(Disclaimer)
*The market analysis posted here is meant to increase your awareness, but not to give instructions to make a trade.

Analysis are provided by InstaForex.

Read More https://ifxpr.com/3yAwuaP
Best regards, PR Manager

Learn more about InstaForex Company at http://instaforex.com
IFX Gertrude
 
Posts: 5198
Joined: Wed Nov 07, 2012 6:25 am

PreviousNext

Return to Forex Brokers


cron