Crypto Industry News:
According to a recent SEC disclosure by the Greyscale Ethereum Trust, or ETHE, Ethereum's impending shift to proof-of-stake consensus is a risk that could have a "material adverse effect" on its stock.
ETHE has recently applied to the regulator to become a SEC reporting company. Such companies are required to discuss risk factors that may adversely affect their results in all quarterly and annual reports.
In one section, which aims to outline the potential threats to the fund's future, it was noted that upgrading to ETH 2.0 may cause some difficulties for investors:
"The digital asset network's consensus mechanism is an essential aspect of its source code, and any failure to properly implement such a change could have a significant negative impact on the ETH value."
The report mentions that the inability to properly implement these changes may result in a temporary or permanent bifurcation which could have a negative impact on ETHE's stock.
It seems that the upcoming modernization so far does not diminish investors' interest in the fund. On the contrary, the assets of the Trust it manages have grown exponentially over the past year, from $ 67 million to over $ 800 million at the time of publication.
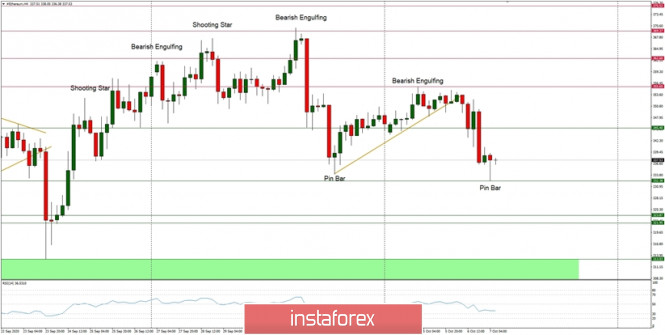
Technical Market Outlook:
The ETH/USD pair had failed to break through the 61% Fibonacci retracement of the last wave down and suddenly reversed all the previous gains. The local trend line support had been violated as well and the pair made a new local low seen at the level of $332.46. There was some Pin Bar candlestick made at the end of the move down, so a small bounce is possible up to the level of $345.20. If this local technical resistance is not clearly broken, then the down move should resume and head towards the next target seen at the level of $322.87 - $321.95.
Weekly Pivot Points:
WR3 - $403.75
WR2 - $387.38
WR1 - $368.10
Weekly Pivot - $351.05
WS1 - $333.15
WS2 - $315.51
WS3 - $296.13
Trading Recommendations:
The weekly and monthly time frame trend on the ETH/USD pair remains up and there are no signs of trend reversal, so buy orders are preferred in the mid-term. The key mid-term technical support is currently seen at the level of $305.20 - $321.95, so all the dynamic corrections are still being used to buy the dips. The next mid-term target for bulls is seen at the level of $500.
Analysis are provided byInstaForex.