Instaforex Analysis

Forex broker related topics and discussions

Re: Instaforex Analysis

Postby IFX Gertrude » Wed Nov 18, 2020 2:29 am

AUD/USD Forecast for November 18, 2020

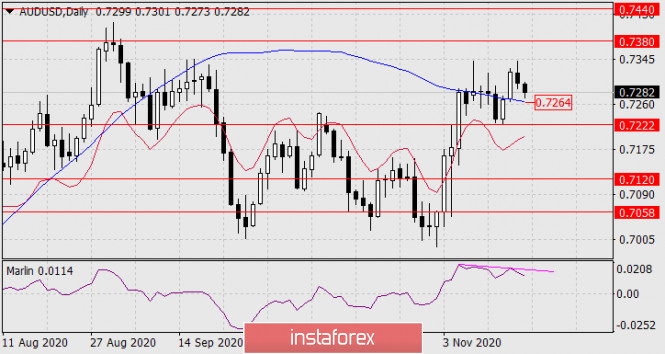
AUD / USD The Australian Dollar lost 20 points yesterday. Yesterday's peak allowed us to form a divergence with the Marlin oscillator. To fix it and actually turn the market down, the price needs to be fixed under the Kruzenshtern line-- below 0.7264-- and then fall below the nearest target level of 0.7222 at least on November 12-13. The nearest target is 0.7120.
Image

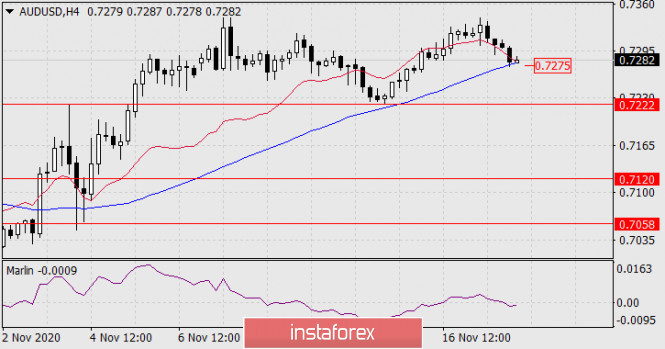
On the four-hour chart, the price is already attacking the Kruzenshtern line at 0.7275. Note that the Krusenstern lines on both time charts almost coincide in price, which makes the 0.7264/75 range particularly important.
Image

Fixing under the specified range can trigger a strong drop in the price. The signal line of the Marlin oscillator on H4 has already entered the zone of negative values. The probability of a downward scenario is 80%.

Analysis are provided byInstaForex.
Best regards, PR Manager

Learn more about InstaForex Company at http://instaforex.com
IFX Gertrude
 
Posts: 5198
Joined: Wed Nov 07, 2012 6:25 am

Re: Instaforex Analysis

Postby IFX Gertrude » Thu Nov 19, 2020 2:20 am

EURUSD. Central European Bank has designated the level of resistance

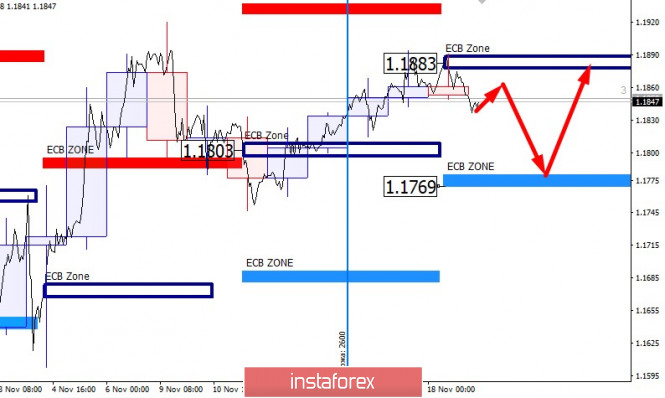
Yesterday's reaction to the bank level of 1.1883 indicates that growth is being held by placing large limit orders. There is a high probability of a decline to the support zone formed from the level of 1.1769. This model is a priority at the end of this week and the beginning of next week.

Image

This model will continue to form a medium-term accumulation zone. It is important to understand that sales must be recorded when testing the lower banking zone. This will help in avoiding missed opportunities.

If the test of the 1.1769 level leads to a large demand, then you will need to open purchases. The growth target will be a return to the level of 1.1883. This model is valid until next Wednesday which makes purchases profitable after a decline to 1.1769. Don't forget to fix your positions when you reach the support and resistance zones.

Analysis are provided byInstaForex.
Best regards, PR Manager

Learn more about InstaForex Company at http://instaforex.com
IFX Gertrude
 
Posts: 5198
Joined: Wed Nov 07, 2012 6:25 am

Re: Instaforex Analysis

Postby IFX Gertrude » Fri Nov 20, 2020 2:33 am

Forecast for EUR/USD on November 20, 2020

EUR/USD
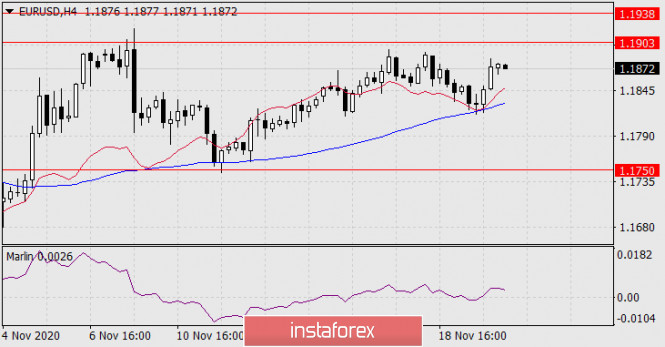
Yesterday, the euro showed increased dynamics on average trading volumes, the range was 68 points. The support was provided by the balance and MACD indicator lines on the four-hour chart. The Marlin oscillator did not manage to gain a foothold in the bears' territory and went back to the growth area. We have a rising trend on the four-hour chart. The nearest target 1.1903 is the MACD line on the daily chart.

Image

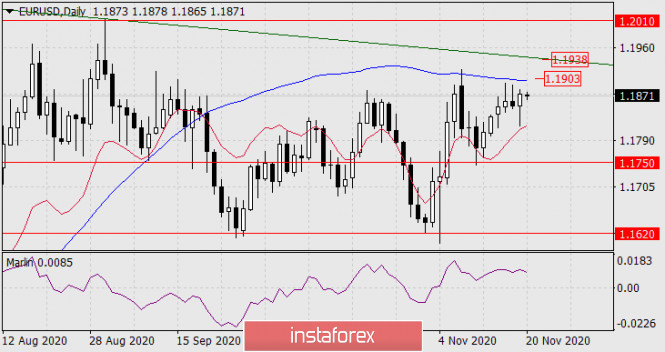
The daily chart shows that the situation also tends to rise, but the resistance of the MACD line looks strong, the price has pulled back from it twice in the last three days.

Image

If the euro gathers strength, it is possible to overcome the 1.1903 level and even reach the border of the price channel at 1.1938, but further growth is possible only with strong fundamental factors. In this case, the target is the 1.2010/40 range.

In general, the euro confirmed that it is not going to leave the wide free roaming zone of 1.1750-1.1930. We are waiting for the development of events.

Analysis are provided byInstaForex.
Best regards, PR Manager

Learn more about InstaForex Company at http://instaforex.com
IFX Gertrude
 
Posts: 5198
Joined: Wed Nov 07, 2012 6:25 am

Re: Instaforex Analysis

Postby IFX Gertrude » Mon Nov 23, 2020 3:09 am

Forecast for EUR/USD on November 23, 2020

EUR/USD
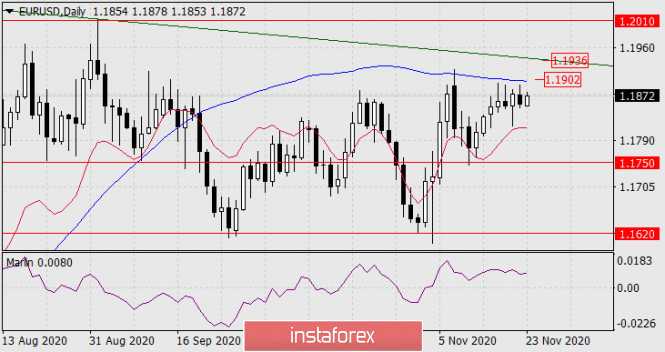
The euro settled below the MACD indicator line on the daily chart for the last two days. A pronounced consolidation provides more prerequisites for overcoming the resistance of the MACD line (1.1902), which will help the euro reach the upper border of the downward price channel on a weekly scale (1.1936) and even to its breakout with the subsequent target at 1.2010. And from a fundamental point of view, this scenario is reinforced by the next postponement of the Brexit deadline to December 10, which is when the Brexit deal is expected to be adopted at the EU summit. The agreement itself may be ready by November 30th.

Image

The Marlin oscillator does not provide hints on the daily scale, it moves horizontally.
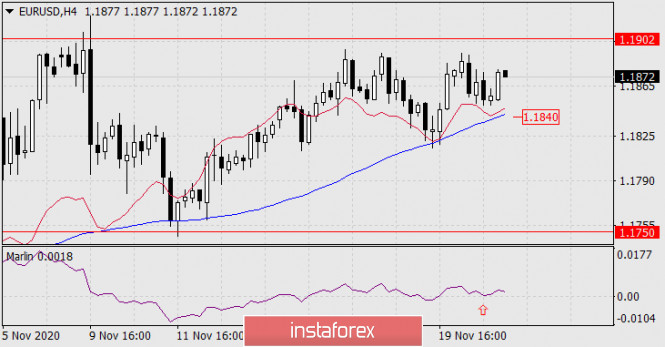
The four-hour chart shows that Marlin is turning upward from the border of the bears' territory, the price is developing above the balance and MACD lines, which ultimately increases the likelihood of rising further to about 60%.

Image

The growing market sentiment may be shaken when the price settles below the MACD line at the four-hour chart, below 1.1840 to be more specific. The 1.1750 target level will become relevant again. We are waiting for the development of events.

Analysis are provided byInstaForex.
Best regards, PR Manager

Learn more about InstaForex Company at http://instaforex.com
IFX Gertrude
 
Posts: 5198
Joined: Wed Nov 07, 2012 6:25 am

Re: Instaforex Analysis

Postby IFX Gertrude » Tue Nov 24, 2020 2:29 am

Forecast for AUD/USD on November 24, 2020

AUD/USD
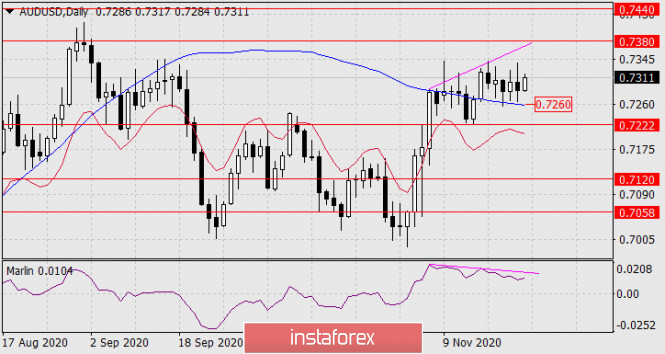
The Australian dollar lost 15 points under the overall optimistic pressure of the US dollar on Monday. But while the Australian currency is in no hurry to leave the range of the last six trading sessions, it needs to make sure that the market intends to further strengthen the US currency. During this waiting time, even if it does not work out the upper target of 0.7380, AUD/USD can form a double divergence with the Marlin oscillator. The most important economic data for Australia will only be available next week, such as Quarter 3 GDP, trade balance, PMI, and construction. Since the RBA meeting will take place on Tuesday, December 1, the "kangaroo" can feel quite free until the end of the week.

Image

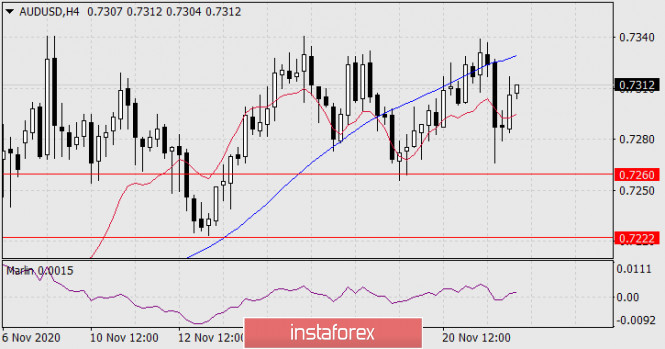
On the four-hour chart, the price consolidated under the MACD indicator line, the Marlin oscillator briefly went into the negative zone, and this morning it is trying to get back into the growth zone. Neutrality is also observed here on the four-hour scale. It still waits for the price to fall below the level of 0.7260, which is under the daily MACD line.

Image

Analysis are provided byInstaForex.
Best regards, PR Manager

Learn more about InstaForex Company at http://instaforex.com
IFX Gertrude
 
Posts: 5198
Joined: Wed Nov 07, 2012 6:25 am

Re: Instaforex Analysis

Postby IFX Gertrude » Wed Nov 25, 2020 2:55 am

AUD/USD Forecast for November 25, 2020

AUD / USD
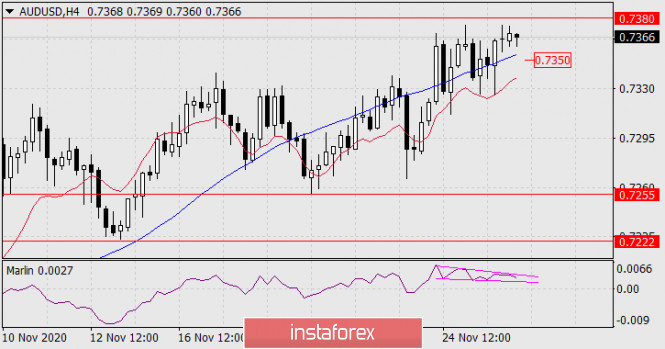
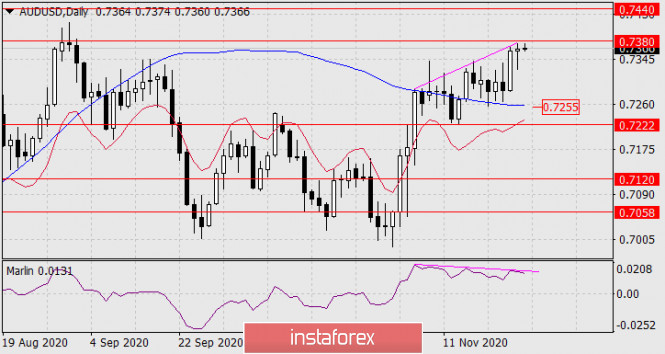
The Australian Dollar successfully took advantage of yesterday's weakness of the US Dollar. On the weakening of the dollar index by 0.40%, 75 points (1.02%) were added to the Australian currency. The price reached the target level of 0.7380 this morning and at the same time formed a triple divergence (on the bodies of candles) with the Marlin oscillator.

With the greatest probability, the price can now turn down with an attack on the support of the Kruzenshtern line (0.7255), which coincides with the level of the lows on November 19 and 10 (and also on September 4).

On the four-hour chart, the price is above the balance line and the Kruzenshtern line. The Marlin oscillator held yesterday's price growth in the sideways direction which may be an early sign of a reversal or correction. Fixing the price under the Kruzenshtern line (0.7342) will be the first sign of a reversal, after which it is advisable to wait for confirmation of this signal and opening short positions. Confirmation may be the departure of Marlin in the negative area, this will be approximately when the price reaches the level of 0.7330.

Analysis are provided by InstaForex
Best regards, PR Manager

Learn more about InstaForex Company at http://instaforex.com
IFX Gertrude
 
Posts: 5198
Joined: Wed Nov 07, 2012 6:25 am

Re: Instaforex Analysis

Postby IFX Gertrude » Thu Nov 26, 2020 1:45 am

Forex Analysis & Reviews: AUD/USD Forecast for November 26, 2020

AUD/USD
The Australian Dollar was ready yesterday to turn from the target resistance 0.7380, a decline of 50 points, but the European currencies showed the optimism of American investors out of the market before today's holiday. As a result the Aussie closed the day up 5 points. The potential for divergence formation on the daily chart remains. The level of 0.7380 has not been overcome but the probability of this has increased. The target in this case is the 0.7440 level.

Image

On the four-hour chart, the price punctured the Kruzenshtern line twice yesterday but this was in a growing trend, as the price remained above the balance indicator line. The signal line of the Marlin oscillator has created a wedge-shaped structure, from which an upward exit is expected.

Image

So, with a probability of 80%, the price is likely to go above the level of 0.7380 and further increase to 0.7440.

Analysis are provided byInstaForex.
Best regards, PR Manager

Learn more about InstaForex Company at http://instaforex.com
IFX Gertrude
 
Posts: 5198
Joined: Wed Nov 07, 2012 6:25 am

Re: Instaforex Analysis

Postby IFX Gertrude » Fri Nov 27, 2020 2:29 am

Forex Analysis & Reviews: Forecast for EUR/USD on November 27, 2020

EUR/USD
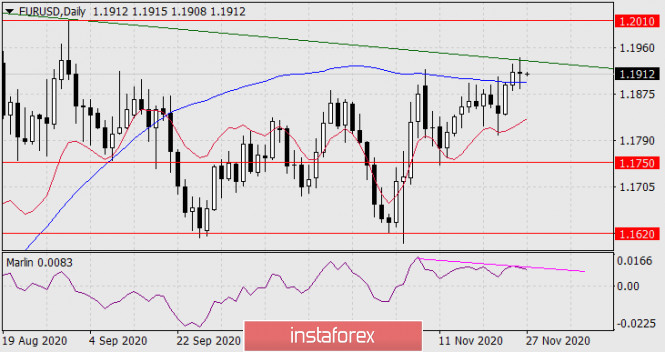
In the absence of American investors in the market, the euro did not dare to overcome the important resistance of the upper line of the price channel on the daily chart on Thursday. Confusion made it possible for a divergence reversal to form with the Marlin oscillator. European stock indexes also showed no desire to rise yesterday, the main ones closed the day with a slight decline. Obviously, the markets will not grow today either, as any negotiations between the UK and the EU on Brexit may end on Monday.

Image

At the moment, the daily price is between the MACD line and the price channel line. The price can't go up, but now it can slightly go down on closing long positions. Direct short deals on the euro may begin next week.

Image

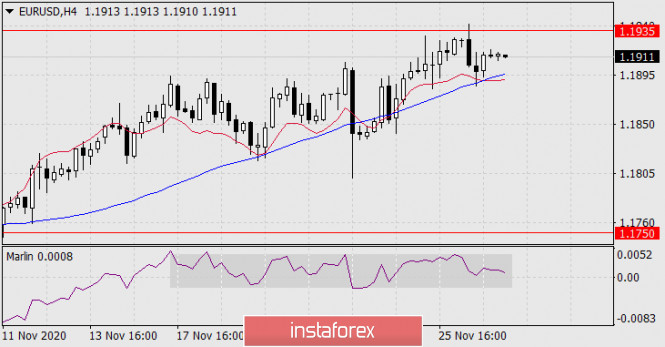
The four-hour chart shows that the price is still receiving support from the MACD line, but the signal line of the Marlin oscillator did not rise from its own range (gray rectangle), as we expected yesterday, but now this line can go down from the range. A signal to open short positions is when the price falls below yesterday's low of 1.1885.

Analysis are provided byInstaForex.
Best regards, PR Manager

Learn more about InstaForex Company at http://instaforex.com
IFX Gertrude
 
Posts: 5198
Joined: Wed Nov 07, 2012 6:25 am

Re: Instaforex Analysis

Postby IFX Gertrude » Mon Nov 30, 2020 2:53 am

Forex Analysis & Reviews: Gold price breaks $1,800

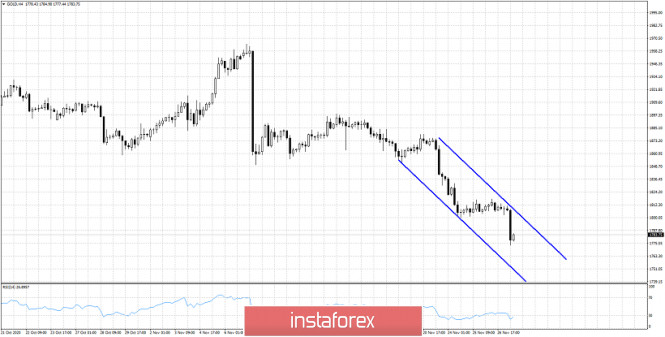
Gold is trading below $1,800 and today it made a new lower low at $1,773. In our latest Gold analysis when price was trading near $1,810-20 resistance area by the bearish channel, we noted the bearish flag pattern and that we expect Gold price to move to new lows towards $1,770-50. The upper side of the target range has been reached today.

Image

Blue lines - bearish channel
Gold price is moving lower in a textbook style as price gets rejected at the upper channel boundary resistance and breaks lower towards $1,770. Trend is clearly bearish and no sign of reversal yet. Gold price will most probably continue lower. A bounce towards $1,800 is not out of the question but it would not be something we would bet on.

Analysis are provided byInstaForex.
Best regards, PR Manager

Learn more about InstaForex Company at http://instaforex.com
IFX Gertrude
 
Posts: 5198
Joined: Wed Nov 07, 2012 6:25 am

Re: Instaforex Analysis

Postby IFX Gertrude » Tue Dec 01, 2020 2:01 am

Forex Analysis & Reviews: Forecast for EUR/USD on December 1, 2020

EUR/USD
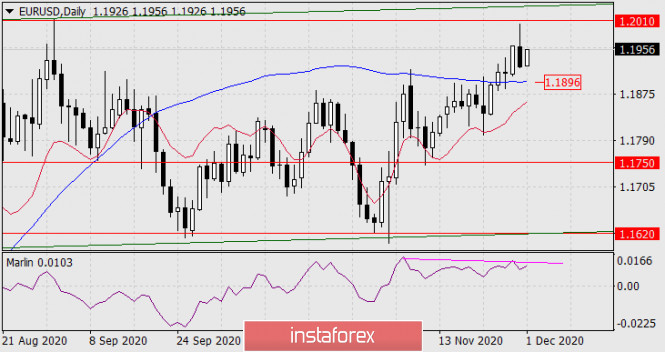
According to news agencies, stock market participants took profits yesterday, due to which the S&P 500 fell by 0.46%, and the Dow Jones -0.91%. Trading volumes were large, a sign of flight from the stock market before the announcement of the UK's exit from the EU without a deal. The euro lost 35 points on the same expectations, falling from the day's high with 77 points. The price slightly fell short of the target level 1.2010/40. Divergence on the daily chart is gaining strength

Image

Taking the high volumes of yesterday's trading into account, which were the highest for the euro over the past two weeks, investors are unlikely to want to try to take it a second time. Now we are waiting for the price to move under the MACD line (1.1896) and the attack on support at 1.1750. If successful, it will be followed by - reaching the lower embedded line of the price channel in the 1.1620 area.

Image

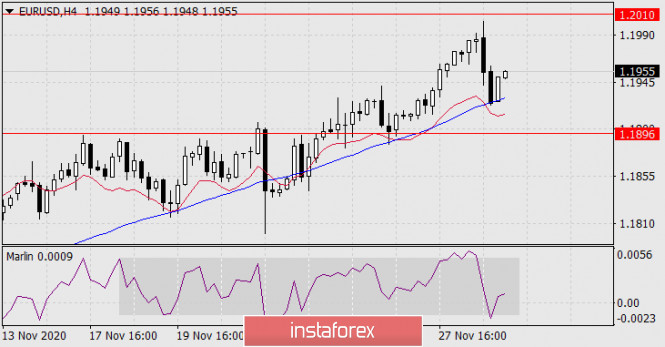
The four-hour chart shows that the signal line of the Marlin oscillator has returned to the lower border of its own range. At the same time, the price reached the support of the MACD indicator line. Since the price overcame yesterday's low of 1.1926, it is possible to open short deals while aiming for 1.1750 and 1.1620.

Analysis are provided byInstaForex.
Best regards, PR Manager

Learn more about InstaForex Company at http://instaforex.com
IFX Gertrude
 
Posts: 5198
Joined: Wed Nov 07, 2012 6:25 am

PreviousNext

Return to Forex Brokers


cron