Instaforex Analysis

Forex broker related topics and discussions

Re: Instaforex Analysis

Postby IFX Bella » Wed Mar 27, 2024 6:27 am

Forex Analysis & Reviews: Overview of the EUR/USD pair. March 27th. The ECB is fully prepared for easing in June

Image

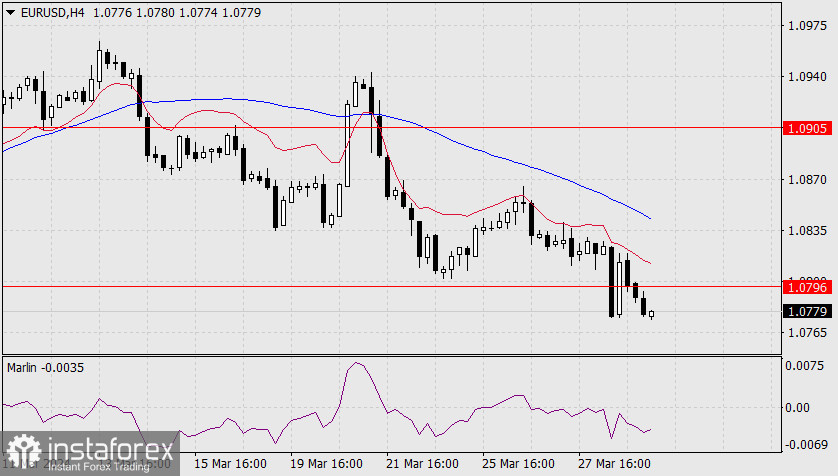
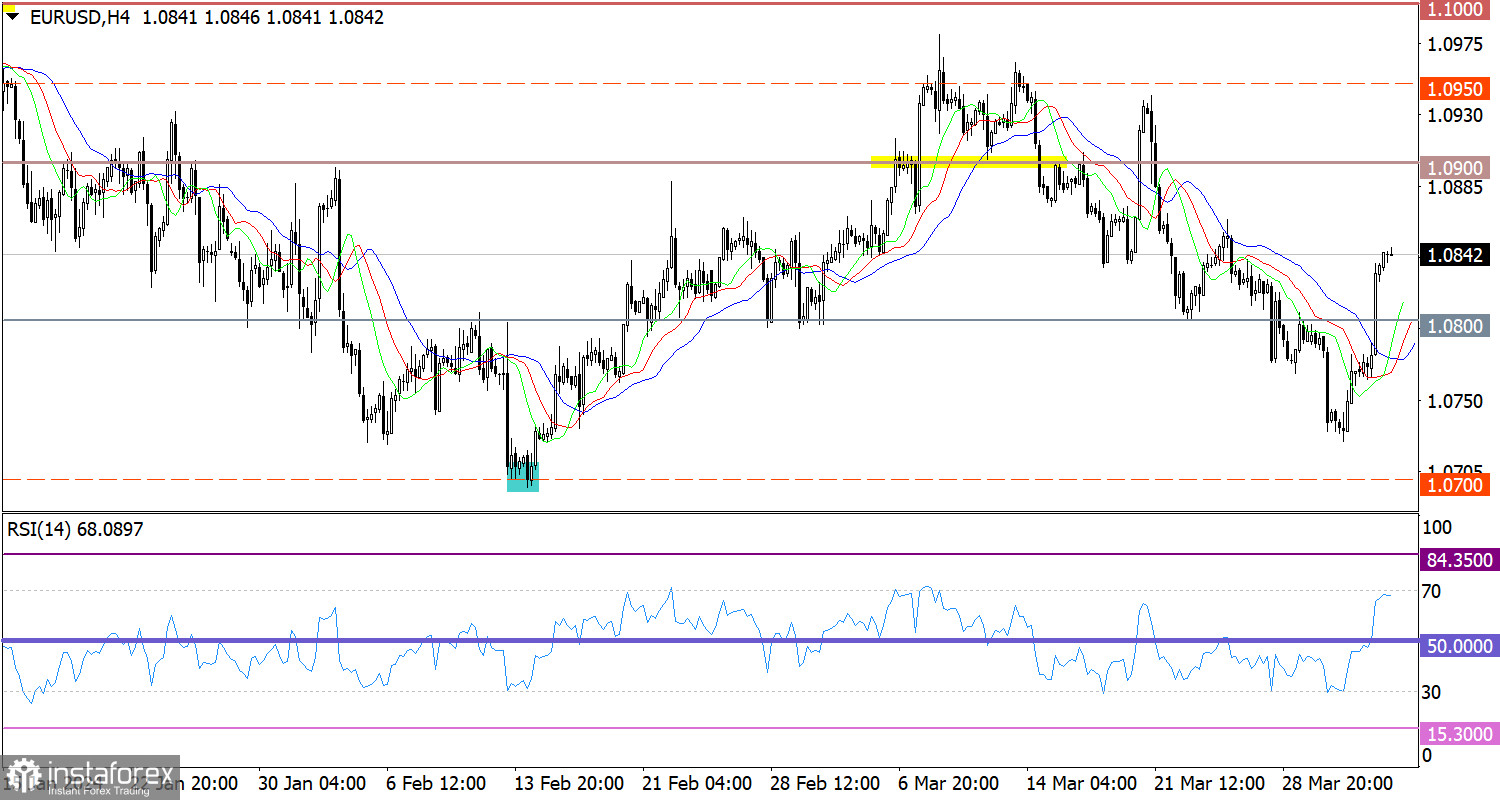
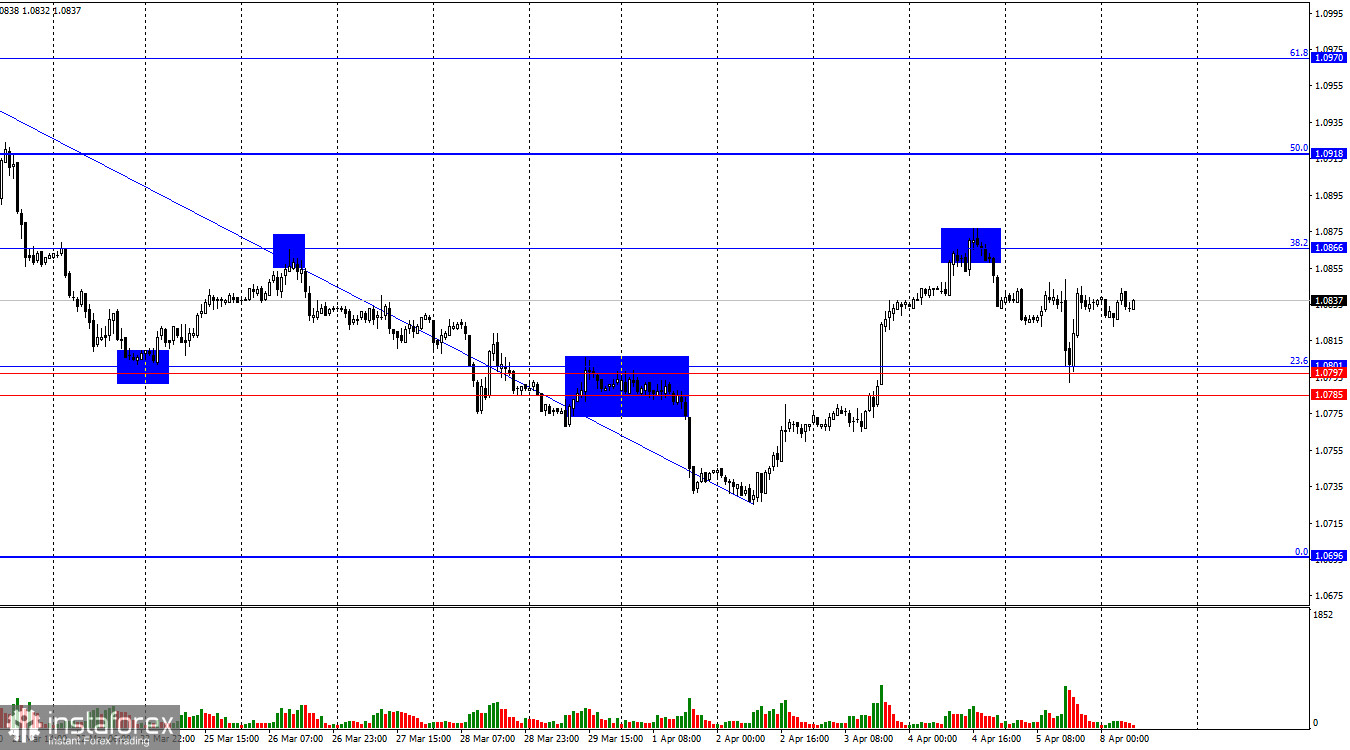
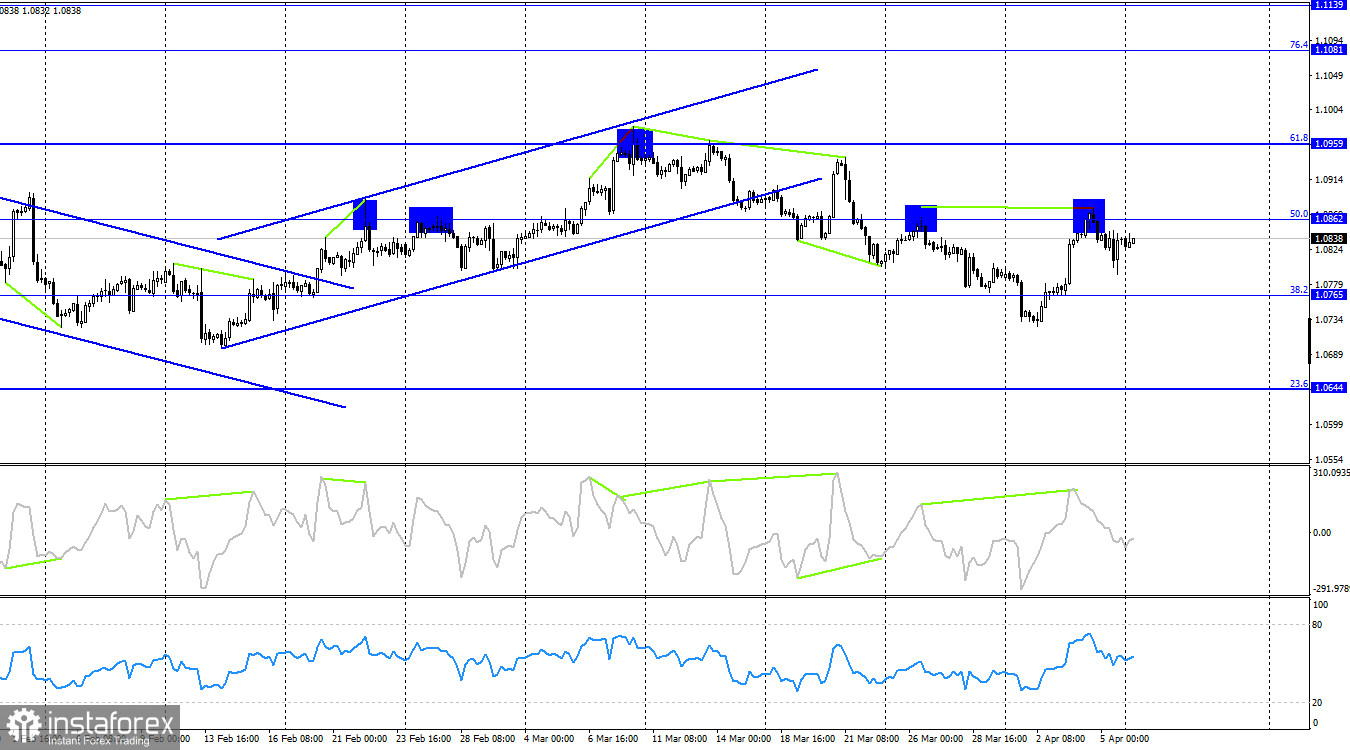
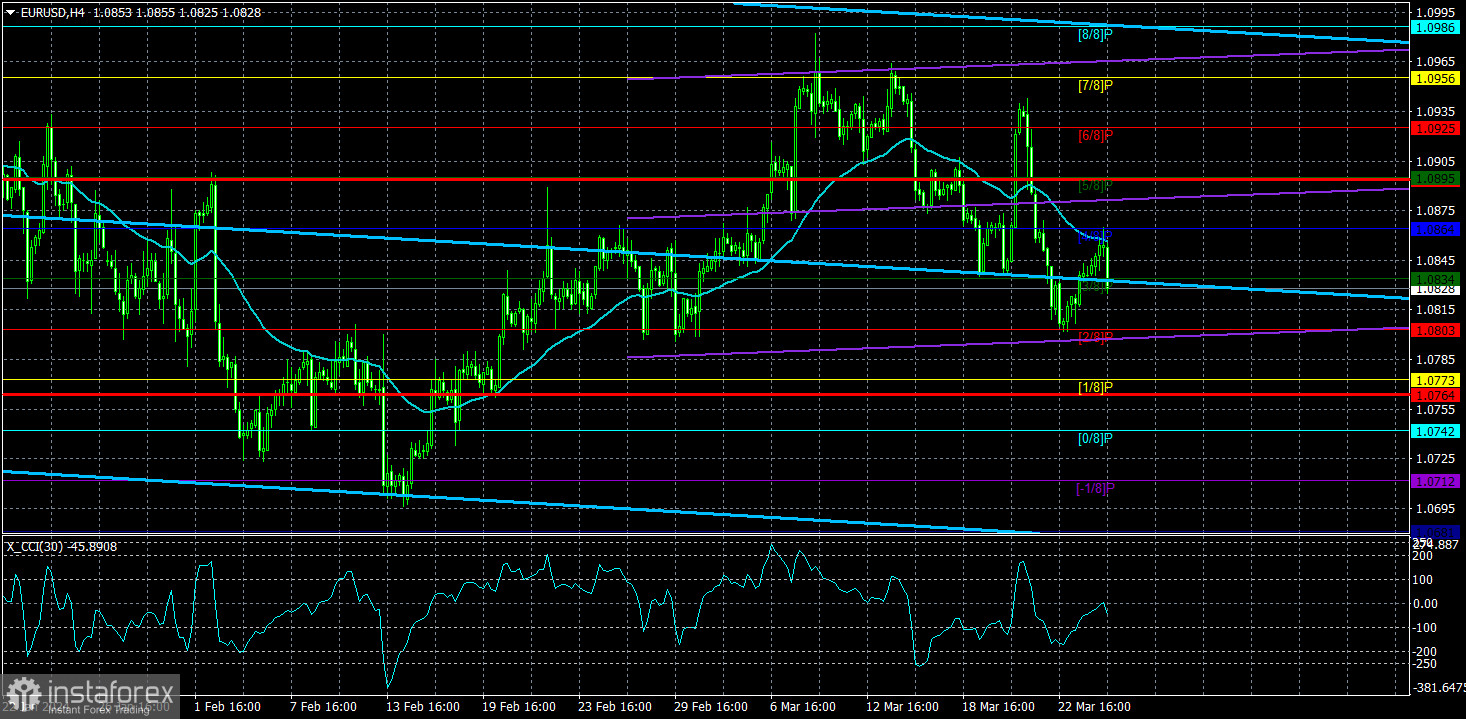
On Tuesday, the EUR/USD currency pair continued to trade calmly with low volatility. During the day, the moving average line was tested, but the downward trend remains intact. Even if there is a confident breakthrough of the moving average, it will not signify the beginning of a new upward trend.

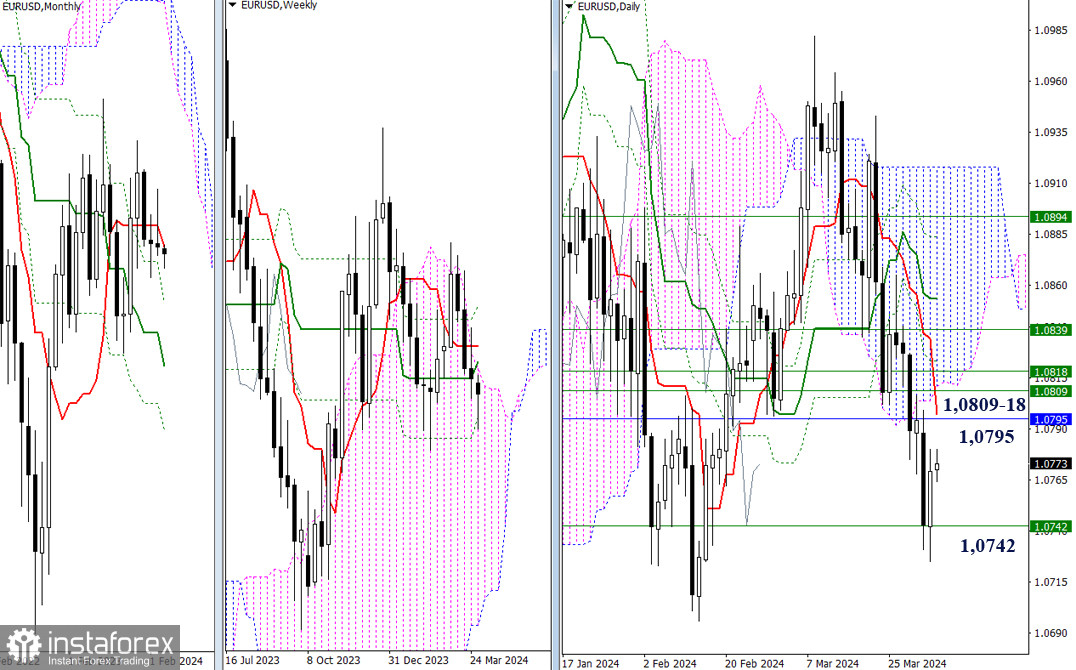
It's worth noting that on the 24-hour TF, the technical picture allows no room for double interpretation. Initially, we saw a strong correction against the new downward trend, followed by a weak correction within the framework of this same downward trend. Thus, the decline of the pair should resume almost in any case. Of course, phrases like "should resume" or "in any case" are unsuitable for the currency market. The point is that market makers dominate the market, often making trading decisions regardless of their fundamental and macroeconomic backgrounds.

However, we pay attention to news and reports, as many market participants do. With the same success, one could say that market makers pay no attention to technical analysis, but that doesn't mean it shouldn't be used now. Therefore, with careful analysis, it becomes clear that, according to common sense and logic, the European currency should continue to decline.

However, only some can command major players to sell euros and buy dollars. Hence, any forecast carries only a certain probability of execution. As long as the price remains below the 4-hour TF moving average and below the Ichimoku indicator lines on the 24-hour TF, it's evident that a resumption of the decline is more likely. Regarding the fundamental background, several ECB representatives spoke during the first two days of the week.

In particular, Christine Lagarde, Philip Lane, and Madis Muller spoke. And last week, almost half of the monetary committee members made speeches. Almost all ECB officials lean towards the necessity of starting rate cuts in June. Only some allow for an earlier or later start to the monetary policy easing cycle. The month of June as a possible date for the first rate cut in the EU means nothing. What matters is the timing relationship between the first-rate cuts in the US and the EU. Since the Fed has a good chance of postponing the first easing from June to a later date (and such a postponement would already be the second one), the fundamental background remains in favor of the US dollar. The Fed will thus keep the rate at its maximum value for much longer than the market expected. Accordingly, its stance is more "hawkish" than it might have seemed a few months ago. Therefore, we expect further strengthening of the US dollar. Of course, this doesn't mean that the pair will move downward with a 100% probability or fall daily. We see that volatility remains low, and the market is cautious. Nevertheless, any pair growth (except for corrective) would be illogical.

Analysis are provided by InstaForex.

Read more: https://ifxpr.com/3IXylf7
IFX Bella
 
Posts: 97
Joined: Sat Dec 08, 2012 12:39 am

Re: Instaforex Analysis

Postby IFX Bella » Thu Mar 28, 2024 9:56 am

Forex Analysis & Reviews: Technical Analysis of Intraday Price Movement of Nasdaq 100 Index, Thursday March 28 2024.

Image

Although on the 4 hour chart of Nasdaq 100 index is moving sideways and ranging, but with the price movement breaking down WMA 20 Shift 2 followed by the appearance of the Bearish 123 pattern followed by several Bearish Ross Hooks (RH) gives an indication that in the near future #NDX has the potential to weaken down to level 18161.1 if this level is successful If it is broken below, #NDX has the potential to continue its decline to the level of 17996.8 as the main target and if the momentum and volatility are supportive then the next level to be aimed at is 17816.8, but if on its way to the target levels mentioned suddenly there will be a correction strengthening, especially if the strengthening correction succeeds in breaking above level 18398.3, then all the downside scenarios that have been described earlier will become invalid and cancel automatically.

Analysis are provided by InstaForex.

Read more: https://ifxpr.com/49kMyNH
IFX Bella
 
Posts: 97
Joined: Sat Dec 08, 2012 12:39 am

Re: Instaforex Analysis

Postby IFX Bella » Fri Mar 29, 2024 9:12 am

Forex Analysis & Reviews: Forecast for EUR/USD on March 29, 2024

Image


EUR/USD Yesterday was a good day for the dollar: the final estimate of the US GDP for the fourth quarter was revised upwards from 3.2% y/y to 3.4% y/y, while the UK GDP contracted by 0.3%, and retail sales in Germany decreased by 1.9%. Today, markets in Europe, the US, and Canada are closed for a holiday, which will contribute to the lackluster price action. From a technical perspective, this allows the price to consolidate below the level of 1.0796 on the daily chart, even if the pair ends the day with gains, it wouldn't even exceed 7 pips. In fact, the target of 1.0724 is already open. The second target is 1.0632.

On the 4-hour chart, the price has already consolidated below the level of 1.0796. The Marlin oscillator is declining in the downtrend territory. The price still hasn't managed to rise above the balance indicator line. The downtrend remains intact. Despite the holiday, Federal Reserve Chief Jerome Powell is scheduled to speak about monetary policy in San Francisco.


Analysis are provided by InstaForex.

Read more: https://ifxpr.com/3vH9qcx
IFX Bella
 
Posts: 97
Joined: Sat Dec 08, 2012 12:39 am

Re: Instaforex Analysis

Postby IFX Bella » Mon Apr 01, 2024 7:39 am

Forex Analysis & Reviews: Indicator Analysis of GBP/USD on April 1, 2024

Image

Today, the price may move upward from the level of 1.2622 (closing of Friday's daily candle) to the 23.6% pullback level at 1.2649 (red dotted line). If this level is reached, a continued upward movement is likely possible to the 38.2% pullback level at 1.2733 (red dotted line). Alternatively, from the level of 1.2622 (closing of Friday's daily candle), the price may move upward to the 61.8% pullback level at 1.2661 (yellow dotted line). If this level is reached, a downward movement is possible to the 23.6% pullback level at 1.2649 (red dotted line).


Analysis are provided by InstaForex.


Read more: https://ifxpr.com/3TDECRX
IFX Bella
 
Posts: 97
Joined: Sat Dec 08, 2012 12:39 am

Re: Instaforex Analysis

Postby IFX Bella » Tue Apr 02, 2024 7:46 am

Forex Analysis & Reviews: Overview of the GBP/USD pair. April 2nd. The British pound continues to ignore the fundamental background

Image

The GBP/USD pair continues to trade in a flat over the 24-hour timeframe. We still expect movements to the south, now with targets at 1.2512 and 1.2489, and the market still extremely reluctantly buys the dollar and sells the pound, often ignoring the fundamental and macroeconomic background. Thus, first, the flat needs to end, and then analyze the technical picture for trading signals. Monday should not mislead traders into believing in the pound's decline. Explanations for illustrations: Linear regression channels - help determine the current trend. If both are directed in the same direction, it means the trend is currently strong. The moving average line (settings 20.0, smoothed) - determines the short-term trend and the direction in which trading should be conducted. Murray levels - target levels for movements and corrections. Volatility levels (red lines) - the probable price channel in which the pair will spend the next day, based on current volatility indicators. CCI indicator - its entry into the oversold zone (below -250) or overbought zone (above +250) indicates an approaching trend reversal in the opposite direction.

Analysis are provided by InstaForex.


Read more: https://ifxpr.com/4ai1NZ4
IFX Bella
 
Posts: 97
Joined: Sat Dec 08, 2012 12:39 am

Re: Instaforex Analysis

Postby IFX Bella » Wed Apr 03, 2024 7:04 am

Forex Analysis & Reviews: EUR/USD and GBP/USD: Technical analysis on April 3

Image


Higher Timeframes At the close of the previous session, the attraction of the weekly support (1.2577) managed to halt the decline and return the market to its influence zone. Therefore, if bearish players want to continue the decline, the targets of which were detailed in yesterday's review, they first need to overcome the attraction and influence of the weekly support at 1.2577. However, if bullish players continue restoring their positions now, the market will first encounter resistance from the daily short-term trend (1.2606), and then the daily cloud may come into play (1.2637 - 1.2671).

GBP/USD

Image

H4 - H1 On lower timeframes, the pair continues to work within a correction zone. Currently, the central pivot point of the day (1.2563) is being used as support. The next supports during intraday decline will be the classic pivot points S1 (1.2548) - S2 (1.2524) - S3 (1.2509). A change in intraday priorities may occur upon the breakthrough and reversal of the weekly long-term trend (1.2601). To further strengthen bullish sentiments, the resistance levels of classic pivot points located above the trend will be crucial, with today's R3 (1.2626) being the reference point.

Analysis are provided by InstaForex.

Read more: https://ifxpr.com/4cK2210
IFX Bella
 
Posts: 97
Joined: Sat Dec 08, 2012 12:39 am

Re: Instaforex Analysis

Postby IFX Bella » Thu Apr 04, 2024 7:19 am

Forex Analysis & Reviews: Hot forecast for EUR/USD on April 4, 2024

Image


Yesterday turned out to be much more eventful than expected. The focus was on the euro area inflation data, which showed that the Harmonized Index of Consumer Prices (HICP) rose 2.4% in March, slowing from a 2.6% increase in February. In addition, US private payrolls increased by 184,000, against a forecast of 125,000. And the icing on the cake was Federal Reserve Chair Jerome Powell saying that the US central bank has time to assess data before it makes a decision on rate cuts. In general, everything pointed to an inevitable and sharp rise in the dollar. However, for some unknown reason, the euro was rising. Contrary to all the reports and official statements. And we can't explain why this happened. Unfortunately, these things happen occasionally. And in this case, it was better to just acknowledge this fact rather than build conspiracy theories trying to explain everything. Obviously, such a thing could only happen in the event of a massive capital outflow from the dollar to the euro. Only a handful of investment funds and banks can do such a thing. But if there is no confirmation on their part, it isn't worth making accusations. Fortunately, as I mentioned above, these things rarely happen. Moreover, fundamentally, such price jumps do not change the situation and the market quickly returns to its usual course. In fact, it may even do so today. The formal reason could be the eurozone producer prices data, the rate of decline of which is likely to slow down from -8.6% to -8.3%. Movement towards stabilizing inflationary processes will convince the market that the European Central Bank will be the first to start lowering its interest rates. So basically, the prospects for the euro are not as bright as they might seem.


The EUR/USD pair surged above the 1.0840 mark, against the logic of fundamental analysis. From a technical perspective, the volume of long positions could have increased after the price upwardly breached the 1.0800 level. On the 30M, 1H and 4H charts, the RSI technical indicator shows signs of the euro's overbought conditions. On the 4-hour chart, the Alligator's MAs are headed upwards. It changed direction when the price suddenly jumped.


Analysis are provided by InstaForex.


Read more: https://ifxpr.com/4aDG5yH
IFX Bella
 
Posts: 97
Joined: Sat Dec 08, 2012 12:39 am

Re: Instaforex Analysis

Postby IFX Bella » Fri Apr 05, 2024 8:58 am

Forex Analysis & Reviews: Analysis and trading tips for USD/JPY on April 5 (US session)

Analysis of transactions and trading tips on USD/JPY Further growth became limited as the test of 151.40 coincided with the sharp rise of the MACD line from zero. Dollar bulls took advantage of the morning dip, but everything could change upon the release of US data. Weak figures on the growth of new jobs will lead to a decline in USD/JPY, which could end with a retest of weekly lows. Strong statistics, on the other hand, will quickly push the pair back towards the yearly high, although that may be unlikely. FOMC members Thomas Barkin and Michelle Bowman will also speak today.

For long positions: Buy when the price hits 151.52 (green line on the chart) and take profit at 152.14. Growth will occur after strong reports from the US and hawkish statements from Fed representatives. When buying, ensure that the MACD line lies above zero or rises from it. Also consider buying USD/JPY after two consecutive price tests of 151.28, but the MACD line should be in the oversold area as only by that will the market reverse to 151.52 and 152.14. For short positions: Sell when the price reaches 151.28 (red line on the chart) and take profit at 150.63. Pressure will return in the case of poor labor market data. When selling, ensure that the MACD line lies below zero or drops down from it. Also consider selling USD/JPY after two consecutive price tests of 151.52, but the MACD line should be in the overbought area as only by that will the market reverse to 151.28 and 150.63.

What's on the chart: Thin green line - entry price at which you can buy USD/JPY Thick green line - estimated price where you can set Take-Profit (TP) or manually fix profits, as further growth above this level is unlikely. Thin red line - entry price at which you can sell USD/JPY Thick red line - estimated price where you can set Take-Profit (TP) or manually fix profits, as further decline below this level is unlikely. MACD line- it is important to be guided by overbought and oversold areas when entering the market Important: Novice traders need to be very careful when making decisions about entering the market. Before the release of important reports, it is best to stay out of the market to avoid being caught in sharp fluctuations in the rate. If you decide to trade during the release of news, then always place stop orders to minimize losses. Without placing stop orders, you can very quickly lose your entire deposit, especially if you do not use money management and trade large volumes. And remember that for successful trading, you need to have a clear trading plan. Spontaneous trading decision based on the current market situation is an inherently losing strategy for an intraday trader.


Analysis are provided by InstaForex.

Read more: https://www.instaforex.eu/forex_analysis/373624
IFX Bella
 
Posts: 97
Joined: Sat Dec 08, 2012 12:39 am

Re: Instaforex Analysis

Postby IFX Bella » Mon Apr 08, 2024 8:43 am

Forex Analysis & Reviews: EUR/USD. April 8th. Preparations for the ECB meeting are in full swing


Image

The EUR/USD pair dropped to the support zone of 1.0785–1.0801 on Friday, rebounded from it, and resumed the upward process towards the Fibonacci retracement level of 38.2%–1.0866. A new rebound from this level will again benefit the US dollar, as will a return to the zone of 1.0785–1.0801. Consolidation of the pair's rate below this zone will increase the probability of further decline towards the Fibonacci level of 0.0% at 1.0696. In my opinion, the option with a decline remains the most consistent.

Image

The wave situation remains quite clear. The last completed downward wave broke the low of the previous wave (from March 19th), and the new upward wave has not yet approached the last peak (from March 21st). Thus, we are currently dealing with a "bearish" trend, and at the moment there is no sign of its completion. For such a sign to appear, the current upward wave must break the current last peak (from March 21st). If the new downward wave fails to break the low from April 2nd, this will also be a sign of the end of the "bearish" trend. The news background on Friday was very strong and extensive. It all started with the report on retail trade in the European Union. Volumes decreased by 0.5% m/m and by 0.7% y/y. Thus, from the very morning on, bears had reasons to counterattack. Next, in the United States, three reports on the labor market, unemployment, and wages were released, which also supported the bears, but the zone of 1.0785–1.0801 proved to be an insurmountable obstacle for them. This week will see the ECB's third meeting this year. I expect that interest rates will not be changed, but Christine Lagarde's statements will indicate that the regulator will be ready to lower rates at the next meeting. It's difficult to say whether the strengthening of the ECB's "dovish" sentiment will help the bears, as the market has long understood that the first easing of monetary policy awaits it in June. But once again, the news background will be on the side of sellers.


Analysis are provided by InstaForex.

Read more: https://ifxpr.com/3PUUP47
IFX Bella
 
Posts: 97
Joined: Sat Dec 08, 2012 12:39 am

Re: Instaforex Analysis

Postby IFX Bella » Tue Apr 09, 2024 7:55 am

Forex Analysis & Reviews: Forecast for USD/JPY on April 9, 2024

USD/JPY


Image

The USD/JPY pair covered the entire range of target levels 150.80-151.95 in two days. On Friday, the price turned upwards from the balance line (red moving average) and from the level of 150.80. This morning, the upper boundary of the range and the embedded line of the global price channel (blue) have been tested.

The signal line of the Marlin oscillator is directed upwards in the positive territory. Consolidating above 151.95 will pave the way for the price to hit the target level of 154.25. A downward movement is possible after the price breaks through 150.80. The pair has a good potential to rise.

Image

On the 4-hour chart, the price has settled above the balance indicator line, testing resistance at 151.95. The Marlin oscillator is in the uptrend territory. Consolidating above 151.95 opens the nearest target along the MACD line at 152.45. Surpassing yesterday's low at 151.58 will relieve the bullish pressure and shift the focus to 150.80.

Analysis are provided by InstaForex.


Read more: https://ifxpr.com/3vCl5to
IFX Bella
 
Posts: 97
Joined: Sat Dec 08, 2012 12:39 am

PreviousNext

Return to Forex Brokers


cron