Technical Analysis of ETH/USD for 30/04/2020: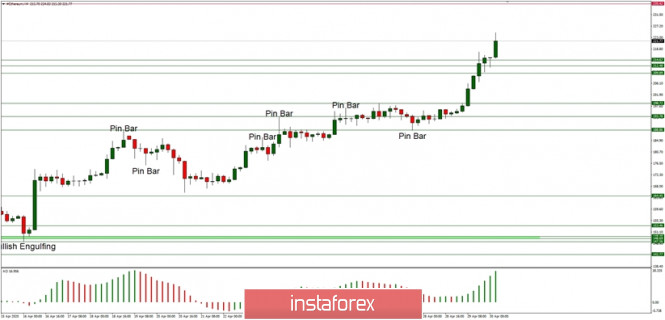
Crypto Industry News:
The China Office of the Central Commission for Cyberspace Affairs (OCCAC) has announced blockchain projects that will receive the approval of national regulatory authorities. 224 projects in this technology have been added to the committee register, including large technology companies such as Alibaba, Baidu and China Mobile.
The list of approved projects includes the ventures of several large corporations, including Walmart China, whose food safety tracking initiative has been marked green, and companies involved in the development of state-supported blockchain networks, such as China Mobile, China Merchants Bank and Alibaba. Some entities have been allowed to implement many DLT projects, and five blockchain projects from China Merchants Bank have already received approval.
On April 25, China announced the commercial launch of the long-awaited Blockchain Service Network (BSN). The Chinese government announced over 2,000 BSN-based programs in the six months prior to the beta release in October 2019, including applications to support social assistance distribution, goods tracking and digital invoicing. On April 20, the city of Ya'an in Sichuan issued a statement supporting the directing of local hydropower to cryptocurrency mining operations, announcing plans to build the so-called Demonstration zones for hydropower consumption.
Technical Market Outlook:
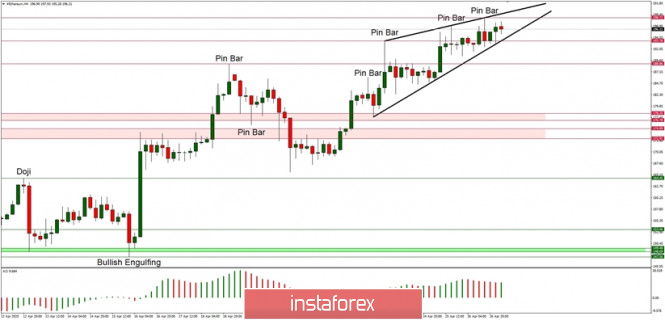
The ETH/USD has been rallying for the last 36h straight as all the technical resistance levels has been violated. The next target for bulls is seen at the level of $235.42, but please notice, that the market conditions are extremely overbought. The nearest technical support is located at the level of $214.67, $212.48 and $209.89. The bulls are in full control of the market.
Weekly Pivot Points:
WR3 - $243.80
WR2 - $220.39
WR1 - $211.16
Weekly Pivot - $187.55
WS1 - $172.98
WS2 - $155.34
WS3 - $144.09
Trading Recommendations:
The fear of the coronavirus consequences is very strong among the global investors and it rules on the financial markets. So far the global investors are not so keen to invest in cryptocurrency, because they are being perceived as risky assets. The larger time frame trend on Ethereum remains down and as long as the level of $214.67 is not violated, all rallies will be treated as a counter-trend corrective moves. This is why the short positions are now more preferred.
Analysis are provided byInstaForex.