Instaforex Analysis

Forex broker related topics and discussions

Re: Instaforex Analysis

Postby IFX Gertrude » Mon Jun 06, 2022 11:37 pm

Forex Analysis & Reviews: Forecast for EUR/USD on June 7, 2022

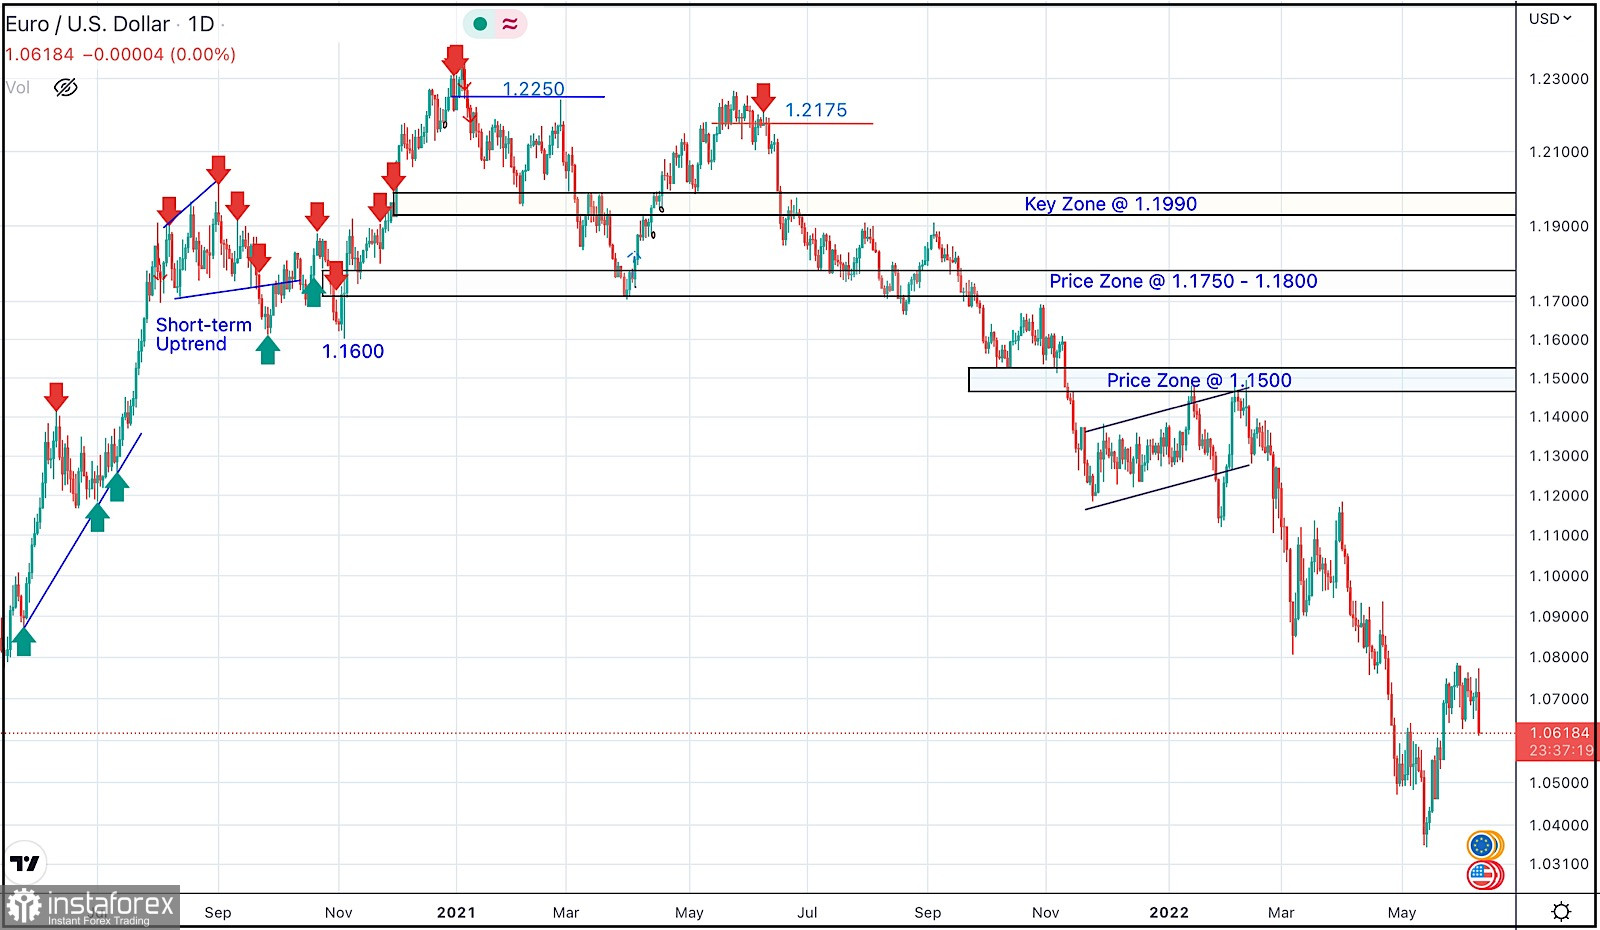
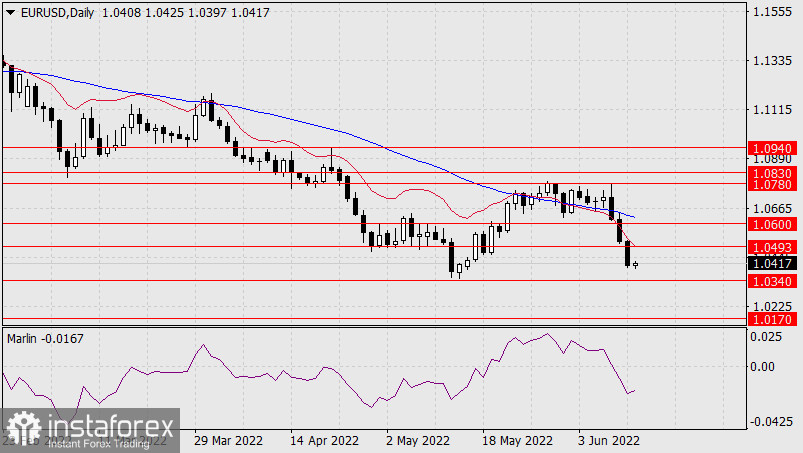
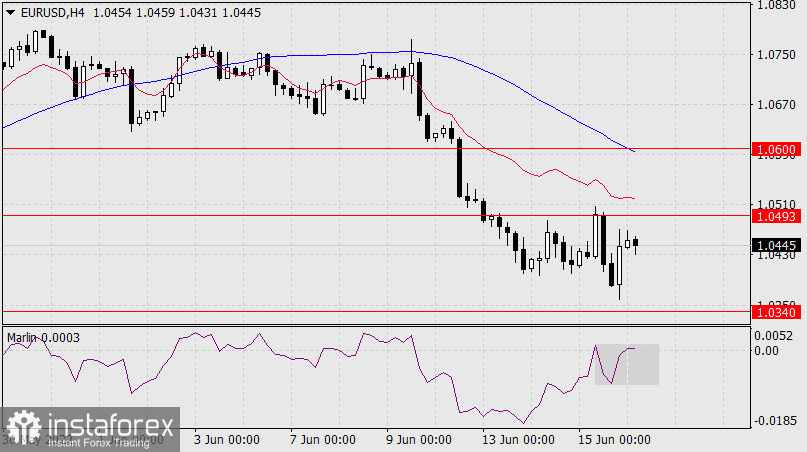
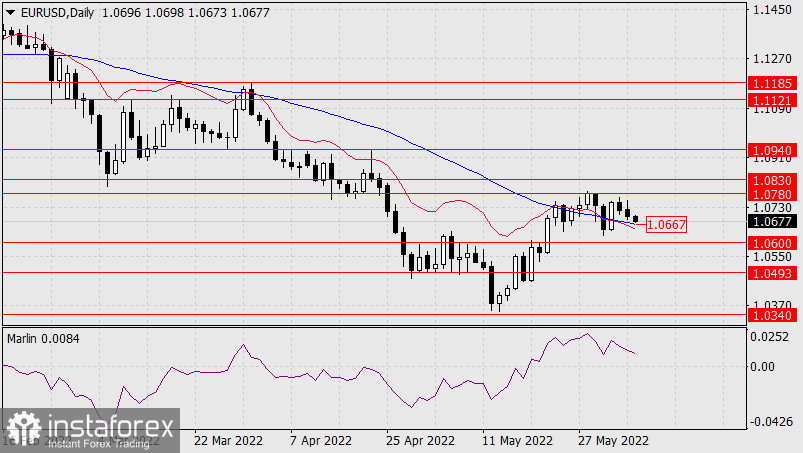
The euro is slowly declining according to the main scenario - moving towards the target level of 1.0493. Since the decline is not fast, the MACD indicator line managed to adapt to it and slightly decrease, thereby lowering the signal level to 1.0667. Now, in order to confidently hit the nearest target at 1.0600, it is necessary to go under 1.0667, otherwise the risk of a jump to 1.0780 will remain. The Marlin Oscillator is declining steadily, the main downside scenario is in force.

Image

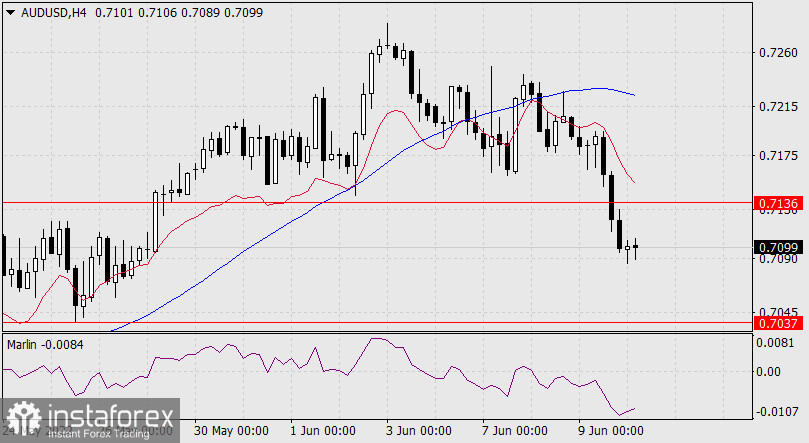
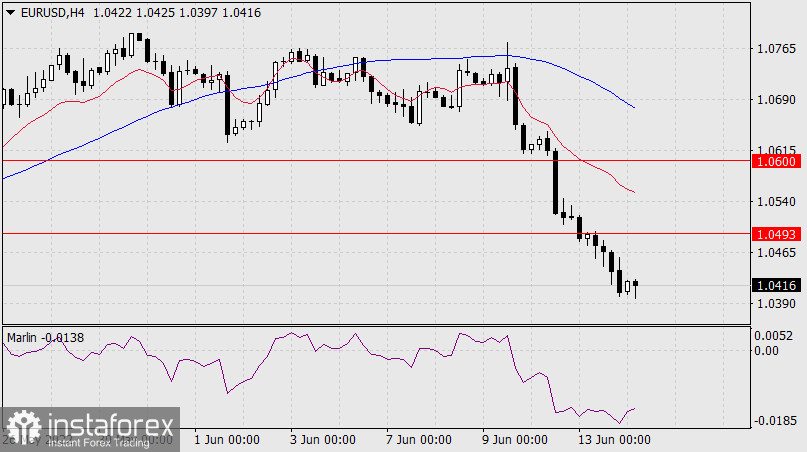
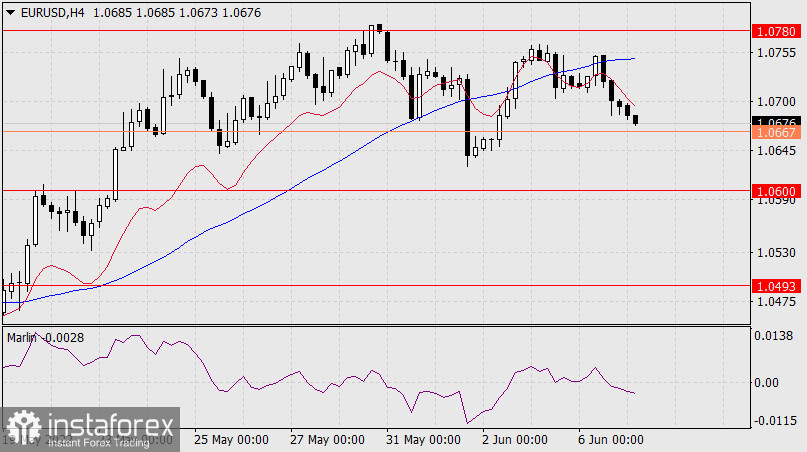
On the 4-hour chart, the Marlin Oscillator has entered negative territory. It, of course, helps the price to go under the signal level of 1.0667. Actually, the price develops under both indicator lines - under the balance line (red) and MACD(blue). The trend is downward.

Image

Analysis are provided byInstaForex.

https://ifxpr.com/3GTDbIm
Best regards, PR Manager

Learn more about InstaForex Company at http://instaforex.com
IFX Gertrude
 
Posts: 5198
Joined: Wed Nov 07, 2012 6:25 am

Re: Instaforex Analysis

Postby IFX Gertrude » Thu Jun 09, 2022 8:02 pm

Forex Analysis & Reviews: June 9, 2022 : EUR/USD daily technical review and trading opportunities.

Image

In late September, Re-closure below the price level of 1.1700 has initiated downside-movement towards 1.1500 where some recovery was witnessed.

Shortly after, Price levels around 1.1700 managed to hold prices for a short period of time before another price decline took place towards 1.1200.

Then the EURUSD has temporarily moved-up within the depicted movement channel until downside breakout occurred recently.

Since then, the price zone around 1.1500 has applied significant SELLING pressure when a valid SELL Entry was offered upon the previous ascending movement towards it.

Shortly after, the EURUSD looked oversold while approaching the price levels of 1.0800. That's where the recent upside movement was previously initiated.

That's why, the recent movement towards 1.1200 was considered for another SELL Trade which is already running in profits now.

The current ascending movement above 1.0600 enabled further advancement towards 1.0850 where bearish rejection can be applied.

Analysis are provided byInstaForex.

https://ifxpr.com/3xhcsB3
Best regards, PR Manager

Learn more about InstaForex Company at http://instaforex.com
IFX Gertrude
 
Posts: 5198
Joined: Wed Nov 07, 2012 6:25 am

Re: Instaforex Analysis

Postby IFX Gertrude » Fri Jun 10, 2022 1:21 am

Forex Analysis & Reviews: Forecast for AUD/USD on June 10, 2022

Yesterday, the Australian dollar decreased under powerful pressure of foreign markets: oil fell by 0.81%, iron ore by 1.18%, S&P 500 -2.38%, the dollar index 0.73%. The aussie lost 91 points.

Image

During the fall, the price overcame the target level of 0.7136, now it faces the nearest level of 0.7037 - the low on May 25 and other historical extremums. With overcoming support, it is likely to decrease to 0.6951 - to the low of May 18. On a four -hour timescale, the price settled under 0.7136, the MACD line turned down, Marlin in the descending trend area. We are waiting for the continuation of the decline in the medium term.

Image

Analysis are provided byInstaForex.

Read More https://ifxpr.com/3mwgnFk
Best regards, PR Manager

Learn more about InstaForex Company at http://instaforex.com
IFX Gertrude
 
Posts: 5198
Joined: Wed Nov 07, 2012 6:25 am

Re: Instaforex Analysis

Postby IFX Gertrude » Mon Jun 13, 2022 1:40 am

Forex Analysis & Reviews: ETHUSD, Potential For Bearish Drop | 13th June 2022

Image

On the H4, with price expected to bounce off the support of the stochastics indicator, we have a bullish bias that price will rise from the 1st support at 1480c in line with the horizontal swing low support and 161.8% Fibonacci extension to our 1st resistance at 1727 in line with the 50% fibonacci retracement and horizontal pullback resistance. Alternatively, price may break structure and head for 2nd support at 1309 in line with the 161.8% Fibonacci projection level.

Trading Recommendation
Entry: 1727
Reason for Entry: 50% fibonacci retracement and horizontal pullback resistanceTake Profit: 1727
Reason for Take Profit: 50% fibonacci retracement and horizontal pullback resistance
Stop Loss: 1309
Reason for Stop Loss:
161.8% Fibonacci projection

Analysis are provided byInstaForex.

https://ifxpr.com/3Hg0zQx
Best regards, PR Manager

Learn more about InstaForex Company at http://instaforex.com
IFX Gertrude
 
Posts: 5198
Joined: Wed Nov 07, 2012 6:25 am

Re: Instaforex Analysis

Postby IFX Gertrude » Tue Jun 14, 2022 2:18 am

Forex Analysis & Reviews: Forecast for EUR/USD on June 14, 2022

Yesterday, the euro was ahead of our forecast - there was a fall of 108 points and now the price is halfway to the target level of 1.0340. There are no obstacles on this path, but the whole question is the speed of further decline. Perhaps today the price will still stop simply because the Federal Reserve will announce its decision on monetary policy tomorrow evening.

Image

It rarely happens when investors are ahead of the curve. But maybe yesterday and today exactly such frequent events occur? Anyway, we are waiting for the price at the target level of 1.0170 in the future for several days.

There is a strong downward local trend on the four-hour chart. The Marlin Oscillator still cannot go deeper into the oversold area and it needs a release. If there is no release, then tomorrow there may be a surprise on the topic "the markets have already taken the rate hike into account". Therefore, today we are still waiting for the price to consolidate so that Marlin can grow and discharge before tomorrow's further decline.

Image

Analysis are provided byInstaForex.

https://ifxpr.com/3OfVUQG
Best regards, PR Manager

Learn more about InstaForex Company at http://instaforex.com
IFX Gertrude
 
Posts: 5198
Joined: Wed Nov 07, 2012 6:25 am

Re: Instaforex Analysis

Postby IFX Gertrude » Wed Jun 15, 2022 2:30 am

Forex Analysis & Reviews: Trading plan for GBPUSD for June 15, 2022

Image

Technical outlook:
GBPUSD dropped through the 1.1933 level on Tuesday before finding bids again. The currency pair managed to rally through 1.2040 thereafter, taking out initial resistance at the 1.2031 mark on the hourly chart. It is seen to be trading around the 1.1990 level at this point of writing and is expected to move higher towards the 1.2665 mark in the near term.

The 1.2665 mark is the initial resistance on the daily chart, and a break there will confirm that a meaningful bottom is in place and that the trend has potentially reversed. Bulls will be poised to hold prices above 1.1900 to keep the medium term favorable for a continued rally. Also note that GBPUSD has dropped through the Fibonacci 0.786 retracement of a larger degree upswing (not seen here).

GBPUSD's overall wave structure remains bullish with the larger degree upswing between 1.1400 and 1.4250 and has retraced through the 78.6% levels. If the above structure holds well, bulls will stage an impressive rally from current levels pushing prices through the 1.2665 mark in the near term.

Trading plan:
Potential rally through 1.2665 against 1.1800

Analysis are provided byInstaForex.

https://ifxpr.com/3Qpl1mj
Best regards, PR Manager

Learn more about InstaForex Company at http://instaforex.com
IFX Gertrude
 
Posts: 5198
Joined: Wed Nov 07, 2012 6:25 am

Re: Instaforex Analysis

Postby IFX Gertrude » Thu Jun 16, 2022 3:31 am

Forex Analysis & Reviews: Forecast for EUR/USD on June 16, 2022

On Wednesday, the US Federal Reserve raised its base rate from 1.00% to 1.75%, in line with bold expectations. The majority of investors expected an increase to 1.50%. The sharp increase in the rate led to massive purchases of US government bonds, th

Image

Yesterday, the euro traded within the range of target levels 1.0340-1.0493. Its growth is visually perceived as a correction. We believe that the imbalance of the single currency due to a strong rate hike will end today, so we are waiting for the closing of the day with a decrease. And then we are waiting for the price to leave under the support of 1.0340 and advance to 1.0170. On the four-hour chart, the Marlin Oscillator shows the intention to turn down from the border with the growth territory. It is very similar to the fact that the oscillator is forming a short-term range in the negative zone. And this is consolidation before the next decline.

Image

Analysis are provided byInstaForex.

https://ifxpr.com/3xVaeZJ
Best regards, PR Manager

Learn more about InstaForex Company at http://instaforex.com
IFX Gertrude
 
Posts: 5198
Joined: Wed Nov 07, 2012 6:25 am

Re: Instaforex Analysis

Postby IFX Gertrude » Fri Jun 17, 2022 1:58 am

Forex Analysis & Reviews: Forecast for USD/JPY on June 17, 2022

For the last two days, Wednesday and Thursday, the yen corrected after a strong growth since the final days of May. The correction ended at the embedded price channel line at 131.48. The Marlin Oscillator has not left the positive area, which confirms the corrective nature of the decline.

Image

In today's Asian session the pair is trying to go over the resistance of the upper sloping line at 133.80 as soon as possible. If it succeeds, then the target opens at 135.59 (high on June 15), then 137.20.

On the 4-hour chart, the price had a good momentum before attacking 133.80, and above this level there is the MACD line (134.65), which needs to be overcome before the key event of the transition above 135.59. The Marlin Oscillator has not yet left the downward trend, it needs to do so as soon as possible, because without the help of the oscillator, the price may not move above the MACD line. The main scenario is rising.

Image

Analysis are provided byInstaForex.

https://ifxpr.com/3tHQy95
Best regards, PR Manager

Learn more about InstaForex Company at http://instaforex.com
IFX Gertrude
 
Posts: 5198
Joined: Wed Nov 07, 2012 6:25 am

Re: Instaforex Analysis

Postby IFX Gertrude » Mon Jun 20, 2022 3:54 am

Forex Analysis & Reviews: Technical Analysis of EUR/USD for June 20, 2022

Technical Market Outlook:
The EUR/USD pair had almost retraced 61% of the last wave down and made a Pin Bar candlestick at the level of 1.0661, 14 pips away from the Fibonacci retracement level. Since then, the bulls keep trying to continue the bounce, keep making the local pull-backs, but the level of 1.0615 is still unreachable for them. The nearest technical support is seen at 1.0469 - 1.0448, so as long as the market trades above this zone, the outlook remains bullish. Please notice, that despite the recent efforts, the bulls are still trading inside the bearish zone and they need to break above the level of 1.0678 to enter the bullish zone.

Image

The up trend can be continued towards the next long-term target located at the level of 1.1186 only if the complex corrective structure will terminate soon (above 1.0335) and the market breaks above 1.0678 level. The bullish cycle scenario is confirmed by breakout above the level of 1.0726, otherwise the bears will push the price lower towards the next long-term target at the level of 1.0335 or below.

Analysis are provided byInstaForex.

https://ifxpr.com/3QBGjgn
Best regards, PR Manager

Learn more about InstaForex Company at http://instaforex.com
IFX Gertrude
 
Posts: 5198
Joined: Wed Nov 07, 2012 6:25 am

Re: Instaforex Analysis

Postby IFX Gertrude » Tue Jun 21, 2022 1:39 am

Forex Analysis & Reviews: ETHUSD, Potential For Bearish drop | 21st June 2022

Image

Description On the H4, with price moving below our ichimoku cloud, we have a bearish bias that price will drop to our 1st support at 702 in line with the 78.6% Fibonacci projection level from our 1st resistance at 1282 in line with the horizontal pullback resistance is. Alternatively, price may not break structure and head for our 2nd resistance at 1739 where the pullback resistance and 23.6% Fibonacci retracement.

Trading Recommendation
Entry: 1282 Reason for Entry: Horizontal pullback resistance
Take Profit: 702Reason for Take Profit:78.6% Fibonacci projection
Stop Loss: 1739 Reason for Stop Loss:Horizontal pullback resistance and 23.6% Fibonacci retracement

Analysis are provided byInstaForex.

https://ifxpr.com/3zRXEfl
Best regards, PR Manager

Learn more about InstaForex Company at http://instaforex.com
IFX Gertrude
 
Posts: 5198
Joined: Wed Nov 07, 2012 6:25 am

PreviousNext

Return to Forex Brokers