Instaforex Analysis

Forex broker related topics and discussions

Re: Instaforex Analysis

Postby IFX Bella » Fri Aug 09, 2024 5:49 am

Forex Analysis & Reviews: New round of gains: Nasdaq, S&P 500 up 2% on US unemployment report

Image

US stocks rally: S&P 500 and Nasdaq jump more than 2% US stock markets surged higher on Thursday, with major indices including the Nasdaq and S&P 500 ending the day up more than 2%. The gains were driven by an unexpected drop in jobless claims, which eased concerns about a possible sharp slowdown in the labor market. Rebound Across Sectors All sectors of the S&P 500 gained, with the biggest gainers being technology (.SPLRCT) and communications services (.SPLRCL). Small-caps also saw strong gains, with the Russell 2000 (.RUT) up 2.4%. Eli Lilly Rises Among the top gainers was pharmaceutical company Eli Lilly (LLY.N), which soared 9.5% after the company raised its full-year profit forecast and sales of its popular weight-loss drug Zepbound topped $1 billion for the first time in a quarter. Positive Labor Market Data A larger-than-expected decline in jobless claims gave markets a boost. Impact of Reports and Recession Fears Last week, the US employment reports for July raised concerns about a possible recession, leading to a sharp decline in stocks. Traders also noted an unwinding of positions in the carry trade, a strategy in which investors borrow money from low-interest-rate economies to invest in high-yielding assets. The market continues to react to macroeconomic data, and investors will be closely watching new data in the coming weeks to assess the state of the economy and possible prospects. Dow Jones, S&P 500 and Nasdaq ended the day on a solid rise US stock indexes ended the trading day with significant gains. The Dow Jones Industrial Average (.DJI) rose 683.04 points, or 1.76%, to 39,446.49. The S&P 500 (.SPX) rose 119.81 points, or 2.30%, to 5,319.31. Meanwhile, the Nasdaq Composite (.IXIC) rose 464.22 points, or 2.87%, to end the day at 16,660.02. Volatility Declines: Wall Street Calms Down The Cboe Volatility Index (.VIX), often called Wall Street's fear gauge, declined Thursday, suggesting that sentiment is stabilizing. However, experts caution that the current gains do not necessarily mean the market has bottomed out. "Once volatility starts to rise, it takes a while for it to calm down," said David Lundgren, chief market strategist and portfolio manager at Little Harbor Advisors. He also added that the current growth does not guarantee an immediate continuation of the rise, but if we look at the three- to six-month horizon, the probability of above-average returns is quite high. End of the earnings season: Investor expectations As the second-quarter earnings season comes to an end, investors are eagerly awaiting the final results. There were some disappointments at the start of the reporting period, but the market remains focused on the latest data. Under Armour surprises the markets One of the most significant events of the day was the sudden rise of Under Armour (UAA.N) shares by 19.2%. The company pleased investors with a surprise first-quarter profit, which was the result of successful efforts to reduce inventory and promotions. Trading activity: Moderate recovery Trading volume on U.S. exchanges amounted to 11.98 billion shares, slightly below the average of 12.60 billion over the past 20 trading days. However, the market remains active, and participants continue to closely monitor further economic indicators and corporate reports. Advances outnumber decliners on the New York Stock Exchange (NYSE) 3.59 to 1. The same was true on the Nasdaq, where for every decliner, there were 2.76 gainers. The S&P 500 has posted 7 new highs in the past 52 weeks, but also 4 new lows. Meanwhile, the Nasdaq Composite has posted 32 new highs, but 183 new lows. Global Markets Strengthen on Better Unemployment Data A closely watched global stock index jumped more than 1% on Thursday, helped by lower-than-expected U.S. jobless claims data. The results eased recession fears and helped lift Treasury yields and the dollar. Oil Market Rises as Supply Concerns Outweigh Demand Oil futures prices rose for a third straight day, led by rising supply risks in the Middle East, offsetting demand concerns that earlier this week sent prices to their lowest since early 2024. Jobless Claims Drop Sharply in 11 Months The Labor Department reported Thursday that initial claims for federal unemployment benefits fell by 17,000 to a seasonally adjusted 233,000 in the week ended Aug. 3. That was the largest decline in 11 months and below economists' forecast of 240,000. Data Focus Amid Market Volatility These jobless claims data are especially important following Friday's weaker-than-expected July jobs report, which triggered a slump in financial markets on Monday that affected not only the U.S. but also global markets. Amid such volatility, investors continue to watch economic data closely to gauge future market developments. Markets on Edge: Investors Unwind Carry Trades The recent market selloff was driven in part by investors unwinding their carry trades, a strategy that involves using cheap borrowing in Japan to buy dollars and other currencies that are then invested in higher-yielding assets. The unwinding of such trades sent Japanese stocks down 12% on Monday, followed by a 3% decline in the S&P 500 (.SPX). Volatility Ahead: Uncertainties Rise Experts warn that there could be more volatility ahead, and it won't just be driven by the seasonal weakness that is typical in August and September. Heightened geopolitical tensions in the Middle East, the upcoming US elections and economic data that the Federal Reserve will be watching closely are creating a high degree of uncertainty in the market. "The market doesn't like uncertainty, and we are in that period now," says Irene Tankel, chief US equity strategist at BCA Research. European and global indices: modest gains amid volatility While US markets faced turbulence, Europe's STOXX 600 index (.STOXX) closed with a modest gain of 0.08%. The MSCI Global Equity Index (.MIWD00000PUS) also showed positive dynamics, rising 11.40 points, or 1.48%, to 782.10. FX: Dollar strengthens amid global uncertainty In currency markets, the dollar index, which tracks the greenback against a basket of major global currencies including the yen and the euro, rose 0.09% to 103.20. The euro, by contrast, weakened slightly, falling 0.04% to $1.0917. Against the Japanese yen, the dollar strengthened 0.3% to 147.13. Record volatility: Global markets on edge Before Thursday, the global equity index had posted 16 days of gains or losses of more than 1% this year, while the S&P 500 had recorded 32 such moves. This highlights the record volatility that markets have seen this year, and investors should brace for more volatility in the coming months. U.S. Treasury yields continue to rise on positive economic data U.S. Treasury yields continued to rise on Thursday, helped by jobless claims data that bolstered confidence that the U.S. economy can avoid an imminent recession. The data supported expectations for economic resilience, pushing yields higher. In addition, weak demand at the 30-year bond auction added to the yields' upward movement, continuing a trend that began amid similarly weak selling of 10-year notes the previous day. Yields Rising: Key Indicators The yield on the 10-year U.S. Treasury note rose 2.1 basis points to 3.988%, up from 3.967% at the close of trading on Wednesday. The yield on the 30-year note also rose, adding 1.6 basis points to 4.2775%, up from 4.261% the previous day. Meanwhile, the yield on the 2-year note, which often reflects expectations for future interest rates, rose 2.9 basis points to 4.0297%, up from 4.001% the previous day. Oil Markets: Oil Prices Continue to Rise Strongly Energy markets also saw gains. U.S. crude oil rose 1.28%, or 96 cents, to $76.19 a barrel. European benchmark Brent crude settled at $79.16 a barrel, up 1.06% from the previous day. Gold Shows Strong Gains In the precious metals market, gold prices also continued to rise. Spot gold prices rose 1.78% to $2,423.87 an ounce. U.S. gold futures also showed positive dynamics, rising 1.25% to $2,420.50 an ounce. Economic confidence boosts demand for assets Rising Treasury yields and stronger oil and gold positions indicate continued optimism in the markets despite some economic concerns. Investors continue to seek assets that can protect them from potential volatility, and current economic data only strengthens their confidence in the resilience of the U.S. economy

news are provided by InstaForex.

Read more: https://ifxpr.com/3WCfnRv
IFX Bella
 
Posts: 219
Joined: Sat Dec 08, 2012 12:39 am

Re: Instaforex Analysis

Postby IFX Bella » Mon Aug 12, 2024 3:35 am

Forex Analysis & Reviews: Forecast for EUR/USD on August 12, 2024

Image

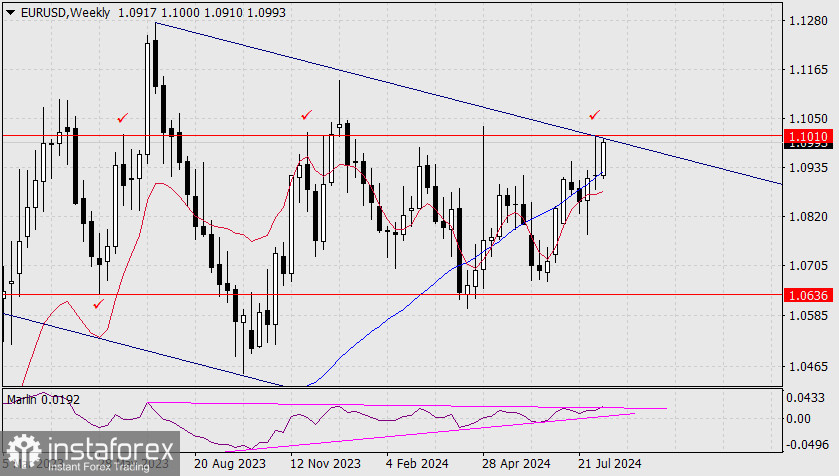
On the weekly chart, the price consolidated above the MACD indicator line. The probability of a retest of the target level of 1.1010 or reaching 1.1043 has slightly increased. At the same time, we observe the formation of a very extended wedge on the Marlin oscillator.

Image

Long wedges rarely precede strong, sustained movements; however, the price is clearly on the brink of significant changes that could take it out of the prolonged range of 1.0636-1.1010. If the price breaks below this range, the target levels are 1.0369 and 1.0173.

Image

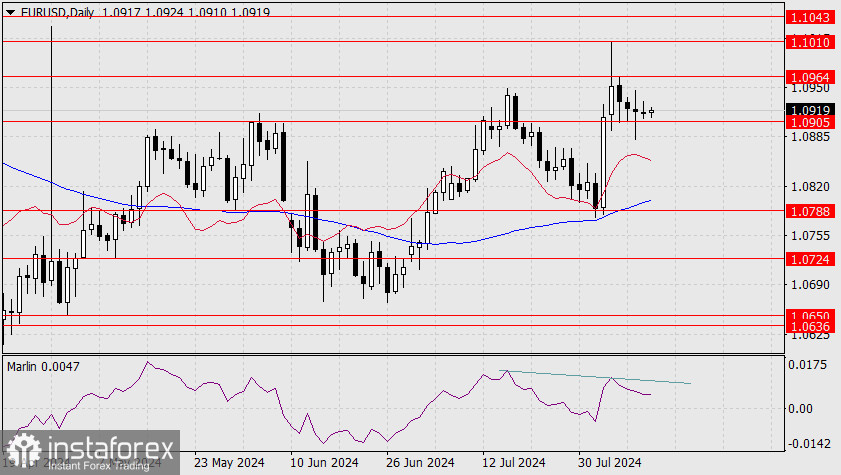
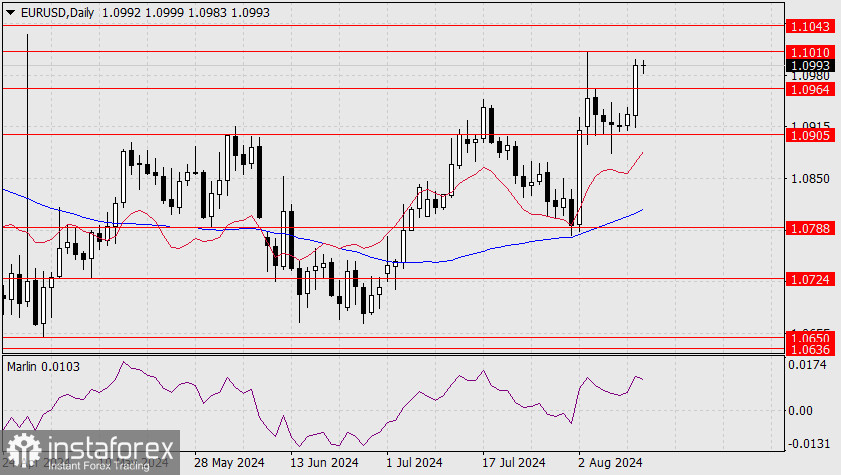
On the daily chart, the price struggles with the support at 1.0905, aided by divergence with the Marlin oscillator. Therefore, a weekly close in the form of a Doji could also be a false signal. A daily close below the 1.0905 level would indicate the development of the main bearish scenario. After all, the opening of a new weekly candle occurred below the MACD line.

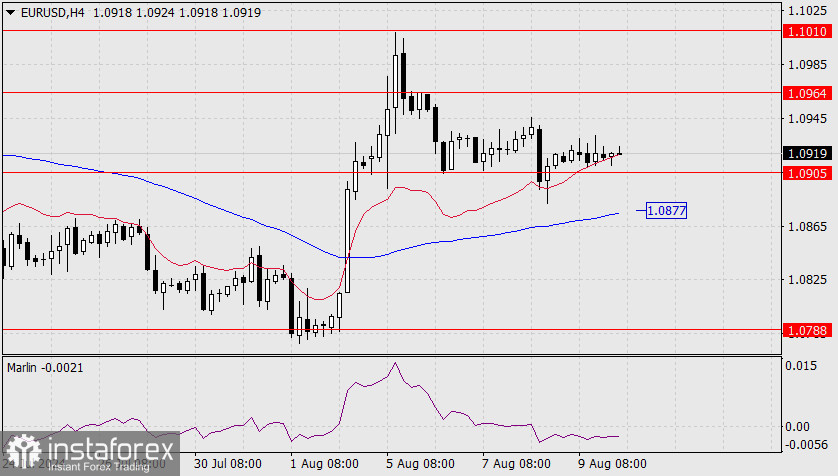
On the 4-hour chart, the price is currently moving above the balance indicator line (red moving average). If the price consolidation above 1.0905 continues, the balance line will be above the price. The signal line of the Marlin oscillator is moving sideways in negative (descending) territory, which increases the likelihood of the price dropping below support in this time frame. Moving below the MACD line (1.0877) would confirm the price's intention to reach the 1.0788 target.

Analysis are provided by InstaForex.

Read more: https://ifxpr.com/3Aokb5F
IFX Bella
 
Posts: 219
Joined: Sat Dec 08, 2012 12:39 am

Re: Instaforex Analysis

Postby IFX Bella » Tue Aug 13, 2024 4:18 am

Forex Analysis & Reviews: Forecast for EUR/USD on August 13, 2024

Image

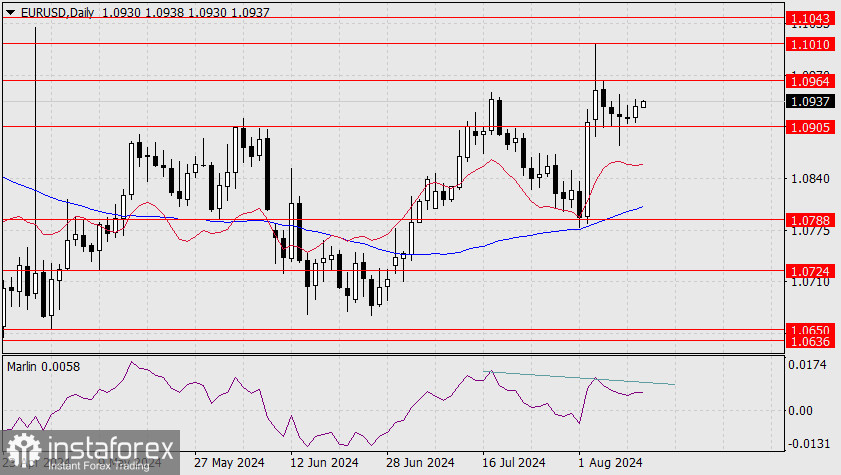
The euro's consolidation above 1.0905 continues. Yesterday's session closed with a white candlestick, so formally, the probability of the price moving above 1.1010 has slightly increased. However, the price has yet to climb above 1.0964, and the Marlin oscillator continues to apply downward pressure through technical divergence.

Image

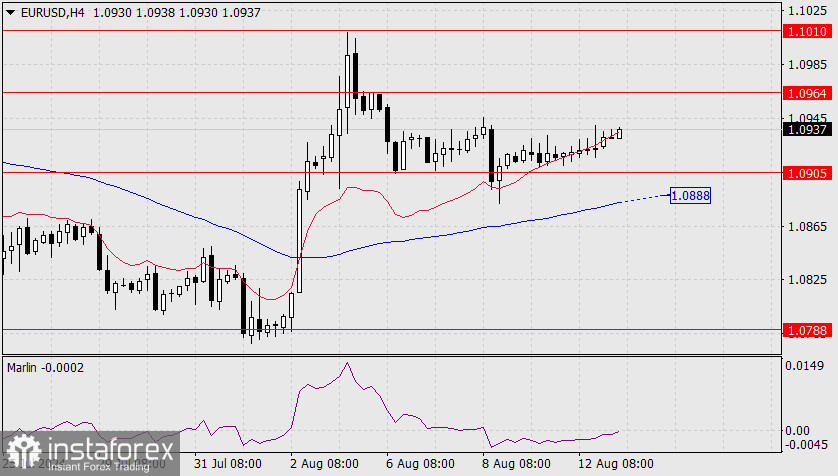
On the 4-hour chart, the price is moving along the balance line, highlighting the situation's neutrality. The Marlin oscillator has approached the zero line.

A drop in price below the 1.0905 support would be significant, indicating a potential development of a downward, likely medium-term movement. A shift in the quote below the MACD line, beneath the 1.0888 mark, would confirm this

Analysis are provided by InstaForex.


Read more: https://ifxpr.com/3Ak6RiP
IFX Bella
 
Posts: 219
Joined: Sat Dec 08, 2012 12:39 am

Re: Instaforex Analysis

Postby IFX Bella » Tue Aug 13, 2024 4:23 am

Forex Analysis & Reviews: Awaiting CPI: How Wall Street is preparing for the next round of events

Wall Street ends trading session with mixed results as investors await key economic data Wall Street ended trading mixed on Monday as market participants prepared for important economic data to be released this week. Investors are particularly focused on the upcoming U.S. consumer price data, which will determine the future course of the Federal Reserve's monetary policy. Indexes mixed The Dow Jones Industrial Average lost ground, while the benchmark S&P 500 and tech-heavy Nasdaq Composite ended modestly higher. Meanwhile, the Russell 2000 index of smaller companies fell 0.9%. Popular rotation is losing momentum "The recent trend of investors to switch to smaller companies like the Russell 2000, cyclicals and financials has already begun to wane," said James Abate, chief investment officer at Centre Asset Management in New York. He said current economic conditions are not conducive to sustained earnings and stock price growth. Focus on Consumer Prices and Retail Sales Investors are looking ahead to the U.S. consumer price index (CPI) this week, due on Wednesday. The data is expected to show inflation accelerating 0.2% in July from June, with the annual inflation rate remaining at 3%. Market participants are also focused on reports from major retailers, which will help gauge current consumer demand. Rate Forecasts: What the Market Expects The consensus in the money market is that the Fed could cut interest rates by 25 or 50 basis points as early as September. According to CME's FedWatch tool, a total monetary easing of 100 basis points is expected by the end of 2024. Investors Await Retail Sales Data: Potential Impact on the Economy Investors will be focused on the US retail sales report for July on Thursday. While expectations point to a modest increase, any weakness in the data could reignite concerns about slowing consumer demand and even the possibility of a recession. Walmart and Home Depot earnings under scrutiny Big retailers like Walmart and Home Depot are also set to report earnings in the coming days. The results will be closely watched by analysts and investors as they provide an important indicator of the health of the consumer market amid rising unemployment. Market Risks: Inflation and Consumer Sentiment James Abate, chief investment officer at Centre Asset Management, warns that a surprise rise in inflation that exceeds expectations could seriously disappoint the market. He says retail earnings are especially important now given recent signs of labor market trouble. Indices mixed The trading session ended mixed, with the S&P 500 up 0.23 points to 5,344.39 and the Nasdaq Composite up 35.31 points, or 0.21%, to 16,780.61. Meanwhile, the Dow Jones Industrial Average fell 140.53 points, or 0.36%, to close at 39,357.01. Starbucks on the rise, KeyCorp attracts investors Starbucks shares soared 2.58% after reports that activist investor Starboard Value, which holds a stake in the company, is pushing for measures aimed at boosting the coffee giant's stock. KeyCorp also posted a strong gain of 9.1% after Canadian bank Scotiabank announced it had acquired a minority stake in the U.S. regional lender for $2.8 billion. Hawaiian Electric's Future in Doubt Meanwhile, Hawaiian Electric shares plunged 14.45% as the utility expressed concerns about its ability to continue operating amid mounting financial difficulties. Equity Market: Declines Prevail, but Volatility Eases Trading on the New York Stock Exchange (NYSE) and Nasdaq ended with decliners dominating. On the NYSE, the ratio of decliners to gainers was 1.46 to 1, while on the Nasdaq, the ratio was even higher at 1.54 to 1. New Highs and Lows: Daily Stats The S&P 500 posted 10 new 52-week highs and 7 new lows, while the Nasdaq Composite posted 51 new highs and 179 new lows. These figures show that despite the overall decline, there are still some growth points in the market. Soothing Volatility: Markets Try to Stabilize While volatility in the markets has eased significantly since last week, when U.S. stocks suffered a sharp decline, nervousness among investors may persist for some time. The panic flare-up appears to have died down, but history shows that markets can remain under pressure for months. Cboe Volatility Index Returns to Normal The Cboe Volatility Index, commonly known as the VIX and often referred to as the "fear index," has stabilized near 20 after hitting a four-year high last week. That's down from its recent peak of 38.57 on August 5. The rapid decline in the VIX is a sign that the sharp moves in the market were driven by short-term factors, such as the unwinding of highly leveraged positions, rather than fundamental issues related to the state of the global economy. Bet on Stability: Short-Term Factors Dominate Many market participants see the dissipation of fears as further confirmation that the recent collapse was driven by technicals, including the unwinding of leveraged positions and carry trades financed by the Japanese yen. Investors are confident that these factors are temporary and do not point to deeper structural problems in the global economy. Markets Remain Tense: VIX Volatility as an Anxiety Indicator Despite the recent decline in the VIX volatility index, history shows that markets can remain in a state of heightened anxiety for months after a sharp decline. Episodes where the VIX has risen above 35 are usually followed by a prolonged period of investor caution, which dampens the risk-taking that had previously fueled asset prices. Volatility Takes Time to Normalize According to experts, after the VIX reaches a level above 35, which is often associated with a high degree of anxiety among market participants, it takes about 170 trading sessions on average for the index to return to its long-term median of 17.6. This highlights that even after an initial calm, markets can remain volatile for a long time. Investors Are Temporarily Calmed, But Anxiety Remains J.J. Kinahan, CEO of IG North America and president of online broker Tastytrade, said: "Once the VIX stabilizes in a range, investors begin to feel more relaxed again. However, shocks like the current one usually linger in the memory for six to nine months, maintaining a heightened sense of caution." The S&P 500's Long Rise The recent turmoil in the U.S. stock market has come after a long period of stability and growth. The S&P 500 has risen 19% for the year, hitting a record high in early July. However, the rally has proven to be unsustainable: poor earnings reports from several major tech companies in July triggered a massive sell-off, sending the VIX rising from the low end of the tens of points to higher levels. Unexpected BOJ Action Adds Volatility The crisis deepened in late July and early August when the BOJ unexpectedly raised interest rates by 25 basis points. The move hurt carry traders who had borrowed cheaply in Japanese yen to invest in high-yielding assets such as U.S. tech stocks and Bitcoin. Fast Fall and Rebound: Positional Risk Dominates Mandy Xu, head of derivatives research at Cboe Global Markets, said the sharp market decline followed by an equally rapid rebound suggests that the current gyrations are largely due to position unwinding and risk shifting among market participants. Volatility Isolated: Equities and FX Under Pressure Mandy Xu, head of derivatives research at Cboe Global Markets, stressed that recent spikes in volatility, such as the one seen on August 5, have been concentrated in equities and FX. She noted that other asset classes, such as interest rates and credit, have not seen a significant increase in volatility, suggesting that the current swings are limited. Investor Jitters: Awaiting Key Data With uncertainty still looming, investors have every reason to be nervous in the coming months. The biggest worry remains economic data due out of the US. The consumer price report due out later this week will be a key indicator of whether the economy is facing a short-term slowdown or heading for a more serious slowdown. Political Tensions Add to Uncertainty Political uncertainty is also adding fuel to the fire. With the US elections in November and tensions rising in the Middle East, investors remain on edge as they watch for developments that could significantly impact the market. Awaiting Inflation and Retail Earnings Data Investors will be focused on the CPI data due out on August 14. In addition, earnings reports from giants like Walmart and other major retailers this week could be key to shaping market sentiment. Mark Hackett, head of investment research at Nationwide, said these data could have a decisive impact on investor behavior. Emotional reactions in the market: forecasts and risks "It is not surprising that in light of recent events, investors may overreact to inflation data, retail earnings and retail sales," Hackett said. In the current emotional environment, any deviations from expectations could cause significant volatility.

News are provided by InstaForex.

Read more: https://ifxpr.com/3YGBTv8
IFX Bella
 
Posts: 219
Joined: Sat Dec 08, 2012 12:39 am

Re: Instaforex Analysis

Postby IFX Bella » Wed Aug 14, 2024 3:05 am

Forex Analysis & Reviews: Forecast for EUR/USD on August 14, 2024

Image

The euro's neutral situation gained upward momentum yesterday. On the weekly chart, the Marlin oscillator's signal line emerged from the wedge upwards

If the price manages to consolidate above the level of 1.1010 on the daily chart, it could potentially open up a medium-term growth prospect. The first target would be 1.1043, followed by 1.1085—the peak from December 28 of last year.

Image

n the daily chart, the divergence has transformed into a regular upward movement of the Marlin oscillator, which is still far from overbought conditions. Forming a double top is only possible if the price falls from 1.1010.

In the 4-hour chart, the euro continues to rise. The price broke away from the balance line upwards, and the Marlin oscillator entered positive territory. We await key developments at the critical level of 1.1010.

Analysis are provided by InstaForex.

Read more: https://ifxpr.com/3SKcjSg
IFX Bella
 
Posts: 219
Joined: Sat Dec 08, 2012 12:39 am

Re: Instaforex Analysis

Postby IFX Bella » Wed Aug 14, 2024 3:09 am

Forex Analysis & Reviews: Wall Street Bulls: Weak PPI Data Pushes Market Higher

Indices Rise on Rate Cut Expectations US stock markets posted solid gains on Tuesday, finishing at a nearly two-week high. The gains were driven by data showing slower PPI growth, bolstering expectations for a Federal Reserve rate cut as early as September. Slow Producer Price Growth: What It Means for the Economy US producer prices increased less than expected in July, according to new data. This was due to a decline in services costs, which offset the rise in goods prices. On an annualized basis, the producer price index (PPI) rose by 2.2%, which is lower than the 2.7% increase in June. This suggests that inflationary pressures continue to ease, which supports market optimism about possible monetary easing. Expectations of rate cuts boost the market rally Wall Street reacted positively to the data, betting on interest rate cuts soon. According to Paul Ashworth, chief North American economist at Capital Economics, while the modest 0.1% month-on-month increase in PPI and the flat core PPI may not seem like much, they are still in line with the Fed's target of inflation below 2% year-on-year. Investors await new data Market participants' attention is now focused on the upcoming consumer price data for July, which will be published on Wednesday, and retail sales data, expected on Thursday. These reports will help investors form clearer expectations about the Fed's further actions. Michael James, managing director of equity trading at Wedbush Securities, noted that the stable PPI data confirms the effectiveness of the Fed's efforts to control inflation. He also emphasized that the likelihood of a rate cut in the near future is becoming increasingly real. Thus, the market is optimistic about the prospects for monetary easing, which contributed to today's growth of indices. Crucial inflation data Ahead of the publication of the consumer price index, market participants are in a state of heightened anxiety. Economists and investors agree that any deviations in inflation indicators can significantly affect the dynamics of trading. "Any information we get tomorrow morning will have a significant impact on the market because everyone is very tense right now," analysts said.

News are provided by InstaForex.

Read more: https://ifxpr.com/4fJrS6A
IFX Bella
 
Posts: 219
Joined: Sat Dec 08, 2012 12:39 am

Re: Instaforex Analysis

Postby IFX Bella » Mon Sep 02, 2024 3:54 am

Forex Analysis & Reviews: Forecast for EUR/USD on September 2, 2024

Image

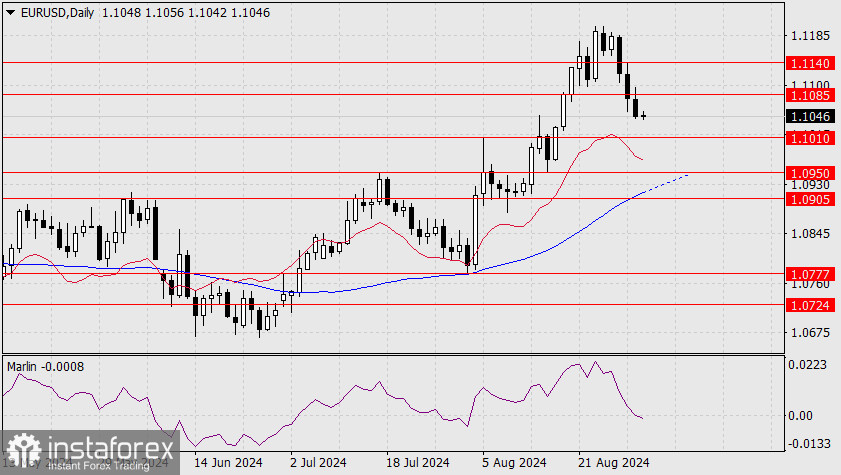
Following the release of U.S. data on personal consumption expenditures (PCE) and personal income/spending from Friday, the dollar index increased by 0.35%. The euro declined by 30 points, settling below the 1.1085 level. The decline paused at the peak level from August 14. Additionally, the signal line of the Marlin oscillator has reached the boundary of the declining trend territory and suggests a potential correction. However, the main reason for the strengthening of the bulls is that stock market indices are aiming to set new historical records. If the stock market continues to rise, the euro is unlikely to reach the target supp

Today is a holiday in the U.S. and Canada, and with the ECB expected to lower rates in 10 days, the euro may not challenge the 1.0950 level too soon. Today and tomorrow, the euro will likely test the resistance at 1.1085. A subsequent attempt to reach 1.1010 is possible, as the price is currently trading within the range of 1.1010 to 1.1085. Declining commodity prices in the local situation will help the dollar.

On the H4 chart, the price and oscillator have formed a small but significant convergence indicating a potential correction. We expect the price to reach the indicated level of 1.1085.

Analysis are provided by InstaForex.

Read more: https://ifxpr.com/3AIXhGa
IFX Bella
 
Posts: 219
Joined: Sat Dec 08, 2012 12:39 am

Re: Instaforex Analysis

Postby IFX Bella » Mon Sep 02, 2024 3:58 am

Forex Analysis & Reviews: Blackwell Delay, Stock Drop: What's Happening at Nvidia?


Nvidia: Investor Expectations Were Not Met Nvidia's (NVDA.O) quarterly guidance on Wednesday disappointed investors who had been counting on a continued run for the company, a symbol of success in generative AI. While Nvidia delivered impressive results, it was not enough to meet lofty market expectations. The company's shares fell 6% in after-hours trading, dragging down other chipmakers. The report was a moment of truth for the tech sector, where even Nvidia's strong results have drawn mixed reviews. Despite impressive financials, including strong growth and profits, investors were left scratching their heads. Strategy in Question Carson Group chief market strategist Ryan Detrick noted that the problem was the scale of expectations. "The bit size this time was much smaller than we've seen in the past," he explained. Even the company's updated guidance failed to excite investors in the same way it had in previous quarters, he said. "Nvidia remains a standout with 122% revenue growth, but it appears the bar was set too high this earnings season," he added. Guidance Underperforms While Nvidia's revenue and gross profit guidance for the current quarter were close to analyst expectations, they failed to continue the trend of recent quarters in which the company has consistently beaten Wall Street estimates. This eclipsed even the impressive figures for revenue and adjusted profit in the second quarter, as well as the announcement of a $50 billion share buyback. Nvidia has shown more than 200% revenue growth over the past three quarters, but each success puts more pressure on the company. As Wall Street continues to raise its targets, Nvidia now faces a challenge that is becoming increasingly difficult to overcome. Nvidia is betting on Blackwell Nvidia announced that it has begun shipping test samples of its new chips, codenamed Blackwell, to partners and customers. These chips have been finalized and are ready for market. The company expects their sales to bring in several billion dollars in the fourth quarter, which should support the current financial results. However, even such ambitious plans could not save the market from a wave of sell-offs. Shares of chipmakers such as Advanced Micro Devices (AMD.O) and Broadcom (AVGO.O) fell almost 4%. Asian giants SK Hynix and Samsung also felt the impact, falling 4.5% and 2.8%, respectively, in Thursday morning trading. Market on Edge: What Nvidia's Decline Means Nvidia's fate largely determines the dynamics of the entire tech sector. The company's shares have soared more than 150% since the start of the year, adding $1.82 trillion to its market value and pushing the S&P 500 to new all-time highs. However, if the stock continues to slide after the close of trading on Wednesday, the company could wipe out as much as $175 billion in market value. The outlook has raised concerns among investors about potential ROI issues in generative AI, with some beginning to question whether tech giants can continue to invest so heavily in the data centers needed to support AI without risking their bottom lines. These concerns have already begun to reverberate through the market, dampening the recent AI-related gains in stocks. AI Giants: What's Next for Them? Nvidia's biggest customers, such as Microsoft, Alphabet, Amazon, and Meta Platforms (a banned organization in Russia), are expected to spend more than $200 billion on capital expenditures in 2024. Much of that money is being spent on building AI infrastructure. But even those investment plans haven't kept the tech giants' stocks from falling. They were down less than 1% in over-the-counter trading on Wednesday, reflecting growing tensions in the market. Whether Nvidia and other tech leaders can live up to investors' lofty expectations remains an open question. Investors are starting to worry about the future of AI The once-unshakable generative AI market is starting to raise more and more questions among investors. "The entire market is now kind of tied to Nvidia's success, and that's becoming increasingly worrisome," eMarketer analyst Jacob Borne said. It seems like any swing in Nvidia's performance could have a significant impact on the overall perception of the AI sector. Regulators are ramping up the pressure Nvidia is also facing increasing pressure from regulators. In its latest quarterly report, the company reported requests for information from regulators in the US and South Korea. The requests cover various aspects of Nvidia's business, including GPU sales, supply chain allocation, base models, and partnerships and investments in AI companies. Previously, the company had only mentioned similar requests from regulators in the EU, UK, and China. In this context, it is particularly noteworthy that the French antitrust authority is preparing to charge Nvidia with alleged anti-competitive practices. US media have also reported that Nvidia is being investigated by US regulators for possible attempts by the company to tie its networking equipment to popular AI chips. Profit outlook: high, but under pressure Despite the challenges, Nvidia continues to deliver strong financial results. In the third quarter, the company expects adjusted gross margins of 75%, with possible deviations of 50 basis points. For comparison, analysts predict a slightly higher figure of 75.5%, which, however, is not much different from the second quarter, where Nvidia posted a profit of 75.7%. Even taking these figures into account, Nvidia's gross margins remain significantly higher than those of its competitors. In particular, AMD showed an adjusted profit of 53% in the second quarter. The gap is due to the high prices of Nvidia's chips, which continue to lead in speed and performance. However, the question remains whether the company's strong performance can be sustained amid mounting regulatory pressure and growing investor anxiety. Nvidia's Outlook: Falls short of lofty expectations Nvidia is forecasting revenue of $32.5 billion for the third quarter, with a 2% margin of error, slightly above the average analyst estimate of $31.77 billion, according to LSEG. The company posted revenue of $30.04 billion in the second quarter, significantly beating expectations of $28.70 billion. Adjusted earning

News are provided by InstaForex.

Read more: https://ifxpr.com/4cKEBTG
IFX Bella
 
Posts: 219
Joined: Sat Dec 08, 2012 12:39 am

Re: Instaforex Analysis

Postby IFX Bella » Tue Sep 03, 2024 4:39 am

Forex Analysis & Reviews: Hot forecast for EUR/USD on September 3, 2024

Image

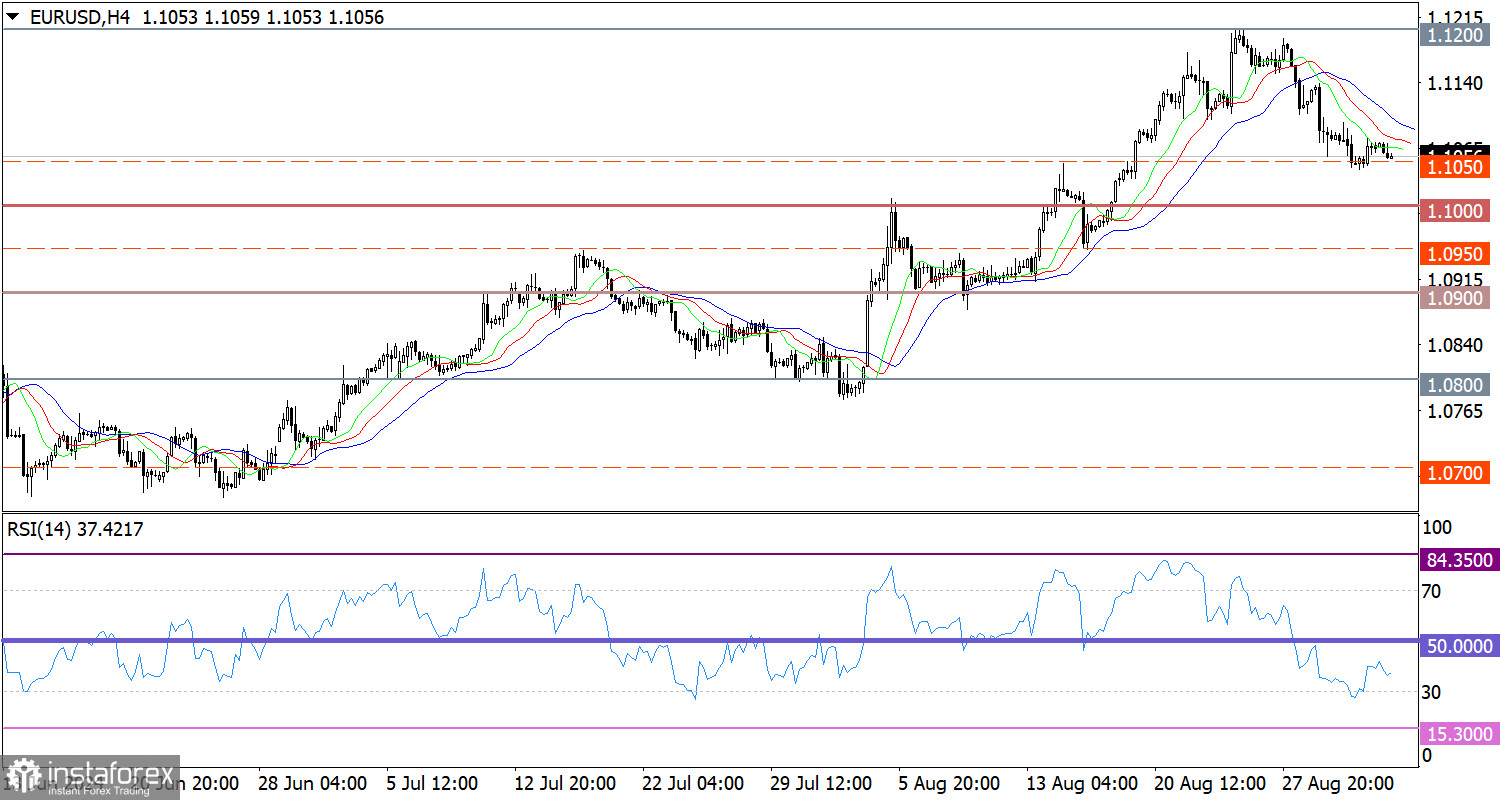
Due to the holiday in the United States, the market situation remained unchanged. Strangely enough, this stagnation might continue today; this time, it will be due to an empty economic calendar. The final data on the U.S. Manufacturing PMI is unlikely to have any significant impact. Even if it differs somewhat from the preliminary estimates, its influence will likely be more symbolic, as the market has already largely priced in this factor. The only thing that might affect the situation is possible statements from representatives of the European Central Bank. After all, inflation in the Eurozone is slowing down noticeably faster than in the United States. Therefore, the ECB might hint at a slightly more aggressive easing of monetary policy, which, in turn, could strengthen the U.S. dollar's position. However, such a development is unlikely since central banks do not make decisions based on data alone. They are more interested in the trend over time, and the recent decline in inflation in Europe may be temporary.

The EUR/USD pair is moving within the upper deviation of the psychological level of 1.1000/1.1050, indicating a sustained corrective cycle from the local high of the medium-term trend. In the 4-hour chart, the RSI technical indicator has left the oversold zone but remains in the sellers' area between 30 and 50. Regarding the Alligator indicator in the same time frame, the moving average lines (MA) point downward, which corresponds to the corrective phase. Expectations and Prospects Stabilizing the price below the 1.1050 mark is sufficient for the next stage of the decline. However, this will only result in a local shift of the support point toward the lower area of the psychological level. The complex indicator analysis points to a corrective price move in the short-term and intraday periods. Indicators point to an upward trend in the medium term.


Analysis are provided by InstaForex.

Read more: https://ifxpr.com/3MsT6RJ
IFX Bella
 
Posts: 219
Joined: Sat Dec 08, 2012 12:39 am

Re: Instaforex Analysis

Postby IFX Bella » Wed Sep 04, 2024 2:49 am

Forex Analysis & Reviews: Forecast for EUR/USD on September 4, 2024

Image

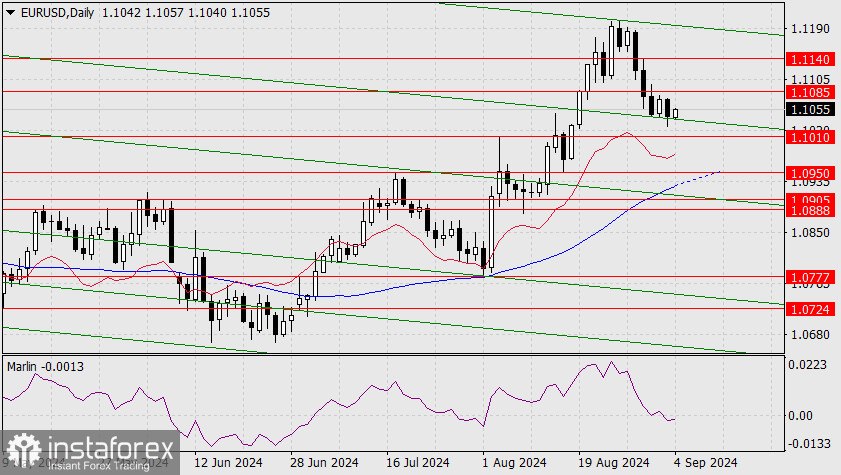
Yesterday, September 3rd, was quite eventful: The S&P 500 was down 2.12%, oil was down 4.78%, the dollar index was up 0.07%, and the yield on 5-year U.S. government bonds down 2.09% to 3.63%. Given this turn of events, the likelihood of the euro reversing from the support of the embedded green price channel line is very low. We expect the support at 1.1010 to be breached and the target level of 1.0950 to be reached. The Marlin oscillator on the daily time frame has entered the downtrend territory.

In the 4-hour chart, Marlin is rising against the trend of the daily oscillator and has even formed a slight convergence with the price. There are two possible scenarios here: a market reversal pattern or a standard limited rise—a brief release of oscillator tension before further decline. The reversal could occur either at the zero line or slightly above it, forming a false breakout into the positive territory.

However, what interests us most now is the market reversal pattern. According to the CFTC data, the largest euro position of the current year was accumulated last week. A fresh report will be released on Friday. If the big players plan to knock out the rest of the market participants, the timing is perfect. One of the key upcoming releases is the U.S. labor report for August, due the day after tomorrow. The forecast suggests an increase in new jobs by 160-164,000 compared to 114,000 in July and a decrease in the unemployment rate from 4.3% to 4.2%. Undoubtedly, such data will lower the still-aggressive market expectations regarding the pace of the Federal Reserve's rate cuts, and this could result in the closure of euro purchases.


Analysis are provided by InstaForex.

Read more: https://ifxpr.com/4ed34Cz
IFX Bella
 
Posts: 219
Joined: Sat Dec 08, 2012 12:39 am

PreviousNext

Return to Forex Brokers