RoboForex - company news and official support for customers

Forex broker related topics and discussions

Re: RoboForex - company news and official support for custom

Postby RBFX Support » Fri Dec 22, 2023 8:13 am

Join the grand promotion for Partners with a total prize pool of $1,000,000

Image

Dear Clients and Partners,

Let us remind you that all RoboForex partners can participate in our grand promotion and win cash prizes.

RoboForex Partner Promotion Overview:
  • RoboForex's most significant promotion of the year for partners.
  • Every month, 60 winners have the chance to earn up to $15,000 for their outstanding results.
RoboForex Partner Programme
  • Strong industry-leading partner program with high commissions to attract clients for your growth.
  • From June 2023 to March 2024, all RoboForex Partners are eligible to win cash prizes through automatic monthly coupon distribution during this promotion.
Winning Criteria
  • The market will determine the winners.
  • 60 winners determined by the closest mathematical match of coupon numbers to selected stock combinations' closing prices on the first Friday of each month.
Earn with RoboForex and receive prizes!

Image

Sincerely,
The RoboForex Team
RBFX Support
 
Posts: 738
Joined: Wed Feb 13, 2013 2:55 am

Re: RoboForex - company news and official support for custom

Postby RBFX Support » Tue Dec 26, 2023 6:45 am

EUR/GBP 2024 Forecast: Analysis and Expert Predictions

Image

Dear Clients and Partners,​

In-depth analysis of the EUR/GBP currency pair

The EUR/GBP pair is the cross rate of the two popular currency pairs, EUR/USD and GBP/USD. A cross rate is the price of one country’s currency expressed in another country’s currency and determined through their values against a third currency – the US dollar, traditionally considered the primary international reserve currency.

The EUR/GBP exchange rate reflects the dynamics of the value of the common European currency (EUR) against the British pound sterling (GBP). In this pair, the euro is the base currency, and the current price reflects how many pounds are needed to buy or sell one euro. When the pair’s quotes go up, it indicates a strengthening euro, and when they drop, it signifies a weakening euro against the UK currency.

Trading characteristics of the EUR/GBP pair

  • The pair is traded round the clock from Monday to Friday inclusive, with the highest activity observed during the European and American trading sessions
  • The EUR/GBP pair shows a low average daily volatility of approximately 500 pips
  • Thanks to its popularity, high liquidity, and moderate volatility, the spread for this pair is minimal, ranging from 3 to 5 pips in a quiet market
Critical factors influencing the EUR/GBP pair in 2024

The role of the Bank of England’s monetary policy

The primary tool the UK central bank uses to regulate inflation and influence the exchange rate of the national currency is the implementation of changes in the key interest rate. If the interest rate increases, the pound sterling exchange rate strengthens against other currencies, while a decrease in the interest rate leads to a decline in the exchange rate. Since December 2021, the Bank of England has executed a series of interest rate hikes to curb high inflation.

The rate increased from 0.1% to 5.25% during this period. The Bank of England’s Monetary Policy Committee aims to achieve a 2% inflation target. Thanks to interest rate increases, inflation rates are slowing down in the second half of 2023, with the regulator pausing its interest rate hikes since August. While consumer inflation fell from 10.5% in January to 4.6% in November, it is still above the central bank’s target.

Further actions on interest rate changes in 2024 will depend on economic data, primarily on inflation rates. If the UK’s GDP declines and recession signs emerge, this may negatively impact the pound exchange rate, with the EUR/GBP pair receiving support for growth. Conversely, strong GDP growth and high inflation might prompt the regulator to raise the interest rate again, bolstering the pound sterling against the euro.

EU monetary policy and its effects on EUR/GBP

The European Central Bank’s monetary policy strongly impacts the EUR/GBP pair. For example, interest rate hikes in the eurozone contribute to strengthening the euro exchange rate against the pound. The regulator has been implementing a series of tightening measures in its monetary policy since July 2022 to curb rapidly rising inflation. During this period, the interest rate increased from 0% to 4.5%, with the latest (at the time of writing) hike of 0.25% in September 2023.

Consumer inflation in the eurozone is exhibiting signs of a slowdown in 2023: while the rate reached 10.1% in January, growth in November was just 2.4%. The ECB focuses on attaining a 2% inflation target. The regulator is currently pausing its interest rate hike series in response to slowing European inflation rates.

Technical analysis and predictions for EUR/GBP in 2024

After rebounding from the annual low of 0.8500 in July-August 2023, the EUR/GBP currency pair is experiencing upward momentum within an ascending local price channel on the daily chart. At the time of writing, the pair underwent a downward correction towards the channel’s lower boundary, forming a local support level at 0.8550.

If this support level does not break, the pair will likely continue its upward movement to the upper boundary of the ascending channel at 0.8800. Should the quotes fall below 0.8550, the ascending scenario will probably be cancelled, with the price potentially declining to the annual low of 0.8500 and further to 0.8350. The SMA (200) and Alligator indicators suggest a local downward impulse of the price movement.

Read more at R Blog - RoboForex

Sincerely,
The RoboForex Team
RBFX Support
 
Posts: 738
Joined: Wed Feb 13, 2013 2:55 am

Re: RoboForex - company news and official support for custom

Postby RBFX Support » Thu Dec 28, 2023 7:11 am

Candlestick Analysis: 24 Main Candlestick Patterns

Image

Dear Clients and Partners,​

On all financial markets, the price of an asset is reflected as a price chart, constantly changing during the trading session in accordance with demand and supply.

What is a candle?

A candlestick is a way of displaying information about the price movement of an asset. The candlestick chart is one of the most popular components of technical analysis, allowing traders to quickly and easily interpret price information from multiple price bars.

A candle has three main parameters:

  • The body of the candle, representing the opening-closing range.
  • A wick or shadow indicating the daily high and low.
  • A color that shows the direction of the market - a green (or white) body indicates an increase in price, and a red (or black) body indicates a decrease in price.
Over time, individual candles form patterns that traders can use to recognize major support and resistance levels. There are so many candlestick patterns that indicate opportunities in the market - some give an idea of ​​the balance between buying and selling pressure, while others identify continuation patterns or market hesitation.

Before you start trading, it's important to familiarize yourself with the basics of candlestick patterns and how they can inform your decisions.

Types of Japanese candlesticks

Let us now look at the types of Japanese candlesticks: some may lack bodies or shadows, some may have just one shadow. By shape, candlesticks are divided into:

  • Normal (without anomalies).
  • Marubozu (long shadowless bodies).
  • Dojis (line-like bodies, where the opening price coincide with the closing price or is very near to it).
Image

Depending on the place of forming, candlesticks will have different names, though they will look roughly the same. At the same time, there are candlestick patterns which name do not depend on the place of formation. Based on these parameters, candlestick patterns may be divided into several groups:

  • Reversal candlesticks at the top of the trend
  • Reversal candlesticks at the bottom of the trend
  • Continuation candlestick patterns
  • Candlestick patterns that can form either at the top or at the bottom of the trend, its name remaining the same
Types of patterns in candlestick analysis

Candlestick patterns formed at the top of a trend

Now let us discuss the conditions for the formation of the aforementioned patterns and look at the pictures.

Candlestick patterns, formed at the top of the trend, are normally preceded by a long-time directed upward movement.

Shooting Star

A Shooting Star pattern has a small body and a long shadow along with the trend. The second shadow is either too small or lacking.

Read more at R Blog - RoboForex

Sincerely,
The RoboForex Team
RBFX Support
 
Posts: 738
Joined: Wed Feb 13, 2013 2:55 am

Re: RoboForex - company news and official support for custom

Postby RBFX Support » Tue Jan 09, 2024 7:20 am

Martingale on Forex. How Does It Work?

Image

Dear Clients and Partners,​

Most experienced traders pay a lot of attention to money management, sometimes considering it as efficient as a quality trading strategy. Generally, even beginners do realize that is you enter the market with your whole capital, you are likely to lose it all in quite a short time. However, if you divide the money on your account into 10-20 parts, you will be able to stay on the market much longer and are absolutely not likely to lose all your assets at one trade. There are plenty of money management options. Among the most popular, we can name the Martingale method, the Anti-martingale and the Fixed Fractional trading.

Trading Martingale

Most often, using Martingale on Forex is reduced to merely doubling the position after a loss.

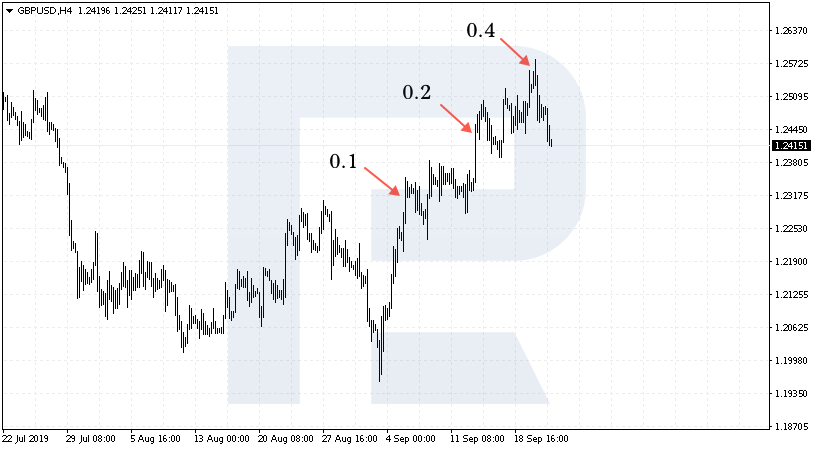
Of course, it is hard to imagine ten Head and Shoulders patterns in a row turn out to be false. As with a coin tossed, ten reverses one after another is not totally impossible, but very unlikely to happen. So, after a losing position, the possibility of another losing one seems lower. Some traders even use a demo account for trading until they receive two losing trades one after the other and only then start real trading, believing that the probability of a third losing trade is quite small. However, mathematicians evaluate the possibility of realization of each next signal as 50%. That is why, when using Martingale, after a loss of 0.1 lot, the next trade will be open for 0.2 lot; in case of another loss, it will open for 0.4 lot.

Image

Here, of course, the size of the capital matters; also, it is important to realize that risks are serious if the trader is simply averaging their position against the trade instead of locking in losses and waiting for a new signal to form.

Martingale Types

We can diversify this approach a little, like any other trading strategy. Conservatively, we may not just double the size of the lot but also move at a slower pace. For example, after a loss of 0.1 lot, we open the next position for 0.2 lot and the next one — for 0.3 lot.

Another option will be doubling the position after a profitable rather than a losing trade. Again, there is an opinion that a trader may lose a large part of their assets if they get into a series of losing trades: for example, when the market is growing but the system gives signals to sell. In such a situation, the trader can keep selling for several days in a row, constantly increasing the size of the lot; thus, they will lose their money quite quickly. However, if they leave the position size intact or start decreasing it, this will let the trader wait for the series of negative trades to end. Conversely, if the trade turned out profitable at 0.1 lot and the next one open for 0.2 lot also turned out positive, the trader may open the next one for 0.4 lot. If the position closed with a loss at 0.2 lot, the trader returns to the initial size of 0.1 lot. In a series of losing trades the trader suffers emotional pressure and is eager to return part of the losses quickly; this type of Martingale will help reduce the risks.

Safe Martingale

If we would like to make this approach safer, we will need a strategy with clear rules of entering and exiting the market either with a profit and a loss. It would be useful to study your trading history and find out how many losing positions in a row you have had. For example, if there has been a maximum of ten such positions and five averagely, you should start increasing the lot from the fourth losing trade or, alternatively, increase it not after each losing position but after two or three of them, when the possibility of a profitable trade is maximal.

Is Martingale worth using?

It is important to realize that, using such a strategy, the trader may overload their deposit, and high risks will yield serious losses in the end. However, if the trader has a clear strategy of entering and exiting the market, vast experience of trading and emotional stability, they can try to increase the size of the lot, controlling risks anyway. As in the example with the reversal pattern, where a new position is open near the main SL, a loss will have little influence upon the general sum on the account. Conservative traders might prefer the method of Fixed Fractional trading, where a percent of the trading account is put under the risk, say, as 2%; along with the deposit, the SL also grows, and if the trader loses, the SL also shrinks. Any trading option can be upgraded and customized in accordance with your preferences and trading methods. This refers to Martingale as well. Perhaps it is worth trying in order to gain experience and weight up all the advantages and drawback of this approach.

Read more at R Blog - RoboForex

Sincerely,
The RoboForex Team
RBFX Support
 
Posts: 738
Joined: Wed Feb 13, 2013 2:55 am

Re: RoboForex - company news and official support for custom

Postby RBFX Support » Thu Jan 11, 2024 10:29 am

RoboForex: upcoming changes to the trading schedule in view of Martin Luther King Jr. Day in the US

Image

Dear Clients and Partners,

We are informing you about the upcoming adjustments to the trading schedule due to Martin Luther King Jr. Day in the US.

This schedule is for informational purposes and may be subject to further amendments.

MetaTrader 4 / MetaTrader 5 platforms

Schedule for trading on CFDs on US futures
  • 15 January 2024 – no trading
  • 16 January 2024 – trading as usual
Schedule for trading on CFDs on Metals (XAUUSD, XAGUSD) and CFDs on oil (Brent, WTI)
  • 15 January 2024 – trading stops at 7:45 PM server time
  • 16 January 2024 – trading as usual
Schedule for trading on CFDs on US indices (US30Cash, US500Cash, and USTECHCash) and CFD on the Japanese index JP225Cash
  • 15 January 2024 – trading stops at 7:45 PM server time
  • 16 January 2024 – trading as usual
Schedule for trading on CFDs on US stocks
  • 15 January 2024 – no trading
  • 16 January 2024 – trading as usual

R StocksTrader platform

Schedule for trading on CFDs on US futures
  • 15 January 2024 – no trading
  • 16 January 2024 – trading as usual
Schedule for trading on US stocks and ETFs
  • 15 January 2024 – no trading
  • 16 January 2024 – trading as usual
Schedule for trading on CFDs on US stocks and ETFs
  • 15 January 2024 – no trading
  • 16 January 2024 – trading as usual
Schedule for trading on CFDs on US indices (US500, US30, NAS100), CFDs on Metals (XAUUSD, XAGUSD) and CFDs on oil (WTI.oil, BRENT.oil)
  • 15 January 2024 – trading stops at 7:45 PM server time
  • 16 January 2024 – trading as usual
Please take note of the above amendments to the trading schedule as you plan your trading activity.

Sincerely,
The RoboForex Team
RBFX Support
 
Posts: 738
Joined: Wed Feb 13, 2013 2:55 am

Re: RoboForex - company news and official support for custom

Postby RBFX Support » Tue Jan 16, 2024 10:00 am

How to Calculate a Trading Lot in Forex Market?

Image

Dear Clients and Partners,​

What is a trading lot?

Such thing as a “lot” plays important role in activity of any trader. In this article, we’ll discuss the term “trading lot” on Forex and describe the ways to calculate it.

A lot is a volume of an operation on the Fore market, which is defined by global standards. 1 lot always equals to 100,000 units of a base currency.

For example, in case of USD/CAD, 1 lot is 100,000 USD, because the base currency of this pair is the American Dollar. If one takes such instrument as EUR/USD, then one lot equals to 100,000 EUR or, translated at the current exchange rate, 137,000 USD (EUR/USD rate is 1.3700, hence 1 lot equals to 100 000 * 1.3700).

To open a position of 1 lot worth 100,000 USD, one requires quite a lot of money on their account or the leverage, that’s why financial operations with such amounts of money are mostly performed by large funds and different financial institutions. As for retail speculators with relatively small deposits, brokerage companies provides them with an opportunity to trade fractional lots.

How to calculate a lot on Forex?

When opening a position, a trader needs to calculate the optimal volume, i.e. the quantity in lots, which will allow the trader’s deposit to remain stable in case of any fluctuations against the open position. The order shouldn’t be closed by Stop Out even in case of the slightest price pullback.

First of all, to calculate the volume of a position to be opened, one must decide on two major components:

  • The amount of maximum permissible risk for one position to be opened.
  • Stop Loss level in pips from the entry point.
In addition to that, the following factors are used for calculations:

  • The deposit amount.
  • The cost of 1 pip of the price when using standard lots.
There are several methods of calculating the optimal lot size on the Forex market, and we’ll review three of them. In our examples, we’re going to use the following parameters:

  • Deposit is 2,000 USD.
  • Currency pair is GBP/USD (the cost of 1 pip in case of 1 lot order is 10 USD).
  • Maximum permissible risk for 1 transaction is 3%.
  • Stop Loss length is 100 pips (the distance between the entry point and Stop Loss level).
  • The leverage value is 1:100.
All calculations are made for a trading account with the USD as its base currency.

Recommendations for beginners

It is critical for beginners not to overstate the volume of transactions, even if you are 100% sure of the result.

Below we will offer some useful tips that will help reduce the level of possible losses:

  • During the calculation of the lot size, do not round the result up. Rounding should occur only to the smaller side. Example: when you got the value 0.728, with the correct rounding, your result will be 0.72.
  • Test the selected trading strategy on historical data, which helps to determine the optimal average Stop Loss order value. This simplifies the calculation, since you no longer have to substitute new values. Only the size of the deposit and the level of risk will change, the rest of the data is known.
  • When calculating Stop Loss levels, it is imperative to consider the size of the spread. If you place a stop order at 30, and the spread value is 2, then Stop Loss should be set at 32.
Read more at R Blog - RoboForex

Sincerely,
The RoboForex Team
RBFX Support
 
Posts: 738
Joined: Wed Feb 13, 2013 2:55 am

Re: RoboForex - company news and official support for custom

Postby RBFX Support » Thu Jan 18, 2024 9:36 am

What is Economic Calendar and What do We Need It For?

Image

Dear Clients and Partners,​

What is the economic calendar?

The economic calendar has long stopped being some sort of a secret; one does not have to be a “pro” economist or trader to use it. Presently, this calendar is yet another instrument for market analysis. Or let us put it different: it is not only an instrument but also a set of signals, indicators that can tell a lot about a certain branch of world economy as well as predict the market reaction to such publications. If you divide the publications in the calendar into different categories (described below), the market reactions and fluctuations will become even more obvious.

The importance of events in the economic calendar

The economic calendar is considered to reflect various news, statistics data and all important events in the economies of the world leading countries. Obviously, the most important statistics would be that of the world biggest economies as they are the real news-makers. Among such economies there are the US, the euro area, Japan, Australia, Canada etc. All data on the economic calendar have different importance and influence on the market. The following levels of importance can be singled out:

  • Weak influence.
    News or statistics from this category has almost no influence on the market after the publication. However, if the market is not expecting any major news, minor fluctuations might be seen.
  • Moderate influence.
    In certain circumstances such news may affect the currency dynamics. However, there might be no reaction if there are some major events on the horizon. Nonetheless, several moderate influences, released at the same time, are considered to give some dynamics to currency pairs.
  • Strong influence.
    This news, even released one by one, seriously affects currency dynamics. All together it sometimes changes the trend of certain instruments. This category is comprised of such major economic event as meetings of Central banks and their decisions upon interest rates, speeches of heads of Central banks, statistics of key world GDPs, Nonfarm Payrolls (the number of new workplaces in the non-agricultural branches of the US economy) and some other.
As a rule, traders pay most attention to strong influences. They hope that after the publication of such news there will be a significant market fluctuation and they will “sweep the deck”. For example, such is the case with the NonFarm Payrolls (NFP) data published on the first Friday of each month. This day used to be called “trader pay day” because if the numbers published differed a lot from the prognoses or from the previous data, rather strong and steep movements occur, which market players try to forecast and “catch”.

Ways of using economic calendar in trading

There are several ways of using the calendar in trading. For example, a trader studies the calendar before starting the day and closes his positions before the publication of moderate and strong influences. Normally, new positions do not open until the market reacts on the news. The reason is clear: high volatility of the market causes unpredictable movements, both downwards and upwards, even with price gaps. The reaction of the market usually lasts for 2 to 3 hours. Keeping this in mind proves good for a trader’s nerves and finance, especially for newcomers on the market.

Another way of using the calendar is trading in accordance with the news. It requires a historical analysis of market reactions to certain news. It might seem boring, time-consuming and difficult at the beginning but it is not. What is to be noticed is the statistics prior to the news and how the market or the price reacted to the publications. Also, the statistics of prior expectations is to be studied and taken into consideration (this data is almost always on the calendar). Sometimes observers make mistakes, and the numbers published are significantly different from those forecast. In such case the reaction of the market will be acute and strong. One may cast an even wider look upon the calendar: factual data of an important piece of news may hide in some indirect statistics published before and by itself having almost no influence upon the market.

Read more at R Blog - RoboForex

Sincerely,
The RoboForex Team
RBFX Support
 
Posts: 738
Joined: Wed Feb 13, 2013 2:55 am

Re: RoboForex - company news and official support for custom

Postby RBFX Support » Tue Jan 23, 2024 9:34 am

11 Rules of Risk Management. Ultimate Guide

Image

Dear Clients and Partners,​

As it has been mentioned lots of times, working on financial markets implies high risk; in order to become a successful trader, one should minimize potential risks. This article is devoted exactly to reducing them. I would like to mention that this list of actions was suggested by one of the Stocks&Commodities authors George R. Arrington.

Let us have a look at the list of rules necessary for minimizing possible losses. I think that if you trade or have ever traded before, you have used at least some of them, perhaps unconsciously.

1. Before opening a trade make a thorough analysis

Before putting your capital in danger, you should make sure that you have full information and realize well why you want to open the trade. Aside from a detailed analysis of charts, you should form a clear idea of the amount of capital you are ready to risk in this particular trade and of the point, where you are planning to enter the position, for the trade not to become losing even if the market turns against you.

Carrying out the analysis, prepare a list of instruments with a description of reasons for opening the trades and the levels of entrance and exit (if the number of your open positions is scarce, you can keep this list in mind). Upon calculating the risks, cross out too risky ones and those with ambiguous signals. This is the way to make a preliminary selection of trades and eliminate the least efficient of them.

2. Make a trading plan

What is more: if you put effort into creating the plan, stick to it. Each and every one speaks a lot about trading plans, though the views on their efficiency differ radically. Anyway, a plan is necessary as it helps avoid spontaneous actions, performed emotionally and leading to unreasonable losses. Having a well-drafted plan and following it, you will be insured from impulsive actions and will gain confidence.

What is the plan comprised of? It is basically a list of your everyday operations in accordance with your trading style. You have to make an investigation and create a method fitting you in all details, then write it down.

What is more, you should describe acceptable risk for every position and for all trades together, as well as your approximate goals, justifying the losses. If you embed a 2% risk into a trade and receive 1% on exit, you compromise your position at once, because sooner or later your losses will eat up your profit, and the trade will become losing. If during trading you deplete your loss limits, it would be wise to make a pause, exit the market and think about what has happened.

One more important hing: if at a certain moment you realize that the meaning of market events escapes you, do not follow the plan blindly, close all positions and wait for the situation to stabilize and become clearer. Also, do not open trades on the basis of someone’s view or advice, act independently after a thorough analysis of the situation.

3. Diversify your assets

Let us recall one more method, well-known bur not always used – diversification. It allows to decrease risks significantly, acting in two directions:

  • regulating risks by the volume of opening trades;
  • spreading risks between various instruments.
As for the volume of positions, one thing that you definitely should not do is placing all funds in one trade. Define the risk level for each position and limit it by a Stop Loss. Speaking about instruments, try to create a range of assets with the least correlation between each other, so that their price fluctuations and trend directions seldom matched. This way you will diversify risks and avoid dependence on parallel impulses in correlating groups, which bring losses in all trades if the market goes negative.

4. Do not put all your savings on your trading account

It is recommended to use only part of your capital for trading. As the saying goes, do not put all your eggs in one basket. What is more, if a trade looks especially appealing, still do not be tempted to open it for the whole deposit, as the market may turn against you any moment. Make sure you have enough money on your account to keep the trades open easily. It is best to have some reserve on a separate account in order to restore the margin quickly in case of an undesirable price movement. Some traders purposefully open several accounts for trading or deposit the main account for such a sum that will let them open just one or two trades to avoid the temptation of putting all money in trading.

Read more at R Blog - RoboForex

Sincerely,
The RoboForex Team
RBFX Support
 
Posts: 738
Joined: Wed Feb 13, 2013 2:55 am

Re: RoboForex - company news and official support for custom

Postby RBFX Support » Fri Jan 26, 2024 9:26 am

Join the “$1,000,000 to RoboForex partners” 2024 promotion

Image

Dear Clients and Partners,

We remind you that all RoboForex partners can take part in our grand promotion and win cash prizes.

60 winners each month stand a chance to win up to $15,000 for their exceptional performance!

RoboForex Partner Program:

Unmatched industry-leading partner program.
High commissions for attracting clients and fostering your growth.

Dates:

From June 2023 to March 2024, all RoboForex Partners will have a chance to win cash prizes.
Each month, you'll automatically receive coupons to participate in the promotion.

How Winners Are Chosen:

Let the market decide! The 60 winners will be determined by the closest mathematical match of coupon numbers to the closing prices of selected stock combinations on the first Friday of each month.

Earn with RoboForex and receive prizes!

Image

Sincerely,
The RoboForex Team
RBFX Support
 
Posts: 738
Joined: Wed Feb 13, 2013 2:55 am

Re: RoboForex - company news and official support for custom

Postby RBFX Support » Tue Jan 30, 2024 7:15 am

2024 Crude Oil Forecast: Analysing Market Trends and Price Predictions

Image

Dear Clients and Partners,​

On 11 January 2024, we looked at the current trends in the oil market and examined the key factors that influenced the oil price performance in 2023 and are likely to impact it in 2024. We conducted a technical analysis of Brent and WTI charts and shared experts’ long-term forecasts on oil prices.

Influential factors on crude oil prices in 2023-2024

OPEC+ policy

The Organisation of the Petroleum Exporting Countries (OPEC+) made active efforts throughout 2023 to support global oil prices, with its share in global oil supplies exceeding 40%. Saudi Arabia’s voluntary output cuts of 1 million barrels per day (b/d) in 2023 demonstrate the country’s leading role in promoting a policy of output cuts to support oil prices.

The latest online meeting of OPEC+ members was held on 30 November 2023, where agreements on output cut commitments were reached. OPEC+ announced following the meeting that total restrictions would amount to 2.2 million b/d for eight oil-producing countries.

However, it is worth noting that discussions were challenging. Several OPEC+ members announced they were not ready to reduce commodity output in 2024. Angola’s government decided to exit the organisation at the beginning of the year, while Brazil is expected to join OPEC+ in 2024.

The failure of OPEC+ members to reach a consensus on overall output cuts for all member countries may pose a risk to oil quotes. It has become apparent that some members find it increasingly challenging to commit to further cuts. Whether the organisation can overcome the existing disagreements and pursue a coordinated policy to support commodity prices remains to be seen in 2024.

Global oil demand and supply

The Energy Information Administration (EIA) expects global oil demand to increase by 1.39 million b/d to 102.46 million b/d in 2024. The expected demand increase will primarily be attributed to Asian countries, with China and India being the largest consumers.

The EIA also forecasts that the global oil output will increase by 0.61 million b/d in 2024, reaching 102.34 million b/d. The Energy Information Administration estimates the market will experience a small deficit at the beginning of 2024 due to the OPEC+ restrictive policy, averaging 210 thousand b/d. However, the market is expected to find a balance by the end of the year.

Sanctions policy

The EU ban on maritime imports of Russian crude oil due to Russia’s full-scale military incursion into Ukraine came into effect in December 2022 with a price cap of 60 USD per barrel. An embargo on Russian petroleum products was introduced in February 2023. These sanctions, aimed to weaken the aggressor country, contribute to oil price growth in the long run.

In November, the US Department of State announced new sanctions against the Iranian oil and gas sector amid the Israel-Hamas war. It is worth noting that Iran supports the Palestinian group Hamas and Lebanese Hezbollah. The sanctions are expected to reduce oil exports from Iran, currently amounting to about 1 million barrels daily.

Geopolitical risks

When referring to the geopolitical environment in recent years, it is essential to point out events such as Russia’s full-scale incursion into Ukraine in 2022 and the Hamas attack on Israel in 2023. There are no indications that the Russia-Ukraine war and the Israel-Hamas conflict are about to end. Furthermore, tensions between China and Taiwan and North Korea and South Korea might escalate.

The existing or imminent conflicts mentioned above involve the US, China, and Russia to some extent, indicating a potential threat of a significant oil price leap. It is worth considering scenarios that might lead to other less predictable geopolitical events that can strongly impact the oil market.

Read more at R Blog - RoboForex

Sincerely,
The RoboForex Team
RBFX Support
 
Posts: 738
Joined: Wed Feb 13, 2013 2:55 am

PreviousNext

Return to Forex Brokers


cron