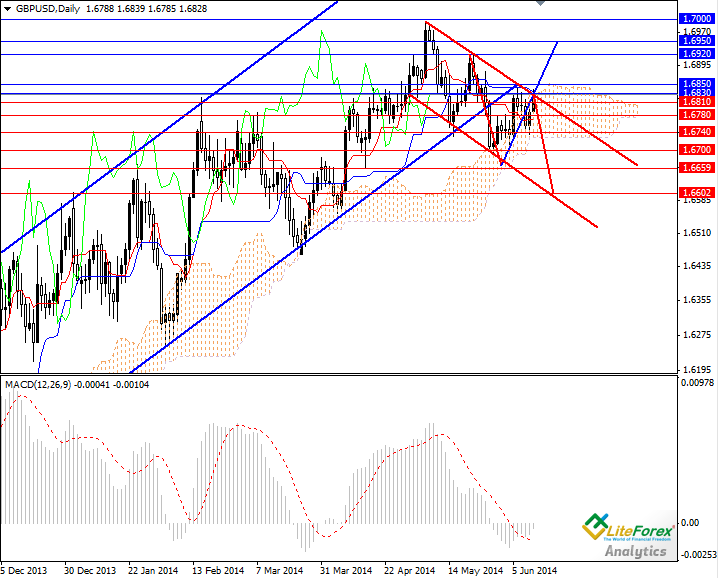
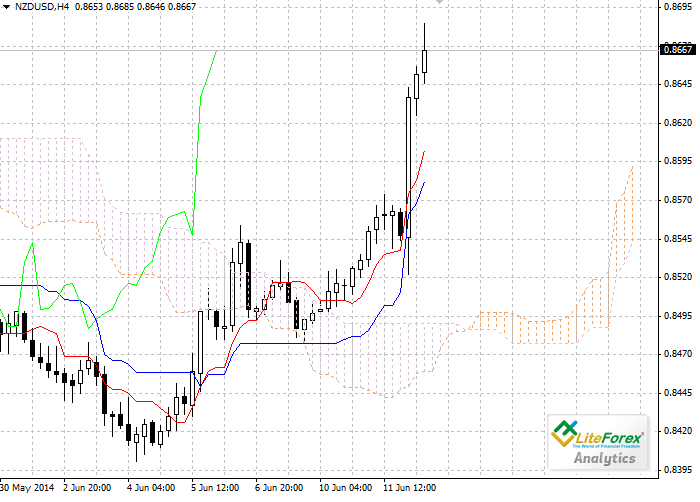
LiteForex Market Analytics

Forex broker related topics and discussions

Re: LiteForex Market Analytics

Postby LiteForexTeam » Thu Jun 12, 2014 5:55 am

Forex: Ichimoku Clouds. Review of NZD/USD

NZD/USD, H4

On the four-hour chart Tenkan-sen line is above Kijun-sen, they are both directed upwards. Chinkou Span line is above the price chart, current cloud is ascending. After small correction the pair jumped up and still growing. Tenkan-sen line is the closest support level (0.8602). One of the previous maximums of Chinkou Span line is expected to be a resistance level at 0.8685.
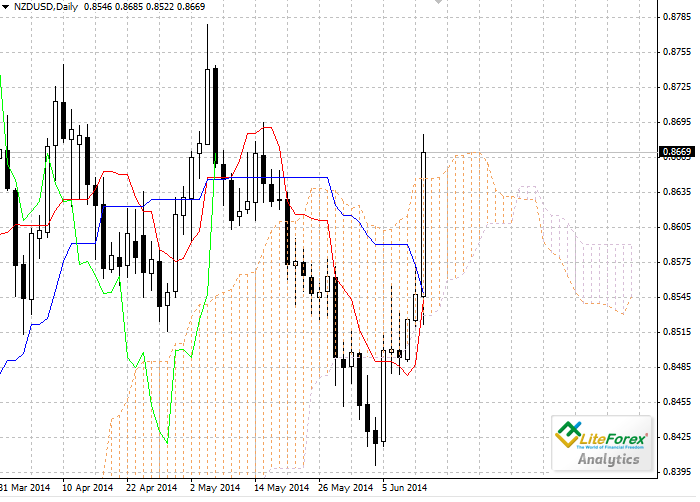
Image

NZD/USD, D1

Let’s look at the daily chart. Tenkan-sen and Kijun-sen lines are getting closer prior to the trend reversal pattern formation. Chinkou Span line is crossing the price chart from below; current cloud is descending. The pair has broken through the cloud, giving a strong signal to buy. Upper border of the cloud becomes a support level at 0.8647.One of the previous maximums of Chinkou Span line is expected to be a resistance level at 0.8740.

Image

Key levels

Support levels: 0.8647, 0.8602.
Resistance levels: 0.8685, 0.8740.

Trading tips

On the four-hour chart the pair continues to grow, on the daily chart we’ve got a strong signal to buy. Targets for the long positions are 0.8685 and 0.8740.

Anastasiya Glushkova
Analyst of LiteForex Investments Limited
LiteForex Representative
LiteForexTeam
 
Posts: 1249
Joined: Thu May 23, 2013 12:53 pm

Re: LiteForex Market Analytics

Postby LiteForexTeam » Thu Jun 12, 2014 7:43 am

GBP/USD: investors expect decisive actions from the Bank of England

Current trend

As expected, the pair continues to strengthen amid favourable data on the British labour market. The reduction in unemployment rate had exceeded expectations and the pair went up to the level of 1.6810. Today, investor interest in the British currency continues to increase, the pair broke down the key resistance level of 1.6810 and reached the level of 1.6830. However, the Bank of England is not ready to tighten monetary policy and raise interest rate, which may lead to the downward correction.
Today, the data on the US retail sales will become known. It is expected that this index will go up, which will support the American currency, and cause the decline in the pair GBP/USD to the level of 1.6740.

Support and resistance

The pair has reached the upper limit of the descending channel; therefore, the downward wave can follow. The fact that the Pound is overbought gives ground for the buying American currency. In the medium-term the pair will fall to the lower limit of the range at 1.6600. However do not disregard the alternative scenario. If the Bank of England drops a hint on the possible raise in interest rate, the demand for the Pound will significantly increase and the pair will soar up to the local highs of 1.6950 and 1.7000.

Support levels: 1.6810, 1.6780, 1.6740, 1.6700, 1.6660 and 1.6600.
Resistance levels: 1.6830, 1.6850, 1.6920, 1.6950, 1.7000, 1.7050 and 1.7100.

Trading tips

It is recommended to open short positions and pending short positions from the level of 1.6850 (1.6920) with taking profit at the level of 1.6660 (1.6600) and stop-loss at 1.7020.

Image

Dmitry Likhachev
Analyst of LiteForex Investments Limited
LiteForex Representative
LiteForexTeam
 
Posts: 1249
Joined: Thu May 23, 2013 12:53 pm

Re: LiteForex Market Analytics

Postby LiteForexTeam » Fri Jun 13, 2014 8:08 am

Forex: Ichimoku Clouds. Review of EUR/USD

EUR/USD, H4

On the four-hour chart Tenkan-sen line is below Kijun-sen, red line is directed upwards, while the blue one remains horizontal. Chinkou Span line is approaching the price chart from below; current Kumo-cloud is descending. After small fall the pair has been corrected above Tenkan-sen line, which is a support level now (1.3545). The next obstacle for the price on its way up will be the lower border of the cloud at 1.3590.

Image

EUR/USD, D1

On the daily chart Tenkan-sen line is also below Kijun-sen, however, the correction has never reached the red line, which is still a resistance level (1.3590). Chinkou Span line is below the price chart, current cloud is descending. One of the previous minimums of Chinkou Span line is expected to be a support level at 1.3485.

Image

Key levels

Support levels: 1.35445, 1.3485.
Resistance levels: 1.3590.

Trading tips

Both charts confirm strong resistance level of 1.3590. Probably the price won’t be able to overcome it and the pair will return to the fall. Target for the short positions is 1.3485.

Anastasiya Glushkova
Analyst of LiteForex Investments Limited
LiteForex Representative
LiteForexTeam
 
Posts: 1249
Joined: Thu May 23, 2013 12:53 pm

Re: LiteForex Market Analytics

Postby LiteForexTeam » Fri Jun 13, 2014 8:12 am

AUD/USD: the pair is soaring up again

Current trend

Last morning Australian economic data was released. It became known that employment rate for May was at the level of 4800, which was below expectations, while unemployment rate fell by 0.1% against the previous value, as expected. In addition, the Australian currency was supported by the fact that ARB did not change the interest rate, which was expected by the investors. The pair AUD/USD came close to the level of 0.9400, but failed to break it down. In the afternoon weak US statistics pushed the pair up to the resistance level of 0.9435.
Today the pair is undergoing an inevitable correction, testing support level of 0.9400. ЕIf the “bears” manage to break down this level, the pair will fall to the level of 0.9360. In case of the opposite situation, the “bulls” will again try to overcome the level of 0.9435.

Support and resistance

Support levels: 0.9410, 09390, 09380 and 0.9360.
Resistance levels: 0.9420, 0.9435 and 0.9460.

Trading tips

It is recommended to open short positions with taking profit at the level of 0.9360. Limited buy orders can be placed at the same level with the target of 0.9460.

Image

Ilya Lashenko
Analyst of LiteForex Investments Limited
LiteForex Representative
LiteForexTeam
 
Posts: 1249
Joined: Thu May 23, 2013 12:53 pm

Re: LiteForex Market Analytics

Postby LiteForexTeam » Mon Jun 16, 2014 9:01 am

GBP/USD: the attempt to break down the level of 1.7000 can become successful

Current trend

At the end of last week the price of the pair GBP/USD sharply went up. It happened after the speech of the head of the Bank of England Mark Carney, who said that interest rates could be increased in the near future. This announcement caused the increase in the demand for the Pound; in one hour the Pound has gained about 100 points against the USD and practically has reached the local highs and the key resistance level of 1.7000. Additional support to the pair was provided by the weak American statistics. Following the significant rise, the price has corrected and today it went up.
At the moment the pair is trading at the level of 1.6960. Demand for the pair continues to grow; however in order to break down the key resistance level of 1.7000, an additional fundamental catalyst will be required. Today economic calendar does not contain any UK news. Attention shall be paid to the US statistics, including the data on the volume of industrial output for May.

Support and resistance

Positive statistics on the volume of industrial output of the USA and lock in of the long positions may trigger the decline in the pair to the level of 1.6920. However, tomorrow key UK indices will become known. This data may force the pair to return to the key resistance level and break it down with the target of 1.7050 (1.7100). The pair GBP/USD has returned to the upward channel and in the near future it pair may go up to the level of 1.7170 (1.7360).

Support levels: 1.6920, 1.6850, 1.6810, 1.6780, 1.6740, 1.6700, 1.6660 and 1.6600.
Resistance levels: 1.7000, 1.7050 and 1.7100.

Trading tips

In the current situation it makes sense to place long positions and pending long positions above the level of 1.7020 with taking profit at the level of 1.7170 (1.7360).

Image

Dmitry Likhachev
Analyst of LiteForex Investments Limited
LiteForex Representative
LiteForexTeam
 
Posts: 1249
Joined: Thu May 23, 2013 12:53 pm

Re: LiteForex Market Analytics

Postby LiteForexTeam » Mon Jun 16, 2014 9:16 am

Brent: review and forecast

Current trend

During last trading week the price of crude oil Brent significantly increased. Today, the quotes are maintaieds above the level of 112 USD per barrel. Disturbances in Iraq, one of the leading centers of oil production, are the main reasons for continuously high prices of oil. The attacks of the armed insurgents are still ongoing and government troops seem not to be able to take control over the situation. Continuous military actions bear significant threat to exports of the Iraqi oil.

Support and resistance

Resistance levels: 113.20, 114.00 and 115.00
Support levels: 112.00, 111.00 and 110.50.
On the four-hour chart Bollinger bands demonstrate minor divergence, confirming sideways movement in the market. MACD histogram is in the positive zone and its volumes are gradually decreasing.

Trading tips

Although the price of Brent is still quite high, it is early to expect correction or downward movement. It is likely that in the near future the price will move in the sideways channel of 113.20-112.00.

Image

Andrey Cherkas
Analyst of LiteForex Investments Limited
LiteForex Representative
LiteForexTeam
 
Posts: 1249
Joined: Thu May 23, 2013 12:53 pm

Re: LiteForex Market Analytics

Postby LiteForexTeam » Thu Jun 19, 2014 9:33 am

USD/CAD: The pair is expected to undergo upward correction

Current trend

On Wednesday the currency pair USD/CAD went up, reaching the lows since January this year at the level of 1.0809. The sharp decline was triggered by the decision of the US Fed to reduce the volume of asset purchase from $45 billion to $35 billion. At the meeting the US Fed experts have also lowered the forecast of GDP growth in the USA. It was expected earlier that the US GDP will amount to 2.8-3.0% this year; while according to the new prediction the growth of the American economy will not exceed 2.1-2.3%. These data have put significant pressure on the American currency. On the other hand, the Canadian dollar was supported by continuously high price of oil.

Key statistics, which may affect movement in the pair, will be released on Friday; it will be Canadian consumer price index for May and volume of retail sales for April.

Support and resistance

In the near future the market can experience the correction to the levels of 1.0828 и 1.0809. The price is unlikely to go further up as investors will wait for the release of the fundamental data.

Technical indicators demonstrate mixed signals. Bollinger bands demonstrate divergence, confirming downtrend. The price chart has repeatedly broken down the bottom moving average line, indicating a chance of correction. MACD histogram is in the negative zone, its volumes are increasing. Stochastic lines are in the oversold zone, they are intersecting and turning down.

Trading tips

In the current situation it makes sense to open long positions from the current price level with taking profit at the level of 1.0844. Pending sell orders can be placed at the same level.

Image

Dmitriy Zolotov
Analyst of LiteForex Investments Limited
LiteForex Representative
LiteForexTeam
 
Posts: 1249
Joined: Thu May 23, 2013 12:53 pm

Re: LiteForex Market Analytics

Postby LiteForexTeam » Fri Jun 20, 2014 9:48 am

EUR/USD: The pair is expected to weaken in the downward channel

Current trend

The European currency has been under strong pressure for a few months. Demand of the Euro continues to decrease and the pair goes down even despite the fact that the American currency is very weak. On Wednesday the US Fed adopted decision to reduce QE3 program by 10 billion USD. At the same time at the press-conference, which followed after the meeting it was stressed that the rates would be kept at the low levels for a long time. This announcement has weakened the American currency; however strengthening in the Euro is not expected to last long, as there are no positive drivers that can significantly support European currency.
Note that the quotes of the pair EUR/GBP are declining amid expectations that the Bank of England will raise the key interest rate at the next meeting. Now the pair EURUSD is traded at the level of 1.3600, however many investors expect the decline in the pair after the ascending correction.

Support and resistance

Volatility is not expected to be high today because of the lack of important economic news. It is likely that in the near future demand for European currency will fall and the pair will move in the downward channel with the target level of 1.3300.

Support levels: 1.3600, 1.3520, 1.3470, 1.3300, 1.3250 and 1.3170.
Resistance levels: 1.3660, 1.3720, 1.3770, 1.3810, 1.3900, 1.3960 and 1.4000.

Trading tips

In the current situation it makes sense to open short positions and pending short positions from the level of 1.3660 with taking profit at the level of 1.3300.

Image

Dmitry Likhachev
Analyst of LiteForex Investments Limited
LiteForex Representative
LiteForexTeam
 
Posts: 1249
Joined: Thu May 23, 2013 12:53 pm

Re: LiteForex Market Analytics

Postby LiteForexTeam » Fri Jun 20, 2014 9:53 am

NZD/USD: Review and forecast

Current trend

This week the pair NZD/USD has reached seven-week highs at the level of 0.8736. The rise in price was caused by the reaction of the market participants to the outcome of the US Fed meeting. The American regulator has again reduced the volume of economic stimulation; however, the time period when the interest rates will be raised has not been outlined.

Currently the pair is undergoing correction, as the NZD is under pressure from the weak data on the country’s GDP that amounted to 1.0% in Q1, which was below the forecast.

Support and resistance

Currently the pair is traded near the level of 0.8691. This level coincides with the middle line of the Bollinger bands indicator and seems to be the key one. If this level is broken down, the price will drop to the levels of 0.8670 and 0.8645.

Technical indicators confirm probability of the decline. MAC D histogram is in the positive zone; it has crossed the signal line from top to bottom. Stochastic lines are directed downwards.
Технические индикаторы подтверждают вероятность снижения. Гистограмма MACD.

Trading tips

In the current situation it makes sense to open short positions with the target of 0.8645 after breakdown of the level of 0.8691.

Image

Dmitriy Zolotov
Analyst of LiteForex Investments Limited
LiteForex Representative
LiteForexTeam
 
Posts: 1249
Joined: Thu May 23, 2013 12:53 pm

Re: LiteForex Market Analytics

Postby LiteForexTeam » Mon Jun 23, 2014 7:42 am

Forex: Ichimoku Clouds. Review of AUD/USD

AUD/USD, H4
Let’s look at the four-hour chart. Tenkan-sen line is above Kijun-sen, they are both horizontal. Chinkou Span line is above the price chart; current cloud is ascending. The pair has broken through the cloud and is still growing. Tenkan-sen line is the closest support level at 0.9408. One of the previous maximums of Chinkou Span line is expected to be a resistance level at 0.9447.

Image

XAG/USD, D1
On the daily chart Tenkan-sen line is also above Kijun-sen, however, both lines are directed upwards. Chinkou Span line is above the price chart; current cloud is ascending. After small correction the pair continues to grow. Tenkan-sen line is the closest support level at 0.9379. One of the previous maximums of Chinkou Span line is expected to be a resistance level at 0.9525.

Image

Ключевые уровни
Support levels: 0.9408, 0.9379.
Resistance levels: 0.9447, 0.9525.

Торговые рекомендации
On the both charts Bullish trend is still strong. Targets for the long positions are 0.9447, 0.9525.

Anastasiys Glushkova
Analyst of LiteForex Investments Limited
LiteForex Representative
LiteForexTeam
 
Posts: 1249
Joined: Thu May 23, 2013 12:53 pm

PreviousNext

Return to Forex Brokers