LiteForex Market Analytics

Forex broker related topics and discussions

Re: LiteForex Market Analytics

Postby LiteForexTeam » Thu Jun 05, 2014 10:43 am

AUD/USD: analysis and forecast

Current trend

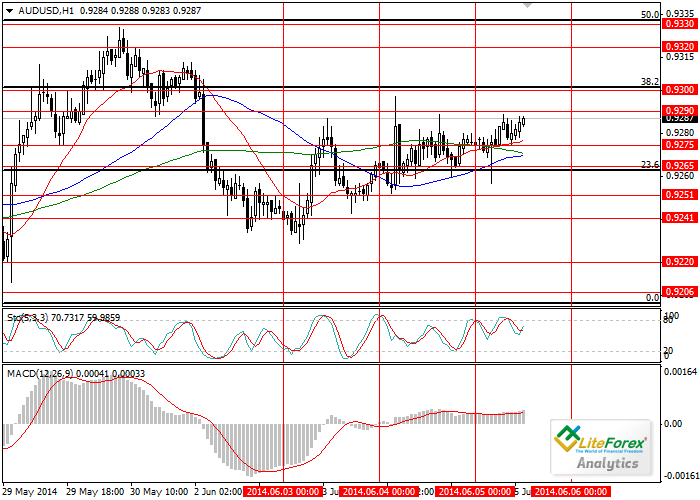
Yesterday, Australian GDP for Q1 was released, which was above the forecast. GDP rose due to the increase in exports of iron ore and minerals. However, despite positive indices it is unlikely that RBA will change monetary policy, as the bank has confirmed this week that interest rates will remain unchanged. Due to positive fundamental news the pair managed to reach the level of 0.9300, but failed to maintain at this level, dropping back to the level of 0.9250 in the afternoon.
Tomorrow, US data on the number of jobs outside agricultural sector will become known. This indicator will obviously have impact on the currency pair AUD/USD. In case of poor data the pair may go above the level of 0.9300, which coincides with Fibonacci level of 38.2%. Today, outcome of the ECB meeting will become known and the decisions made on interest rate and monetary policy, which will affect movement in the most currency pairs.

Support and resistance

The nearest support levels: 0.9275, 0.9265, 0.9250 and 0.9240. The main target of the “bears” is the level of 0.9200. Resistance levels: 0.9290, 0.9300 and 0.9330. Key level of the “bulls” is 0.9360.

Trading tips

It is likely that volatility will be high in the next two days. Long positions are advisable above the level of 0.9300; short positions can be opened below the level of 0.9265 with the target of 0.9200. Limited sell positions can be placed at the level of 0.9200.

Image

Ilya Lashenko
Analyst of LiteForex Investments Limited
LiteForex Representative
LiteForexTeam
 
Posts: 1249
Joined: Thu May 23, 2013 12:53 pm

Re: LiteForex Market Analytics

Postby LiteForexTeam » Fri Jun 06, 2014 8:11 am

GBP/USD: will the pair return to the upward channel?

Current trend

Thursday was eventful in terms of news releases; however the pair GBP/USD was traded quietly. The decisions of the Bank of England on the interest rate and the volume of the asset purchase program had confirmed investors’ expectations and the Pound started to go up slowly. Additional support to the British currency was provided by Mario Draghi’s speech, which assured investors that the regulator is ready to take new steps to support national economy.
Volatility in the pair is expected to be low today in advance of the US labour market statistics. It is expected that unemployment rate in the USA will increase, while the number of jobs outside agricultural sector will decline.

Support and resistance

If the data on the American labour market prove the correctness of the negative forecast, ascending movement may continue up to the target level of 1.6850. The decline of the weak USD will allow the pair to go back to the upward channel and test the local highs of 1.7000. However, if the US labour market statistics is above the forecast, the USD can strengthen and the pair GBP/USD may go up to the level of
1.6660.

Support levels: 1.6780, 1.6760, 1.6660, 1.6600 and 1.6550.
Resistance levels: 1.6850, 1.6920, 1.6950 and 1.7000.

Trading tips

It is recommended to open pending long positions above the level of 1.6850 with taking profit at the level of 1.7000 and stop-loss at 1.6800.

Image

Dmitry Likhachev
Analyst of LiteForex Investments Limited
LiteForex Representative
LiteForexTeam
 
Posts: 1249
Joined: Thu May 23, 2013 12:53 pm

Re: LiteForex Market Analytics

Postby LiteForexTeam » Fri Jun 06, 2014 8:15 am

Brent: general review

Current trend

Yesterday the price of crude oil Brent was able to reach 108.85 despite the correction to the level of 107.75. Brent is supported by the threat of new sanctions towards Russia, promised by American president. German chancellor Angela Merkel associate herself with Barak Obama.
Today investors are waiting for the major stats release from US labour market. According to the forecasts NFPR is going to grow to the level of 219 000, and unemployment rate will probably hit 6.4%. If the negative forecast proves itself right, Brent will go down to the level of 107.80.

Support and resistance

Resistance levels are local maximums 109.44, 110.00 and 110.97. Support levels will b e at the following lines: 108.90 (yesterday maximum), 108.55 (MA 50), 108.22 (MA 100), 107.75 (yesterday minimum).

Trading tips

Short trades can be opened below 108.55. First target is 108.22, the main one is 107.80, Stop Loss should be placed at 108.70.

Image

Andrey Cherkas
Analyst of LiteForex Investments Limited
LiteForex Representative
LiteForexTeam
 
Posts: 1249
Joined: Thu May 23, 2013 12:53 pm

Re: LiteForex Market Analytics

Postby LiteForexTeam » Mon Jun 09, 2014 5:47 am

Forex: Ichimoku Clouds. Review of XAG/USD

XAG/USD, H4
Let’s look at the four-hour chart. Tenkan-sen line is above Kijun-sen, they are both horizontal. Chinkou Span line is above the price chart; current cloud has reversed from descending to ascending. Since the end of the last week the pair has been trading within the cloud. Tenkan-sen line is the closest support level at 19.03. The next obstacle for the price on its way up will be the upper border of the cloud at 19.21.

Image

XAG/USD, D1
On the daily chart Tenkan-sen line is below Kijun-sen, the red lone is directed steeply down, while the blue one remains horizontal. Chinkou Span line is below the price chart from; current cloud is descending. The pair is being corrected above Tenkan-sen line (18.90). Kijun-sen line is the closest resistance level at 19.30.

Image

Key levels
Support levels: 18.88, 18.48.
Resistance levels: 19.25, 19.27.

Trading tips
On the four-hour chart the pair is trading within the cloud, it is not recommended to open new trades at current price. Pending buy orders can be placed above 19.21.

Anastasiya Glushkova
Analyst of LiteForex Investments Limited
LiteForex Representative
LiteForexTeam
 
Posts: 1249
Joined: Thu May 23, 2013 12:53 pm

Re: LiteForex Market Analytics

Postby LiteForexTeam » Mon Jun 09, 2014 6:48 am

EUR/USD: It is likely that downtrend will continue with the target of 1.3300t

Current trend
Following the eventful last week, the pair EUR/USD is quiet, volatility in the pair is low. Trading activity has decreased due to the Bank holidays in France and Germany. However, the decline in the pair was predictable after the reduction of the interest rate by ECB and introduction of the negative interest rates on the loans of the commercial banks. Additional pressure on the pair is provided by the “bulls” as the demand for the USD has increased after the release of the positive data on the US labour market.

Support and resistance
In the medium-term the pair will decline slowly to the levels of 1.3600 and 1.3520. Strengthening in the USD may be protracted and downtrend will continue to the target level of 1.3300.

Support levels: 1.3600, 1.3520, 1.3470, 1.3410 and 1.3300.
Resistance levels: 1.3660, 1.3720, 1.3770, 1.3810, 1.3900, 1.3950 and 1.4000.

Trading tips
It is recommended to open short positions with taking profit at the level of 1.3300.

Image

Dmitry Likhachev
Analyst of LiteForex Group of Companies
LiteForex Representative
LiteForexTeam
 
Posts: 1249
Joined: Thu May 23, 2013 12:53 pm

Re: LiteForex Market Analytics

Postby LiteForexTeam » Mon Jun 09, 2014 10:53 am

Weekly analytical video review for currency pairs EUR/USD, GBP/USD and USD/JPY

Weekly analytical video review for instruments EUR/USD, GBP/USD and USD/JPY based on fundamental analysis and technical indicators (MACD, Stochastic, Bollinger Bands). Daily reviews and forecast are available at LiteForex site http://www.liteforex.com/?uid=434248008

LiteForex Representative
LiteForexTeam
 
Posts: 1249
Joined: Thu May 23, 2013 12:53 pm

Re: LiteForex Market Analytics

Postby LiteForexTeam » Tue Jun 10, 2014 9:55 am

Forex: Ichimoku Clouds. Review of GBP/USD

GBP/USD, H4

On the four-hour chart Tenkan-sen line is above Kijun-sen, the red line is directed downwards, while the blue one remains horizontal. Chinkou Span line is approaching the price chart from above; current cloud is ascending. The pair has entered the cloud, but the fall has been stopped by Kijun-sen-line (1.6772). Upper border of the cloud is the closest resistance level at 1.6787.

Image

GBP/USD, D1

On the daily chart Tenkan-sen line is below Kijun-sen, they are both horizontal. Chinkou Span line is below the price chart; current cloud is still ascending. The pair has entered the cloud, its upper border becomes a resistance level at 1.6789. Tenkan-sen line is the closest support level (1.6789).

Image

Key levels

Support levels: 1.6769, 1.6772.
Resistance levels: 1.6787, 1.6789.

Trading tips

On the both charts the pair is trading within the cloud, it is not recommended to open new trades at current price. Pending sell orders can be placed below 1.6730.

Anastasiya Glushkova
Analyst of LiteForex Investments Limited
LiteForex Representative
LiteForexTeam
 
Posts: 1249
Joined: Thu May 23, 2013 12:53 pm

Re: LiteForex Market Analytics

Postby LiteForexTeam » Tue Jun 10, 2014 10:01 am

USD/JPY: analysis and forecast

Current trend

Last week the pair had reached the local highs of 102.80 but failed to go higher above this level and started downward correction. USD/JPY fell to support level of 102.20, which was strong enough to prevent the pair to go down. However, om Friday after the release of the data on the US labour market The pair rose due to strengthening in the American dollar.
This morning stock index Nikkei 225 has reached the three-months highs, which is obviously a positive factor, which can also become a driver for the growth in the Japanese currency. Not long ago, Japanese GDP for Q1 has been revised upward, which may also support the JPY. The Bank of Japan is unlikely to revise monetary policy in the near future, leaving the volume of stimulation at the previous level.

Support and resistance

The nearest support level is 102.20, which is also a restriction point and if this level is broken down, the pair will fall to the level is 101.95, 101.80 and 101.65. Resistance levels are 102.35, 102.50, 102.60 and 102.80.

Trading tips

The pair is likely to continue to trade in the channel of 102.20-102.80. In case of breakdown of the boundaries of the channel it makes sense to open positions above the level of 103.00 with the target of 104.00, short positions are recommended below the level of 102.00 with the target of 101.30.

Image

Ilya Lashenko
Analyst of LiteForex Investments Limited
LiteForex Representative
LiteForexTeam
 
Posts: 1249
Joined: Thu May 23, 2013 12:53 pm

Re: LiteForex Market Analytics

Postby LiteForexTeam » Wed Jun 11, 2014 9:11 am

EUR/USD: general overview

Current trend

European currency has been losing positions against the USD for the third consecutive day. Yesterday the price of EUR/USD reached the level of 1.3532, approaching the lows of this year at the level of 1.3476. Sale of Euro was caused by recent decision of ECB on monetary policy easing. Nevertheless, Euro has chances for correction, if US retail sales statistics, planned for the release on Thursday, will be weak.

Support and resistance

Resistance levels: 1.3547 (highs of the Asian session), 1.3601 (yesterday’s highs), 1.3647 (сmoving average with the period of 200), 1.3679 (highs of 6 June), 1.3700 (psychologically important level), 1.3740 (moving average lines with the periods of 50 and 100 days).
Support levels: 1.3500 (lows of 5 June), 1.3476 (lows of 2014), 1.3440 (the line of two-year uptrend), 1.3400 (psychologically important level).

Trading tips

In the near future the pair is likely to experience upward correction. Buy orders can be placed from the level of 1.3550 with the first target of 1.3600 and the second target of 1.3645.
Short positions are advisable after breakdown of the level of 1.3495. Short-term target will be at the level of 1.3540, main target - 1.3400, stop-loss is recommended at the level of 1.3005.

Image

Andrey Cherkas
Analyst of LiteForex Investments Limited
LiteForex Representative
LiteForexTeam
 
Posts: 1249
Joined: Thu May 23, 2013 12:53 pm

Re: LiteForex Market Analytics

Postby LiteForexTeam » Wed Jun 11, 2014 9:26 am

USD/CAD: the pair will continue to decline

Current trend

The currency pair USD/CAD continues to trade in the downward channel. On Tuesday the price reached two-week lows at the level of 1.0886. The pair is still under pressure from weak American labour market statistics. In addition, the Canadian dollar is supported by the oil prices.
Today, the pair may be affected by the weekly report on the US oil and oil products inventories. It is expected that this index will reduce by 1.3 million barrels, which will provide support to the Canadian currency.

Support and resistance

It is likely that during the day the price will continue to decline to the levels of 1.0875 and 1.0860. Technical indicators confirm the decline. Bollinger bands are directed downwards. MACD histogram is in the negative zone, its volumes are increasing. Stochastic lines are directed downwards.
Support levels: 1.0875 and 1.0860.
Resistance levels: 1.0900, 1.9015 and 1.0935.

Trading tips

In the current situation it makes sense to open short positions from the current price level with taking profit at the level of 1.0860.

Image

Dmitriy Zolotov
Analyst of LiteForex Investments Limited
LiteForex Representative
LiteForexTeam
 
Posts: 1249
Joined: Thu May 23, 2013 12:53 pm

PreviousNext

Return to Forex Brokers