Forex Analysis & Reviews: EUR/USD Forecast for April 7, 2025
Last Friday, global markets continued to decline — albeit unevenly: the S&P 500 fell by 5.97%, oil by 7.41%, commodity currencies lost around 2% on average, and the yield on 5-year U.S. Treasuries dropped from 3.73% to 3.55%. However, the euro declined by only 0.80%, while the dollar rose by 0.58% against the yen. Today, the euro opened with a 68-pip downward gap, which it filled within an hour and fifteen minutes. Since this morning, all instruments — including S&P 500 futures — have been rising. We believe the market has primarily absorbed the short-term effects of China's newly imposed 34% tariffs on U.S. goods over the weekend.
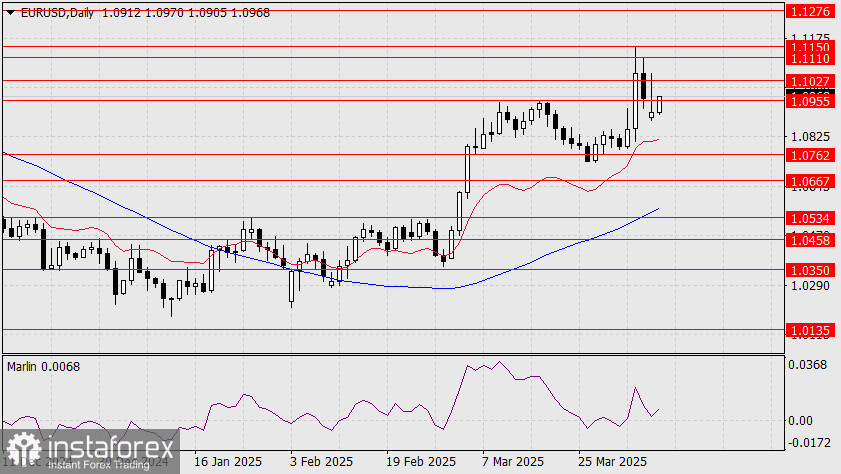
On the daily chart, the euro has broken above the 1.0955 level. The Marlin oscillator is ready to resume growth after stabilizing in positive territory. A breakout above the nearest resistance at 1.1027 will open the way to the target range of 1.1110/50. From there, a move toward 1.1276 — the July 2023 peak — becomes likely, and at that point, a synchronized reversal with the equity market may occur, triggering a new wave of euro weakening. This would represent a typical crisis-style correlation.
The Marlin oscillator shows signs of a reversal from the neutral zero line on the four-hour chart. The price has consolidated above the 1.0955 level. We expect continued growth toward the first target at 1.1027, followed by an extended move into the 1.1110/50 target zone.
Analysis are provided by InstaForex.
Read more: https://ifxpr.com/44dE3Fm
|
|

|
Instaforex Analysis
Re: Instaforex Analysis
![]() by IFX Bella » Mon Apr 07, 2025 3:59 am
by IFX Bella » Mon Apr 07, 2025 3:59 am
- IFX Bella
- Posts: 650
- Joined: Sat Dec 08, 2012 12:39 am
Re: Instaforex Analysis
![]() by IFX Bella » Tue Apr 08, 2025 5:32 am
by IFX Bella » Tue Apr 08, 2025 5:32 am
Forex Analysis & Reviews: Forecast for EUR/USD – April 8, 2025
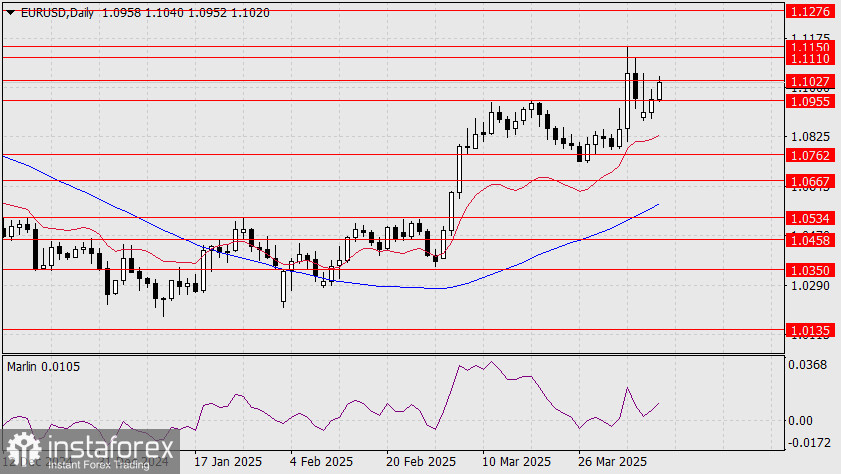
On Monday, the euro reached the 1.1027 target level but dropped below 1.0955. Nonetheless, the single currency achieved its primary goal, reaffirming its intent to resume growth. Currently, the price is attempting to rise above the 1.0955 resistance level. If successful, the move toward 1.1027 may continue with stronger support. The Marlin oscillator has turned upward without even reaching the boundary of the bearish territory.
The increasing distance between the price and the balance line (red moving average) is also worth noting, which suggests the past two days' price action was merely a correction within a medium-term upward trend. However, this growth may end relatively soon—around the 1.1276 level, the next target above the most recent high. This growth is occurring against the backdrop of a rising stock market correction. Once that correction ends, the currency market may also reverse, shifting back to the US dollar as a safe-haven asset.
The balance line has supported the price on the four-hour chart throughout the two-day correction. The Marlin oscillator briefly entered bearish territory, but if it resumes upward movement, this can be considered a false signal—another sign of further growth. The first target is 1.1027. A breakout above this level opens the way to the second target, 1.1110.
Analysis are provided by InstaForex.
Read more: https://ifxpr.com/421aVjg
- IFX Bella
- Posts: 650
- Joined: Sat Dec 08, 2012 12:39 am
Re: Instaforex Analysis
![]() by IFX Bella » Wed Apr 09, 2025 4:47 am
by IFX Bella » Wed Apr 09, 2025 4:47 am
Forex Analysis & Reviews: EUR/USD Forecast for April 9, 2025
By the end of Tuesday, the euro gained 45 pips, and during today's Pacific session, it has added roughly the same amount, approaching the target level of 1.1027. If resistance is broken, the price may target the 1.1110/50 range. However, a bearish trap could be lurking there. The reason is that commodities and stock indices continue to decline sharply, and the euro might not withstand the pressure. Yesterday, oil fell by 2.16%, and the S&P 500 by 1.57%.
A consolidation above the 1.1110/50 range, combined with a correctional rebound in equity markets and oil, could extend the euro's rise toward the 1.1276 target. An alternative scenario with a drop in the euro toward 1.0762 may also unfold, but for that, the pair needs to consolidate below the 1.0955 level.
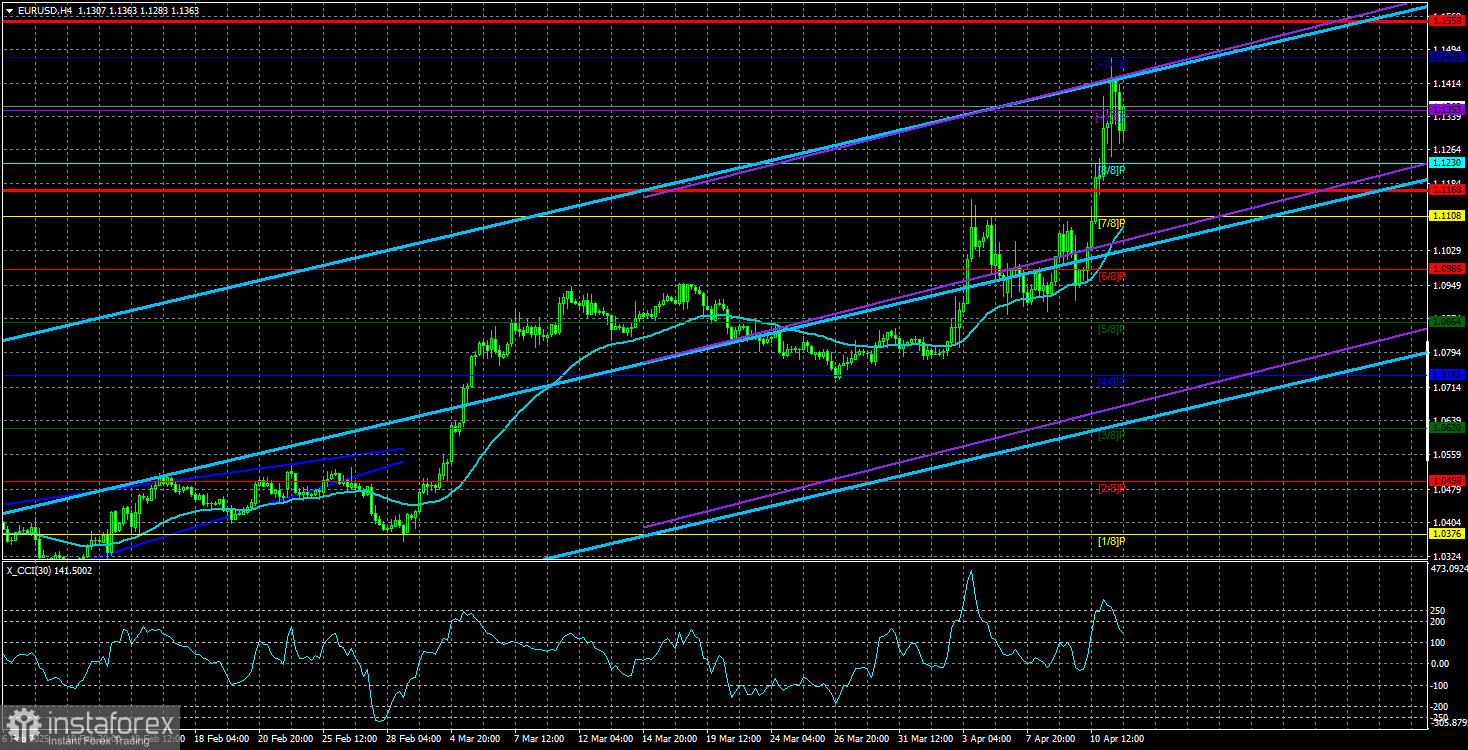
On the H4 chart, the Marlin oscillator has timely entered positive territory—indicating the price needs support to break through the 1.1027 resistance level. Once the price has consolidated above this level, it could cautiously advance to the target zone.
Analysis are provided by InstaForex.
Read more: https://ifxpr.com/3REKY2O
By the end of Tuesday, the euro gained 45 pips, and during today's Pacific session, it has added roughly the same amount, approaching the target level of 1.1027. If resistance is broken, the price may target the 1.1110/50 range. However, a bearish trap could be lurking there. The reason is that commodities and stock indices continue to decline sharply, and the euro might not withstand the pressure. Yesterday, oil fell by 2.16%, and the S&P 500 by 1.57%.
A consolidation above the 1.1110/50 range, combined with a correctional rebound in equity markets and oil, could extend the euro's rise toward the 1.1276 target. An alternative scenario with a drop in the euro toward 1.0762 may also unfold, but for that, the pair needs to consolidate below the 1.0955 level.
On the H4 chart, the Marlin oscillator has timely entered positive territory—indicating the price needs support to break through the 1.1027 resistance level. Once the price has consolidated above this level, it could cautiously advance to the target zone.
Analysis are provided by InstaForex.
Read more: https://ifxpr.com/3REKY2O
- IFX Bella
- Posts: 650
- Joined: Sat Dec 08, 2012 12:39 am
Re: Instaforex Analysis
![]() by IFX Bella » Thu Apr 10, 2025 6:32 am
by IFX Bella » Thu Apr 10, 2025 6:32 am
Forex Analysis & Reviews: EUR/USD Forecast for April 10, 2025
Yesterday, U.S. President Donald Trump lowered tariffs to 10% for 90 days for countries that did not retaliate to the initial U.S. tariffs (more than 75 in total). Meanwhile, tariffs on China were raised to 125%. The S&P 500 stock index surged by 9.51%, the U.S. dollar index dipped slightly by 0.08%, and the euro closed with a modest decline after previously forming a 130-point upper shadow during the session.
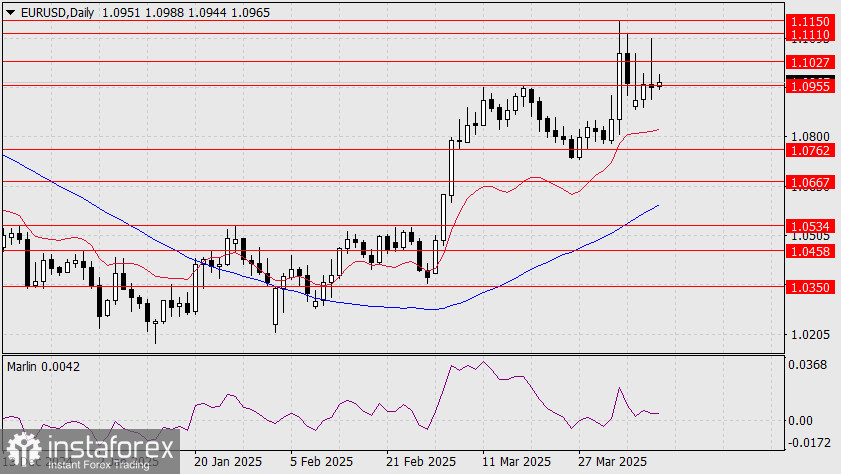
Thursday has begun with renewed growth. After breaking above resistance at 1.1027, we expect the price to move toward the 1.1110/50 range. The Marlin oscillator is slowly turning upward. On the H4 chart, the price briefly held above 1.1027 but then dipped below support at 1.0955. The bullish sentiment remains intact since there was no sustained close below this level.
We expect another firm move above 1.1027 and further growth toward the mentioned target range. The Marlin oscillator has weakened and is currently lagging. A consolidation above 1.1027 would help the oscillator recover and support the uptrend.
Analysis are provided by InstaForex.
Read more: https://ifxpr.com/43OFBWe
Yesterday, U.S. President Donald Trump lowered tariffs to 10% for 90 days for countries that did not retaliate to the initial U.S. tariffs (more than 75 in total). Meanwhile, tariffs on China were raised to 125%. The S&P 500 stock index surged by 9.51%, the U.S. dollar index dipped slightly by 0.08%, and the euro closed with a modest decline after previously forming a 130-point upper shadow during the session.
Thursday has begun with renewed growth. After breaking above resistance at 1.1027, we expect the price to move toward the 1.1110/50 range. The Marlin oscillator is slowly turning upward. On the H4 chart, the price briefly held above 1.1027 but then dipped below support at 1.0955. The bullish sentiment remains intact since there was no sustained close below this level.
We expect another firm move above 1.1027 and further growth toward the mentioned target range. The Marlin oscillator has weakened and is currently lagging. A consolidation above 1.1027 would help the oscillator recover and support the uptrend.
Analysis are provided by InstaForex.
Read more: https://ifxpr.com/43OFBWe
- IFX Bella
- Posts: 650
- Joined: Sat Dec 08, 2012 12:39 am
Re: Instaforex Analysis
![]() by IFX Bella » Mon Apr 14, 2025 7:59 am
by IFX Bella » Mon Apr 14, 2025 7:59 am
Forex Analysis & Reviews: EUR/USD Overview. April 14: The Dollar—From Leader to Laggard
The EUR/USD currency pair continued its steady rally on Friday. At this point, there are no more questions about what is happening in the currency market—it's as simple as it gets. Donald Trump keeps raising the stakes, attempting to force (there's no better word) every country trading with the U.S. to do so strictly on American terms. Naturally, not everyone is thrilled with this turn of events, and the much-talked-about line of eager trade delegations to the White House has yet to appear. Speaking of Trump, he has never been shy with words—and this time is no different. According to the sitting U.S. President, all countries are ready to "lick (censored)" to get a trade deal with the U.S. It's worth noting that these are official statements by the President of the United States. In our view, this borders on surrealism and absurdity. Trump continues to insult, humiliate, and issue ultimatums while waging trade wars under the guise of being a peacemaker. The results of his actions are nothing short of comical. Trump wants to bring back jobs and factories to the U.S., grow the economy, reduce the trade deficit, and cut national debt. Currently, the outcomes are the exact opposite. Investors and traders are fleeing American assets, and many notable figures are leaving the U.S. The economy is beginning to slow, and now even the most conservative analysts are forecasting a recession. Inflation is declining for now, but no one doubts it will accelerate significantly soon. Jobs aren't rushing back to the U.S., and factories aren't planning large-scale relocations. On the contrary, companies are seeking ways to avoid Trump's tariffs—but we haven't heard of any major firm moving production back to the U.S. As for the national debt—thanks to Trump's policies, it's only likely to increase. Remember that government bonds are traditionally considered a stable and safe investment tool. U.S. Treasuries are now being sold off. As a result, bond yields are rising—and yield is effectively the cost of borrowing. In other words, the U.S. government is now forced to borrow at higher rates. We're talking about billions of dollars at increased interest rates. So we—and many experts—are left wondering: was it worth it? Perhaps there are brilliant economists in the Trump administration capable of modeling not only cash flows but also the reactions of half the world's countries to this kind of policy. But for now, the results are deeply disappointing. Some experts even believe the bond market may end up restraining Trump. In short, the more the bond market declines, the more the U.S. will pay in interest. This trend has started to worry Trump, which is likely why we're beginning to hear talk of "tariff amnesties."
Analysis are provided by InstaForex.
Read more: https://ifxpr.com/42IR2h6
- IFX Bella
- Posts: 650
- Joined: Sat Dec 08, 2012 12:39 am
Re: Instaforex Analysis
![]() by IFX Bella » Mon Apr 21, 2025 8:56 am
by IFX Bella » Mon Apr 21, 2025 8:56 am
Forex Analysis & Reviews: Technical Analysis of Intraday Price Movement USD/JPY Main Currency Pairs, Monday April 21, 2025.
With the appearance of Convergence between the price movement of the main currency pair USD/JPY with the Stochastic Oscillator indicator and the position of the EMA (100) which is above the price, in the near future USD/JPY has the potential to continue its weakening where as long as there is no further strengthening that breaks and closes above the level of 149.43, then USD/JPY will continue its weakening to the level of 139.59 if the volatility and momentum of the weakening support it, then 137.10 will be the next target that will be tested and aimed for.
Analysis are provided by InstaForex.
Read more: https://ifxpr.com/42r1ERW
- IFX Bella
- Posts: 650
- Joined: Sat Dec 08, 2012 12:39 am
Re: Instaforex Analysis
![]() by IFX Bella » Tue Apr 22, 2025 7:30 am
by IFX Bella » Tue Apr 22, 2025 7:30 am
Forex Analysis & Reviews: GBP/USD: Simple Trading Tips for Beginner Traders on April 22. Review of Yesterday's Forex Trades
Analysis of Trades and Trading Tips for the British Pound The price test at 1.3379 occurred when the MACD indicator had already moved far below the zero mark, which limited the pair's downside potential. For this reason, I did not sell the pound. I also didn't see any other entry points in the market. Yesterday's lack of data from the UK helped the pound continue its upward movement. The same scenario might repeat today, as no major macroeconomic indicators are expected. However, it's unwise to rely solely on the absence of news. The currency market is unpredictable, and investor sentiment can shift due to external factors, including the US stance on trade tariffs. Don't forget that the pound is traded against the dollar, which is currently under heavy pressure from several angles: ongoing trade tariffs, inflationary risks, and Donald Trump's pressure on Jerome Powell to cut interest rates—something that, as you probably know, is negative for the dollar. For intraday strategy, I will focus primarily on Scenarios #1 and #2.
Buy Signal Scenario #1: I plan to buy the pound today at the entry point around 1.3424 (green line on the chart) with a target of 1.3465 (thicker green line). Around 1.3465, I plan to exit the buys and open short positions in the opposite direction (expecting a 30–35 pip retracement from the entry point). Important: Before buying, ensure the MACD indicator is above the zero mark and beginning to rise. Scenario #2: I also plan to buy the pound if there are two consecutive tests of the 1.3394 level while the MACD indicator is in the oversold zone. This would limit the pair's downside potential and trigger an upward reversal. A price rise toward the opposite levels of 1.3424 and 1.3465 can be expected. Sell Signal Scenario #1: I plan to sell the pound today after a break below 1.3394 (red line on the chart), which should lead to a rapid drop. The key target for sellers will be 1.3349, where I plan to exit the shorts and immediately open long positions in the opposite direction (expecting a 20–25 pip rebound from the level). Important: Before selling, ensure the MACD indicator is below the zero mark and just beginning its downward movement. Scenario #2: I also plan to sell the pound in the event of two consecutive tests of the 1.3424 level while the MACD indicator is in the overbought zone. This would limit the pair's upside potential and lead to a reversal downward. A drop toward 1.3394 and 1.3349 can then be expected.
What's on the Chart: The thin green line represents the entry price where the trading instrument can be bought. The thick green line indicates the expected price level where a Take Profit order can be placed, or profits can be manually secured, as further price growth above this level is unlikely. The thin red line represents the entry price where the trading instrument can be sold. The thick red line indicates the expected price level where a Take Profit order can be placed, or profits can be manually secured, as further price decline below this level is unlikely. The MACD indicator should be used to assess overbought and oversold zones when entering the market.
Analysis are provided by InstaForex.
Read more: https://ifxpr.com/4ji9jrn
- IFX Bella
- Posts: 650
- Joined: Sat Dec 08, 2012 12:39 am
Re: Instaforex Analysis
![]() by IFX Bella » Fri Apr 25, 2025 4:30 am
by IFX Bella » Fri Apr 25, 2025 4:30 am
Forex Analysis & Reviews: Trading Recommendations and Analysis for EUR/USD April 25: The Market Awaits New Announcements from Trump
The EUR/USD currency pair traded much more calmly on Thursday than during the first half of the week, and the market was also relatively more technical. Since the beginning of the week, we've been repeating the same message—market movements have been unusually erratic and chaotic, and the market is simply ignoring any macroeconomic backdrop. While the second point remained unchanged on Thursday, the first was temporarily neutralized. It is hard to determine how long that will last. Volatility on Thursday was noticeably lower. For most of the day, the euro continued to rise while the dollar declined, directly contradicting the macroeconomic data. The most important report of the day—U.S. durable goods orders—was unexpectedly much stronger than forecast. Growth amounted to +9.2% m/m. This figure is easily explained: by March, Trump's tariffs were already announced, prompting Americans to rush and purchase big-ticket items before prices surged. However, this doesn't change the essence of the report. The data significantly exceeded expectations yet failed to trigger any growth in the U.S. dollar—or even a market reaction. In short, there is no Trump news—no movement, and the dollar still doesn't grow. After strong growth on Monday and a sharp decline on Tuesday—triggered by the firing and subsequent reinstatement of Jerome Powell as Federal Reserve Chair—the price returned to the sideways channel it had been trading in all last week. Therefore, in the absence of new information from Trump, the price may continue to move sideways. Among Thursday's trading signals, we can highlight the bounce off the 1.1391 level, after which the price moved down a couple of dozen pips. While the move was small, such signals and profits are preferable to market storms and complete disregard for technical analysis.
The latest COT report is dated April 15. The chart above clearly shows that the net position of non-commercial traders had long remained bullish. Bears barely managed to gain the upper hand but quickly lost it again. The bears' advantage has visibly diminished since Trump took office, and the dollar sharply declined. We cannot definitively say that the decline of the U.S. currency will continue, but COT reports reflect the sentiment of large players—which can change rapidly under the current circumstances. We still see no fundamental factors justifying euro strength, but one significant factor is now driving dollar weakness. The pair may continue to correct for several more weeks or months, but a 16-year downtrend won't reverse so easily. The red and blue lines have now crossed again, signaling a bullish trend in the market. During the latest reporting week, the "Non-commercial" group increased its long positions by 6,800 and reduced its short positions by 2,500, resulting in a net increase of 9,300 contracts.
The EUR/USD pair maintains its upward trend on the hourly timeframe, though there is no clear trendline or channel. On the daily chart, we can officially say that the downtrend has been canceled—something that would never have happened if Trump hadn't started a trade war. Thus, the fundamental backdrop has broken the technical picture—something rare but not impossible. There is currently very little logic or technical structure in the pair's movements across all timeframes, and macroeconomic data does not impact the pair's dynamics. Trading levels for April 25: 1.0823, 1.0886, 1.0949, 1.1006, 1.1092, 1.1147, 1.1185, 1.1234, 1.1274, 1.1321, 1.1391, 1.1474, 1.1607, 1.1666. Ichimoku lines: Senkou Span B (1.1182), Kijun-sen (1.1438). Ichimoku indicator lines may shift during the day and should be considered when determining trade signals. Also, don't forget to move your Stop Loss to breakeven if the price moves 15 pips in the desired direction. This will help protect against potential losses if the signal is false. On Friday, no significant events or reports are scheduled in the Eurozone. In the U.S., the University of Michigan Consumer Sentiment Index will be released. We've seen much more important reports recently that were utterly ignored. However, the market is still in chaos and disorder, and the EUR/USD pair may continue to trade sideways until new tariffs or Trump firings occur.
Analysis are provided by InstaForex.
Read more: https://ifxpr.com/3EqWPyO
- IFX Bella
- Posts: 650
- Joined: Sat Dec 08, 2012 12:39 am
Re: Instaforex Analysis
![]() by IFX Bella » Mon Apr 28, 2025 3:29 am
by IFX Bella » Mon Apr 28, 2025 3:29 am
Forex Analysis & Reviews: GOLD – Technical Analysis Overview
Last week, the bulls updated historical highs and formed a new maximum extremum at 3499.58. Afterward, gold entered a downward correction towards the support of the daily short-term trend at 3346.45. The market has taken a pause. If bearish sentiment receives a new impulse for development, the next target will be the daily medium-term trend at 3227.79, and then the corrective decline may extend toward the support of the weekly short-term trend at 3164.81. Eliminating the daily golden cross at 3163.64 and consolidating below the weekly levels at 3164.81–3131.58 would open up new bearish prospects.
On the lower timeframes, the main advantage remains with the bears. The market is operating below the key levels, currently at 3334.45 (the daily central Pivot level) and 3356.56 (the weekly long-term trend). Consolidation above the trend line and its reversal could shift the current balance of forces in favor of further bullish recovery. Resistance levels will be important for the bulls if the market starts developing directed movements, and support levels will be important for the bears according to the classic pivot points. Pivot levels are updated daily, and new actual data will appear at the opening of trading. ***
Analysis are provided by InstaForex.
Read more: https://ifxpr.com/4jotDre
- IFX Bella
- Posts: 650
- Joined: Sat Dec 08, 2012 12:39 am
Re: Instaforex Analysis
![]() by IFX Bella » Tue Apr 29, 2025 4:11 am
by IFX Bella » Tue Apr 29, 2025 4:11 am
Forex Analysis & Reviews: EUR/USD Overview – April 29: The Weak Yield, the Strong Resist
On Monday, the EUR/USD currency pair remained immobilized. There were no updates over the weekend from Donald Trump regarding trade developments, and no important data or events were scheduled for Monday. Therefore, the market had nothing to react to during the day. However, the EUR/USD pair has already been trading within a sideways channel for three weeks. Over the past few days, volatility has also declined significantly. Nevertheless, one should not conclude that the market has calmed down — instead, the market is waiting. Few believe that Trump will refrain from raising or introducing new tariffs. Already, reports have surfaced suggesting possible tariff hikes of up to 20% for the EU. Meanwhile, China is not engaged in negotiations with the United States, which could deeply frustrate Trump, who had counted on reaching a deal within 3–4 weeks. Therefore, it is too early to speak of the end or de-escalation of the global trade war. It must be acknowledged that many countries from "Trump's list" are negotiating with the U.S. about trade deals. However, as we stated two months ago, mainly weak countries — economically, geographically, or geopolitically — are trying to reach an agreement with the conflict-prone and "fair" U.S. president. For example, Hungary (even though it is an EU member) is eager to secure a deal. Vietnam, which faces 46% import tariffs, strives to negotiate. Talks are underway with South Korea, Japan, and several other countries. Yet this list is missing notable heavyweights like Canada, the European Union, and China. To be precise, consultations with Brussels are ongoing, but no sign of a trade deal emerging. The market cannot be cheered by progress in talks with Vietnam. The American market and U.S. investments constitute half of Vietnam's economy. The U.S. is an important economic partner for the EU and China, but cooperation with the U.S. is far less important than it is for Vietnam. It is also important to understand that America is a competitor to the EU and China, while Vietnam is unlikely to compete with the U.S. Thus, weaker players seek agreements with Trump, while stronger ones resist and demand a fair and equitable deal. The market is interested in progress with China and the EU. Without progress, the dollar cannot gain strength against its major competitors. Therefore, after reaching another high, the price has simply been moving sideways for three weeks. Current movements cannot be described as technical either since we barely observe any corrections. Accordingly, there is a 90% probability that market movements (or lack thereof) this week will depend solely on the U.S. president.
The average volatility of the EUR/USD currency pair over the last five trading days as of April 29 is 101 pips, which is considered "high." We expect the pair to move between the levels of 1.1284 and 1.1485 on Tuesday. The long-term regression channel is pointing upward, indicating a short-term uptrend. The CCI indicator has entered the overbought zone for the third time, signaling a new corrective movement phase, which, so far, is very weak — as were previous ones. Nearest Support Levels: S1 – 1.1230 S2 – 1.0986 S3 – 1.0742 Nearest Resistance Levels: R1 – 1.1475 R2 – 1.1719 R3 – 1.1963 Trading Recommendations: The EUR/USD pair maintains a short-term upward bias. For months, we have consistently said that we expect the euro to decline in the medium term, and nothing has changed. The dollar still has no fundamental reasons for a medium-term fall—other than Donald Trump. Yet this single factor continues to push the dollar into an abyss while the market ignores all other factors. If you are trading based on "pure" technical analysis or "Trump factor," long positions remain relevant as long as the price stays above the moving average, targeting 1.1719. If the price consolidates below the moving average, short positions formally become relevant with targets at 1.1230 and 1.0986 — though it is currently hard to believe in a dollar rally. In recent weeks, there have been no new developments regarding the escalation or de-escalation of the trade war, which explains the ongoing flat movement in the market. Explanation of Illustrations: Linear Regression Channels help determine the current trend. If both channels are aligned, it indicates a strong trend. Moving Average Line (settings: 20,0, smoothed) defines the short-term trend and guides the trading direction. Murray Levels act as target levels for movements and corrections. Volatility Levels (red lines) represent the likely price range for the pair over the next 24 hours based on current volatility readings. CCI Indicator: If it enters the oversold region (below -250) or overbought region (above +250), it signals an impending trend reversal in the opposite direction.
Analysis are provided by InstaForex.
Read more: https://ifxpr.com/3Gu06xI
- IFX Bella
- Posts: 650
- Joined: Sat Dec 08, 2012 12:39 am