Instaforex Analysis

Forex broker related topics and discussions

Re: Instaforex Analysis

Postby IFX Gertrude » Mon Dec 04, 2023 4:38 am

AUD/USD Update for December 04, 2023 - Berish divergence on the oscillator

Technical analysis:

Image

AUD/USD has been trading downside this morning and I found rejection of the previous swing high at 0.6680, which is good sign for the further downside movement.

Due to the rejection of the previous swing high and the bearish divergence on the RSI oscillator, I see potential for the further drop towards lower references.

Downside objectives are set at the price of 0.6570 and 0.6524

RSI oscillator is showing fresh bearish divergence in the background, which is sign for the downside rotation.

Key resistance is set at the price of 0.6680

Analysis are provided by InstaForex.

Read More https://ifxpr.com/41mSwM1
Best regards, PR Manager

Learn more about InstaForex Company at http://instaforex.com
IFX Gertrude
 
Posts: 5198
Joined: Wed Nov 07, 2012 6:25 am

Re: Instaforex Analysis

Postby IFX Gertrude » Tue Dec 05, 2023 1:31 am

USD/CAD I Bearish Reversal?

Image

The USD/CAD chart is showing signs of a potential bearish reversal, with significant support and resistance levels in play.

Resistance Levels:
At 1.35788, the 1st resistance level is characterized as "Pullback resistance." This level signifies a zone where selling pressure may emerge, potentially hindering upward momentum. Additionally, the 2nd resistance level at 1.35280 is identified as "An Overlap resistance," reinforcing its role as a significant resistance zone.

Support Levels:
On the support side, the 1st support level at 1.34893 is labeled as "Swing low support." This level implies a potential area where buying interest may emerge, serving as a crucial support zone. Similarly, the 2nd support level at 1.34304 is characterized as "Swing low support," reinforcing its potential to provide support to the price.

Analysis are provided by InstaForex.

Read More https://ifxpr.com/484bYPs
Best regards, PR Manager

Learn more about InstaForex Company at http://instaforex.com
IFX Gertrude
 
Posts: 5198
Joined: Wed Nov 07, 2012 6:25 am

Re: Instaforex Analysis

Postby IFX Gertrude » Wed Dec 06, 2023 2:42 am

XAU/USD H4 I Bullish Bounce?

Image

The XAU/USD chart suggests the potential for a bullish bounce, with significant support and resistance levels at play.

Support Levels:
At 2009.00, the 1st support is characterized as "An Overlap support." This level signifies a potential area where buying interest may emerge, potentially facilitating a bounce. Similarly, the 2nd support at 1991.00 is also identified as "An Overlap support," reinforcing its potential significance in providing support to the price.

Resistance Levels:
On the resistance side, the 1st resistance level at 2034.68 is labeled as "An Overlap resistance." This level represents a notable barrier to further upward price movement and warrants attention from traders. Additionally, the 2nd resistance at 2051.18 is characterized by "Pullback resistance," further emphasizing its role as a significant resistance zone.

Analysis are provided by InstaForex.

Read More https://ifxpr.com/3T7KuV5
Best regards, PR Manager

Learn more about InstaForex Company at http://instaforex.com
IFX Gertrude
 
Posts: 5198
Joined: Wed Nov 07, 2012 6:25 am

Re: Instaforex Analysis

Postby IFX Gertrude » Thu Dec 07, 2023 12:15 am

USD/JPY Day I Bearish continuation expected?

Image

The USD/JPY chart is currently indicating the potential for a bearish breakout, with significant support and resistance levels at play.

Support Levels:
At 144869.00, the 1st support is characterized as "An Overlap support." This level signifies a potential area where buying interest may emerge, potentially preventing further downward movement. Additionally, the 2nd support at 141.98 is identified as "An Overlap support," further reinforcing its potential significance in providing support to the price.

Resistance Levels:
On the resistance side, the 1st resistance level at 148.28 is labeled as "An Overlap resistance." This level represents a notable barrier to further upward price movement and warrants attention from traders.

Analysis are provided by InstaForex.

Read More https://ifxpr.com/3RtCT1R
Best regards, PR Manager

Learn more about InstaForex Company at http://instaforex.com
IFX Gertrude
 
Posts: 5198
Joined: Wed Nov 07, 2012 6:25 am

Re: Instaforex Analysis

Postby IFX Yvonne » Fri Dec 08, 2023 9:05 am

Forecast for AUD/USD on December 8, 2023

Yesterday, the Australian dollar, with overlaps, covered the entire range of levels 0.6547-0.6612. It sharply grew when the Marlin oscillator's signal line turned from the zero line.

Image

According to technical rules, the pair can rise further by surpassing the previous day's high (0.6623), but since the US will release important data today, there may be a false breakout above 0.6623.

According to technical rules, the pair can rise further by surpassing the previous day's high (0.6623), but since the US will release important data today, there may be a false breakout above 0.6623.


Image


On the 4-hour chart, the price is consolidating just before the resistance level of 0.6612. The MACD line is slightly above it, precisely at yesterday's high. Consolidating above it will signal further growth. The Marlin oscillator is already in the uptrend territory. We are waiting for the resolution of the situation with the release of the US data.


Analysis are provided byInstaForex.

Read More
Best Regards,
PR Manager
InstaForex Companies Group
User avatar
IFX Yvonne
 
Posts: 287
Joined: Sat Mar 02, 2013 12:23 am

Re: Instaforex Analysis

Postby IFX Gertrude » Mon Dec 11, 2023 12:13 am

Forex Analysis & Reviews: Forecast for EUR/USD on December 11, 2023

EUR/USD
Friday's U.S. labor data turned out better than expected. The result was reflected in a decrease in the unemployment rate from 3.9% to 3.7%. The balance indicator line stopped the initial downward movement in response to the news. This was evidently influenced by the risk appetite, as the S&P 500 stock index grew by 0.41%. It is very close to continuing its growth in the medium-term, and to achieve this, the quote needs to surpass the year's high of 4612 (July 27), paving the way for the pair to reach the record target of 4816 (January 2022).

Image

From this perspective, the euro's growth is limited to the time when the S&P 500 continues to rise. Synchronization with this timeframe gives the first serious target level of 1.1076 – the upper band of the descending price hyperchannel, coinciding with the peak on April 14 (December 21-22).

Image

On the 4-hour chart, a double convergence has formed, which could provide the initial momentum in order for the price to rise further so it can consolidate above 1.0825. This would mean settling above the nearest embedded line of the price channel, marked on the daily chart. Subsequent consolidation above the MACD line (1.0850) would mean overcoming the Fibonacci ray on the daily chart and pave the way for the pair to reach the target level of 1.0905. Considering the upcoming Federal Reserve meeting, the euro's growth could be quite strong.

Analysis are provided by InstaForex.

Read More https://ifxpr.com/3tf6iUb
Best regards, PR Manager

Learn more about InstaForex Company at http://instaforex.com
IFX Gertrude
 
Posts: 5198
Joined: Wed Nov 07, 2012 6:25 am

Re: Instaforex Analysis

Postby IFX Gertrude » Tue Dec 12, 2023 12:24 am

Forex Analysis & Reviews: Forecast for EUR/USD on December 12, 2023

EUR/USD
In the previous review, we tied the rise of counter-dollar currencies to the development of risk sentiment in the broader market. Yesterday, the S&P 500 stock index surpassed the nearest peak from July 27 (4612), and now it has a good target at the level of 4818, which is a record high (January 2022). Oil has risen slightly. Yields on US government bonds have not changed for the third day in anticipation of tomorrow's Federal Reserve meeting.

Image

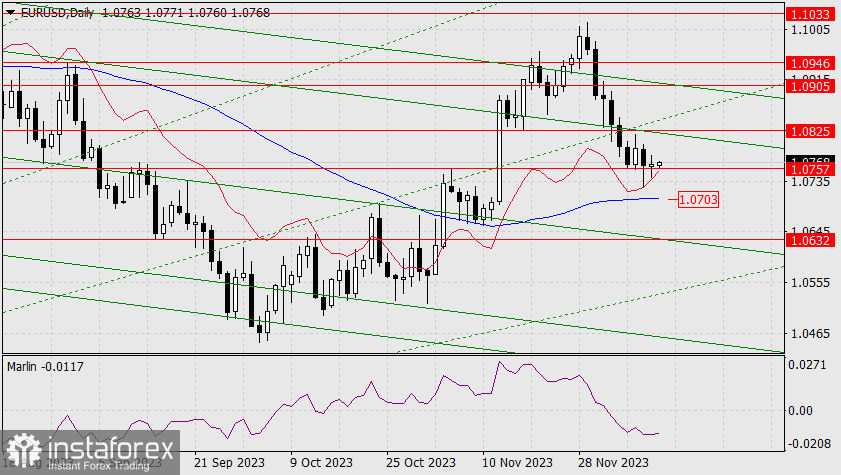
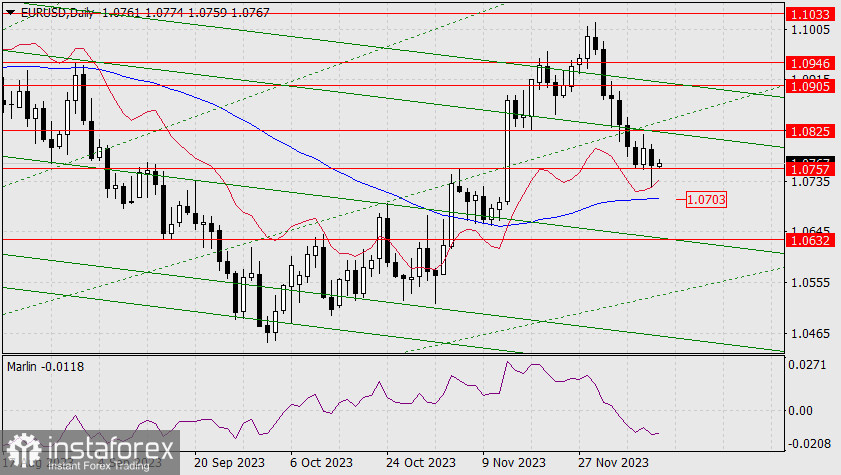
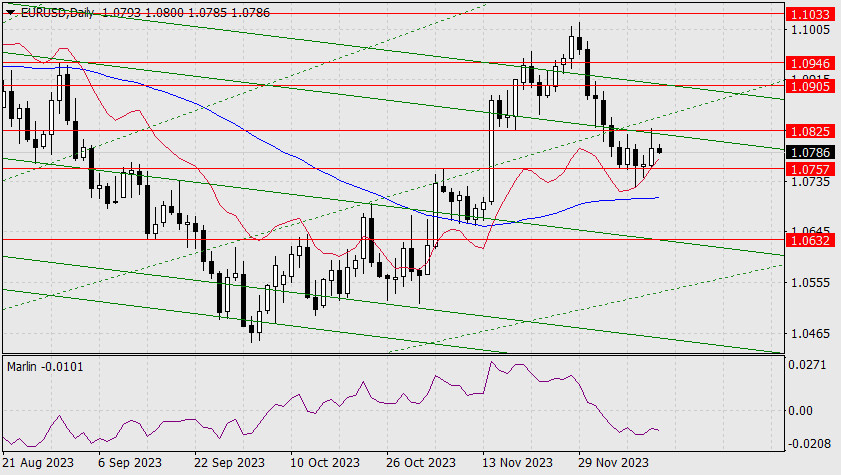
On the daily chart, the price has consolidated above the level of 1.0757. The Marlin oscillator is slowly turning upward. If there are no significant events that will hinder the euro's way, the price will continue to rise towards the target level of 1.0825.

A potential bullish breakout, in continuation of the decline from November 29, will take place if the price surpasses the support of the MACD line in the area of 1.0703. The first bearish target will be 1.0632. Exchange Rates 12.12.2023 analysis

Image

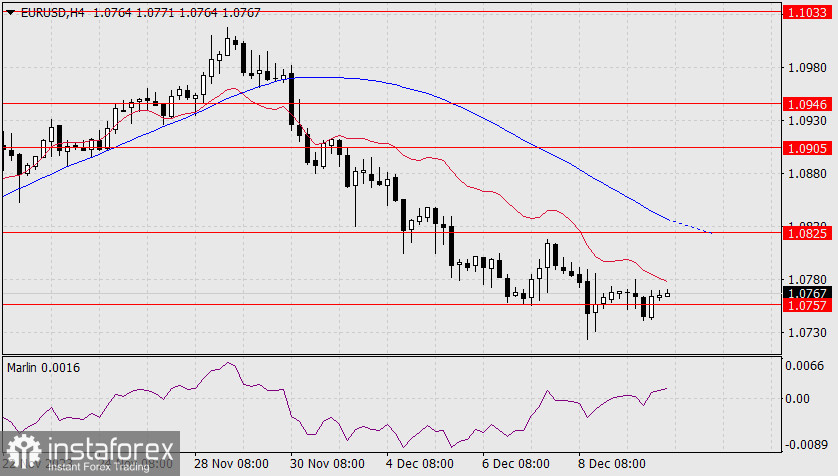
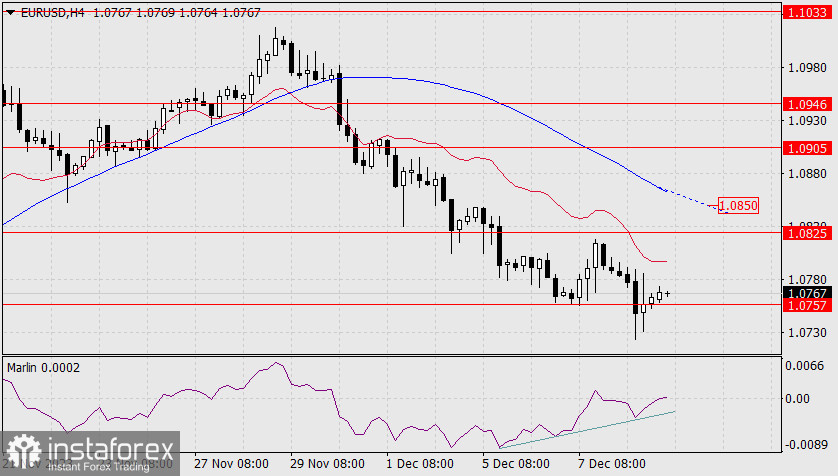
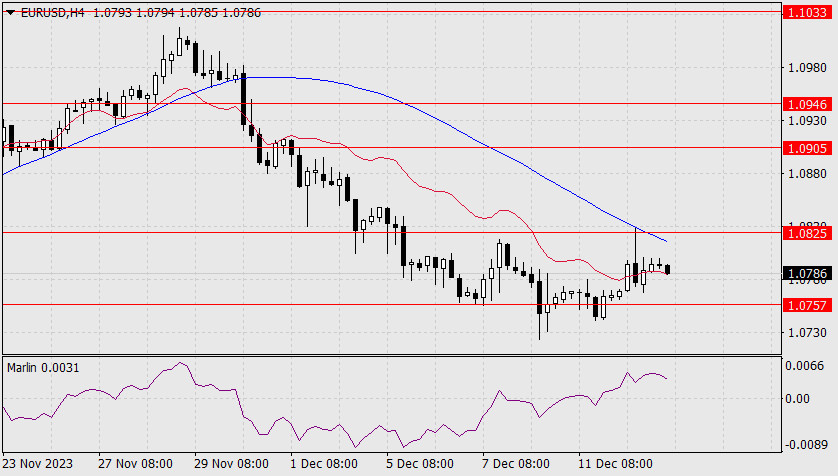
On the 4-hour chart, the price is consolidating symbolically above the support of 1.0757. The signal line of the Marlin oscillator, after the previous convergence, entered the uptrend territory. Overcoming the level of 1.0825 will support the uptrend, as resistance is strengthened by the approaching MACD line.

Analysis are provided by InstaForex.

Read More https://ifxpr.com/3t4EIcl
Best regards, PR Manager

Learn more about InstaForex Company at http://instaforex.com
IFX Gertrude
 
Posts: 5198
Joined: Wed Nov 07, 2012 6:25 am

Re: Instaforex Analysis

Postby IFX Gertrude » Wed Dec 13, 2023 3:32 am

Forecast for EUR/USD on December 13, 2023

EUR/USD
So, yesterday's US inflation data turned out to be positive for the euro. The core CPI for November remained at the previous 4.0% YoY, while the CPI decreased from 3.2% YoY to 3.1% YoY. Such an optimistic trend of decreasing inflation could be reflected in today's dot plot projections on interest rates by FOMC members.

Image

Today, the euro may surpass yesterday's high and continue to rise.

Yesterday, the upper shadow reached the target level of 1.0825. According to the main scenario, we expect a breakout and the euro to rise towards 1.0905. The second target is 1.0946.

Image

On the 4-hour chart, the price reached the MACD indicator line and retraced slightly downwards. The price settled above the balance line indicator, and the Marlin oscillator settled in the uptrend territory. If the price consolidates above 1.0825, it will mean consolidation above the MACD line. We expect the euro to continue rising according to the main plan.

Analysis are provided by InstaForex.

Read More https://ifxpr.com/3Nq7Rpj
Best regards, PR Manager

Learn more about InstaForex Company at http://instaforex.com
IFX Gertrude
 
Posts: 5198
Joined: Wed Nov 07, 2012 6:25 am

Re: Instaforex Analysis

Postby IFX Gertrude » Thu Dec 14, 2023 1:44 am

Forex Analysis & Reviews: Forecast for AUD/USD on December 14, 2023

AUD/USD
The Australian dollar sharply strengthened after yesterday's Federal Reserve meeting – up 100 pips compared to the euro's 80-pip rise. In today's Asian session, the pair continued to rise at an even greater speed, and has already surpassed the target level of 0.6693. With that said, we now expect the uptrend to move forward towards the target levels of 0.6775 and 0.6815 (the average value of the peaks in April and May).

Image

A slight move of the Marlin oscillator's signal line into negative territory (red arrow) is now considered a false move, afterwards we witnessed movement into the overbought territory.

Image

On the 4-hour chart, the price is trying to consolidate above the level of 0.6693. If it successfully manages to consolidate, this would automatically support the pair's rise to 0.6775.

Analysis are provided by InstaForex.

Read More https://ifxpr.com/48ekxHJ
Best regards, PR Manager

Learn more about InstaForex Company at http://instaforex.com
IFX Gertrude
 
Posts: 5198
Joined: Wed Nov 07, 2012 6:25 am

Re: Instaforex Analysis

Postby IFX Gertrude » Fri Dec 15, 2023 12:15 am

Forex Analysis & Reviews: Forecast for USD/JPY on December 15, 2023

USD/JPY
The USD/JPY pair continues to support the dollar's broad weakness. Yesterday, the yen strengthened by 97 pips, and the lower shadow of the daily candle tested the target support at 141.23. During the correction, the price approached the resistance level at 142.70 by this morning.

Image

This level is strong, so we do not believe that there is a reason for the price to overcome it. After completing the correction, a consolidation could form before the level for 1-2 days. After that, we expect a new test of support at 141.23 and further down to 140.35, coinciding with the embedded line of the price channel.

Image

On the 4-hour chart, the price and the Marlin oscillator formed a weak convergence. However, the oscillator quickly moved upward, so it may briefly linger at elevated values before turning downward.

Analysis are provided by InstaForex.

Read More https://ifxpr.com/47SoMc6
Best regards, PR Manager

Learn more about InstaForex Company at http://instaforex.com
IFX Gertrude
 
Posts: 5198
Joined: Wed Nov 07, 2012 6:25 am

PreviousNext

Return to Forex Brokers


cron